Mean State
Download Data |
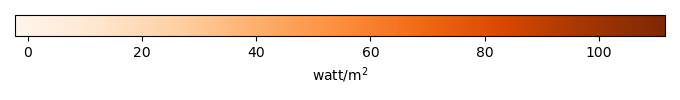
Period Mean (original grids) [watt/m2] |
Model Period Mean (intersection) [watt/m2] |
Benchmark Period Mean (intersection) [watt/m2] |
Model Period Mean (complement) [watt/m2] |
Benchmark Period Mean (complement) [watt/m2] |
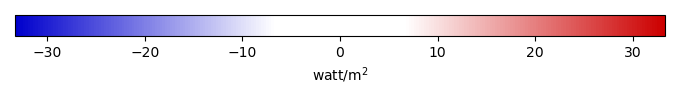
Bias [watt/m2] |
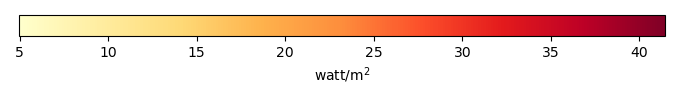
RMSE [watt/m2] |
Phase Shift [months] |
Bias Score [1] |
RMSE Score [1] |
Seasonal Cycle Score [1] |
Spatial Distribution Score [1] |
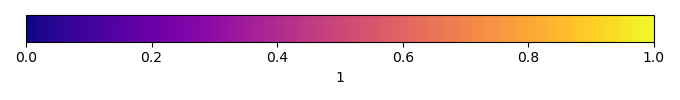
Overall Score [1] |
|||
|---|---|---|---|---|---|---|---|---|---|---|---|---|---|---|---|---|
| Benchmark | [-] | 79.9 | ||||||||||||||
| h0 | [-] | 71.9 | 72.3 | 80.0 | 64.8 | 38.6 | -8.11 | 16.5 | 1.53 | 0.558 | 0.635 | 0.764 | 0.986 | 0.716 | ||
| h0a | [-] | 71.9 | 72.3 | 80.0 | 64.8 | 38.6 | -8.11 | 16.5 | 1.53 | 0.558 | 0.635 | 0.764 | 0.986 | 0.716 |
Download Data |
Period Mean (original grids) [watt/m2] |
Model Period Mean (intersection) [watt/m2] |
Benchmark Period Mean (intersection) [watt/m2] |
Model Period Mean (complement) [watt/m2] |
Benchmark Period Mean (complement) [watt/m2] |
Bias [watt/m2] |
RMSE [watt/m2] |
Phase Shift [months] |
Bias Score [1] |
RMSE Score [1] |
Seasonal Cycle Score [1] |
Spatial Distribution Score [1] |
Overall Score [1] |
|||
|---|---|---|---|---|---|---|---|---|---|---|---|---|---|---|---|---|
| Benchmark | [-] | 59.1 | ||||||||||||||
| h0 | [-] | 48.3 | 48.0 | 59.1 | 31.2 | 81.2 | -11.1 | 24.2 | 1.42 | 0.441 | 0.351 | 0.782 | 0.992 | 0.583 | ||
| h0a | [-] | 48.3 | 48.0 | 59.1 | 31.2 | 81.2 | -11.1 | 24.2 | 1.42 | 0.441 | 0.351 | 0.782 | 0.992 | 0.583 |
Download Data |
Period Mean (original grids) [watt/m2] |
Model Period Mean (intersection) [watt/m2] |
Benchmark Period Mean (intersection) [watt/m2] |
Model Period Mean (complement) [watt/m2] |
Benchmark Period Mean (complement) [watt/m2] |
Bias [watt/m2] |
RMSE [watt/m2] |
Phase Shift [months] |
Bias Score [1] |
RMSE Score [1] |
Seasonal Cycle Score [1] |
Spatial Distribution Score [1] |
Overall Score [1] |
|||
|---|---|---|---|---|---|---|---|---|---|---|---|---|---|---|---|---|
| Benchmark | [-] | 58.6 | ||||||||||||||
| h0 | [-] | 45.6 | 45.1 | 58.6 | 53.8 | 55.8 | -13.1 | 25.7 | 1.11 | 0.372 | 0.364 | 0.855 | 0.977 | 0.586 | ||
| h0a | [-] | 45.6 | 45.1 | 58.6 | 53.8 | 55.8 | -13.1 | 25.7 | 1.11 | 0.372 | 0.364 | 0.855 | 0.977 | 0.586 |
Download Data |
Period Mean (original grids) [watt/m2] |
Model Period Mean (intersection) [watt/m2] |
Benchmark Period Mean (intersection) [watt/m2] |
Model Period Mean (complement) [watt/m2] |
Benchmark Period Mean (complement) [watt/m2] |
Bias [watt/m2] |
RMSE [watt/m2] |
Phase Shift [months] |
Bias Score [1] |
RMSE Score [1] |
Seasonal Cycle Score [1] |
Spatial Distribution Score [1] |
Overall Score [1] |
|||
|---|---|---|---|---|---|---|---|---|---|---|---|---|---|---|---|---|
| Benchmark | [-] | 19.1 | ||||||||||||||
| h0 | [-] | 11.6 | 11.7 | 19.1 | 10.6 | 19.5 | -7.37 | 15.0 | 0.788 | 0.222 | 0.143 | 0.948 | 0.924 | 0.476 | ||
| h0a | [-] | 11.6 | 11.7 | 19.1 | 10.6 | 19.5 | -7.37 | 15.0 | 0.788 | 0.222 | 0.143 | 0.948 | 0.924 | 0.476 |
Download Data |
Period Mean (original grids) [watt/m2] |
Model Period Mean (intersection) [watt/m2] |
Benchmark Period Mean (intersection) [watt/m2] |
Model Period Mean (complement) [watt/m2] |
Benchmark Period Mean (complement) [watt/m2] |
Bias [watt/m2] |
RMSE [watt/m2] |
Phase Shift [months] |
Bias Score [1] |
RMSE Score [1] |
Seasonal Cycle Score [1] |
Spatial Distribution Score [1] |
Overall Score [1] |
|||
|---|---|---|---|---|---|---|---|---|---|---|---|---|---|---|---|---|
| Benchmark | [-] | 108. | ||||||||||||||
| h0 | [-] | 99.8 | 99.7 | 108. | 100. | 117. | -8.06 | 15.1 | 1.73 | 0.507 | 0.826 | 0.746 | 0.982 | 0.777 | ||
| h0a | [-] | 99.8 | 99.7 | 108. | 100. | 117. | -8.06 | 15.1 | 1.73 | 0.507 | 0.826 | 0.746 | 0.982 | 0.777 |
Download Data |
Period Mean (original grids) [watt/m2] |
Model Period Mean (intersection) [watt/m2] |
Benchmark Period Mean (intersection) [watt/m2] |
Model Period Mean (complement) [watt/m2] |
Benchmark Period Mean (complement) [watt/m2] |
Bias [watt/m2] |
RMSE [watt/m2] |
Phase Shift [months] |
Bias Score [1] |
RMSE Score [1] |
Seasonal Cycle Score [1] |
Spatial Distribution Score [1] |
Overall Score [1] |
|||
|---|---|---|---|---|---|---|---|---|---|---|---|---|---|---|---|---|
| Benchmark | [-] | 29.3 | ||||||||||||||
| h0 | [-] | 23.7 | 23.7 | 29.3 | 23.6 | 31.1 | -5.61 | 11.6 | 0.587 | 0.496 | 0.441 | 0.960 | 0.970 | 0.662 | ||
| h0a | [-] | 23.7 | 23.7 | 29.3 | 23.6 | 31.1 | -5.61 | 11.6 | 0.587 | 0.496 | 0.441 | 0.960 | 0.970 | 0.662 |
Download Data |
Period Mean (original grids) [watt/m2] |
Model Period Mean (intersection) [watt/m2] |
Benchmark Period Mean (intersection) [watt/m2] |
Model Period Mean (complement) [watt/m2] |
Benchmark Period Mean (complement) [watt/m2] |
Bias [watt/m2] |
RMSE [watt/m2] |
Phase Shift [months] |
Bias Score [1] |
RMSE Score [1] |
Seasonal Cycle Score [1] |
Spatial Distribution Score [1] |
Overall Score [1] |
|||
|---|---|---|---|---|---|---|---|---|---|---|---|---|---|---|---|---|
| Benchmark | [-] | 35.9 | ||||||||||||||
| h0 | [-] | 27.2 | 28.4 | 35.9 | 18.3 | 66.4 | -6.99 | 13.6 | 0.611 | 0.495 | 0.551 | 0.947 | 0.986 | 0.706 | ||
| h0a | [-] | 27.2 | 28.4 | 35.9 | 18.3 | 66.4 | -6.99 | 13.6 | 0.611 | 0.495 | 0.551 | 0.947 | 0.986 | 0.706 |
Download Data |
Period Mean (original grids) [watt/m2] |
Model Period Mean (intersection) [watt/m2] |
Benchmark Period Mean (intersection) [watt/m2] |
Model Period Mean (complement) [watt/m2] |
Benchmark Period Mean (complement) [watt/m2] |
Bias [watt/m2] |
RMSE [watt/m2] |
Phase Shift [months] |
Bias Score [1] |
RMSE Score [1] |
Seasonal Cycle Score [1] |
Spatial Distribution Score [1] |
Overall Score [1] |
|||
|---|---|---|---|---|---|---|---|---|---|---|---|---|---|---|---|---|
| Benchmark | [-] | 66.8 | ||||||||||||||
| h0 | [-] | 54.2 | 54.5 | 66.7 | 49.4 | 105. | -10.4 | 19.8 | 1.12 | 0.498 | 0.539 | 0.846 | 0.979 | 0.680 | ||
| h0a | [-] | 54.2 | 54.5 | 66.7 | 49.4 | 105. | -10.4 | 19.8 | 1.12 | 0.498 | 0.539 | 0.846 | 0.979 | 0.680 |
Download Data |
Period Mean (original grids) [watt/m2] |
Model Period Mean (intersection) [watt/m2] |
Benchmark Period Mean (intersection) [watt/m2] |
Model Period Mean (complement) [watt/m2] |
Benchmark Period Mean (complement) [watt/m2] |
Bias [watt/m2] |
RMSE [watt/m2] |
Phase Shift [months] |
Bias Score [1] |
RMSE Score [1] |
Seasonal Cycle Score [1] |
Spatial Distribution Score [1] |
Overall Score [1] |
|||
|---|---|---|---|---|---|---|---|---|---|---|---|---|---|---|---|---|
| Benchmark | [-] | 18.3 | ||||||||||||||
| h0 | [-] | 14.8 | 15.3 | 18.3 | 8.64 | 17.7 | -3.14 | 13.1 | 0.614 | 0.558 | 0.209 | 0.959 | 0.889 | 0.565 | ||
| h0a | [-] | 14.8 | 15.3 | 18.3 | 8.64 | 17.7 | -3.14 | 13.1 | 0.614 | 0.558 | 0.209 | 0.959 | 0.889 | 0.565 |
Download Data |
Period Mean (original grids) [watt/m2] |
Model Period Mean (intersection) [watt/m2] |
Benchmark Period Mean (intersection) [watt/m2] |
Model Period Mean (complement) [watt/m2] |
Benchmark Period Mean (complement) [watt/m2] |
Bias [watt/m2] |
RMSE [watt/m2] |
Phase Shift [months] |
Bias Score [1] |
RMSE Score [1] |
Seasonal Cycle Score [1] |
Spatial Distribution Score [1] |
Overall Score [1] |
|||
|---|---|---|---|---|---|---|---|---|---|---|---|---|---|---|---|---|
| Benchmark | [-] | 35.0 | ||||||||||||||
| h0 | [-] | 31.8 | 30.7 | 34.9 | 54.4 | 61.5 | -2.61 | 11.8 | 1.19 | 0.658 | 0.631 | 0.850 | 0.948 | 0.744 | ||
| h0a | [-] | 31.8 | 30.7 | 34.9 | 54.4 | 61.5 | -2.61 | 11.8 | 1.19 | 0.658 | 0.631 | 0.850 | 0.948 | 0.744 |
Download Data |
Period Mean (original grids) [watt/m2] |
Model Period Mean (intersection) [watt/m2] |
Benchmark Period Mean (intersection) [watt/m2] |
Model Period Mean (complement) [watt/m2] |
Benchmark Period Mean (complement) [watt/m2] |
Bias [watt/m2] |
RMSE [watt/m2] |
Phase Shift [months] |
Bias Score [1] |
RMSE Score [1] |
Seasonal Cycle Score [1] |
Spatial Distribution Score [1] |
Overall Score [1] |
|||
|---|---|---|---|---|---|---|---|---|---|---|---|---|---|---|---|---|
| Benchmark | [-] | 40.3 | ||||||||||||||
| h0 | [-] | 32.6 | 32.7 | 40.3 | 31.9 | 46.7 | -7.77 | 13.5 | 0.660 | 0.460 | 0.573 | 0.955 | 0.989 | 0.710 | ||
| h0a | [-] | 32.6 | 32.7 | 40.3 | 31.9 | 46.7 | -7.77 | 13.5 | 0.660 | 0.460 | 0.573 | 0.955 | 0.989 | 0.710 |
Download Data |
Period Mean (original grids) [watt/m2] |
Model Period Mean (intersection) [watt/m2] |
Benchmark Period Mean (intersection) [watt/m2] |
Model Period Mean (complement) [watt/m2] |
Benchmark Period Mean (complement) [watt/m2] |
Bias [watt/m2] |
RMSE [watt/m2] |
Phase Shift [months] |
Bias Score [1] |
RMSE Score [1] |
Seasonal Cycle Score [1] |
Spatial Distribution Score [1] |
Overall Score [1] |
|||
|---|---|---|---|---|---|---|---|---|---|---|---|---|---|---|---|---|
| Benchmark | [-] | 48.9 | ||||||||||||||
| h0 | [-] | 33.7 | 41.1 | 48.9 | 8.86 | 68.1 | -7.30 | 16.0 | 0.893 | 0.489 | 0.521 | 0.893 | 0.987 | 0.682 | ||
| h0a | [-] | 33.7 | 41.1 | 48.9 | 8.86 | 68.1 | -7.30 | 16.0 | 0.893 | 0.489 | 0.521 | 0.893 | 0.987 | 0.682 |
Download Data |
Period Mean (original grids) [watt/m2] |
Model Period Mean (intersection) [watt/m2] |
Benchmark Period Mean (intersection) [watt/m2] |
Model Period Mean (complement) [watt/m2] |
Benchmark Period Mean (complement) [watt/m2] |
Bias [watt/m2] |
RMSE [watt/m2] |
Phase Shift [months] |
Bias Score [1] |
RMSE Score [1] |
Seasonal Cycle Score [1] |
Spatial Distribution Score [1] |
Overall Score [1] |
|||
|---|---|---|---|---|---|---|---|---|---|---|---|---|---|---|---|---|
| Benchmark | [-] | 29.1 | ||||||||||||||
| h0 | [-] | 9.38 | 19.3 | 29.1 | 5.05 | 30.4 | -9.59 | 16.6 | 1.20 | 0.404 | 0.563 | 0.834 | 0.925 | 0.658 | ||
| h0a | [-] | 9.38 | 19.3 | 29.1 | 5.05 | 30.4 | -9.59 | 16.6 | 1.20 | 0.404 | 0.563 | 0.834 | 0.925 | 0.658 |
Download Data |
Period Mean (original grids) [watt/m2] |
Model Period Mean (intersection) [watt/m2] |
Benchmark Period Mean (intersection) [watt/m2] |
Model Period Mean (complement) [watt/m2] |
Benchmark Period Mean (complement) [watt/m2] |
Bias [watt/m2] |
RMSE [watt/m2] |
Phase Shift [months] |
Bias Score [1] |
RMSE Score [1] |
Seasonal Cycle Score [1] |
Spatial Distribution Score [1] |
Overall Score [1] |
|||
|---|---|---|---|---|---|---|---|---|---|---|---|---|---|---|---|---|
| Benchmark | [-] | 18.6 | ||||||||||||||
| h0 | [-] | 15.3 | 16.3 | 18.6 | 8.28 | 17.1 | -2.64 | 12.8 | 0.305 | 0.509 | 0.275 | 0.979 | 0.973 | 0.602 | ||
| h0a | [-] | 15.3 | 16.3 | 18.6 | 8.28 | 17.1 | -2.64 | 12.8 | 0.305 | 0.509 | 0.275 | 0.979 | 0.973 | 0.602 |
Download Data |
Period Mean (original grids) [watt/m2] |
Model Period Mean (intersection) [watt/m2] |
Benchmark Period Mean (intersection) [watt/m2] |
Model Period Mean (complement) [watt/m2] |
Benchmark Period Mean (complement) [watt/m2] |
Bias [watt/m2] |
RMSE [watt/m2] |
Phase Shift [months] |
Bias Score [1] |
RMSE Score [1] |
Seasonal Cycle Score [1] |
Spatial Distribution Score [1] |
Overall Score [1] |
|||
|---|---|---|---|---|---|---|---|---|---|---|---|---|---|---|---|---|
| Benchmark | [-] | 67.8 | ||||||||||||||
| h0 | [-] | 59.7 | 58.1 | 67.7 | 74.9 | 101. | -7.13 | 18.1 | 0.865 | 0.488 | 0.576 | 0.901 | 0.968 | 0.702 | ||
| h0a | [-] | 59.7 | 58.1 | 67.7 | 74.9 | 101. | -7.13 | 18.1 | 0.865 | 0.488 | 0.576 | 0.901 | 0.968 | 0.702 |
Download Data |
Period Mean (original grids) [watt/m2] |
Model Period Mean (intersection) [watt/m2] |
Benchmark Period Mean (intersection) [watt/m2] |
Model Period Mean (complement) [watt/m2] |
Benchmark Period Mean (complement) [watt/m2] |
Bias [watt/m2] |
RMSE [watt/m2] |
Phase Shift [months] |
Bias Score [1] |
RMSE Score [1] |
Seasonal Cycle Score [1] |
Spatial Distribution Score [1] |
Overall Score [1] |
|||
|---|---|---|---|---|---|---|---|---|---|---|---|---|---|---|---|---|
| Benchmark | [-] | 58.7 | ||||||||||||||
| h0 | [-] | 51.3 | 51.4 | 58.7 | 52.3 | 64.7 | -6.63 | 14.2 | 0.197 | 0.492 | 0.555 | 0.986 | 0.936 | 0.705 | ||
| h0a | [-] | 51.3 | 51.4 | 58.7 | 52.3 | 64.7 | -6.63 | 14.2 | 0.197 | 0.492 | 0.555 | 0.986 | 0.936 | 0.705 |
Download Data |
Period Mean (original grids) [watt/m2] |
Model Period Mean (intersection) [watt/m2] |
Benchmark Period Mean (intersection) [watt/m2] |
Model Period Mean (complement) [watt/m2] |
Benchmark Period Mean (complement) [watt/m2] |
Bias [watt/m2] |
RMSE [watt/m2] |
Phase Shift [months] |
Bias Score [1] |
RMSE Score [1] |
Seasonal Cycle Score [1] |
Spatial Distribution Score [1] |
Overall Score [1] |
|||
|---|---|---|---|---|---|---|---|---|---|---|---|---|---|---|---|---|
| Benchmark | [-] | 32.9 | ||||||||||||||
| h0 | [-] | 29.9 | 29.9 | 32.9 | 33.2 | 40.9 | -2.98 | 9.94 | 0.168 | 0.687 | 0.580 | 0.989 | 0.991 | 0.765 | ||
| h0a | [-] | 29.9 | 29.9 | 32.9 | 33.2 | 40.9 | -2.98 | 9.94 | 0.168 | 0.687 | 0.580 | 0.989 | 0.991 | 0.765 |
Download Data |
Period Mean (original grids) [watt/m2] |
Model Period Mean (intersection) [watt/m2] |
Benchmark Period Mean (intersection) [watt/m2] |
Model Period Mean (complement) [watt/m2] |
Benchmark Period Mean (complement) [watt/m2] |
Bias [watt/m2] |
RMSE [watt/m2] |
Phase Shift [months] |
Bias Score [1] |
RMSE Score [1] |
Seasonal Cycle Score [1] |
Spatial Distribution Score [1] |
Overall Score [1] |
|||
|---|---|---|---|---|---|---|---|---|---|---|---|---|---|---|---|---|
| Benchmark | [-] | 33.8 | ||||||||||||||
| h0 | [-] | 25.0 | 25.4 | 33.8 | 38.8 | 56.9 | -8.26 | 13.4 | 0.828 | 0.473 | 0.605 | 0.918 | 0.981 | 0.716 | ||
| h0a | [-] | 25.0 | 25.4 | 33.8 | 38.8 | 56.9 | -8.26 | 13.4 | 0.828 | 0.473 | 0.605 | 0.918 | 0.981 | 0.716 |
Download Data |
Period Mean (original grids) [watt/m2] |
Model Period Mean (intersection) [watt/m2] |
Benchmark Period Mean (intersection) [watt/m2] |
Model Period Mean (complement) [watt/m2] |
Benchmark Period Mean (complement) [watt/m2] |
Bias [watt/m2] |
RMSE [watt/m2] |
Phase Shift [months] |
Bias Score [1] |
RMSE Score [1] |
Seasonal Cycle Score [1] |
Spatial Distribution Score [1] |
Overall Score [1] |
|||
|---|---|---|---|---|---|---|---|---|---|---|---|---|---|---|---|---|
| Benchmark | [-] | 99.8 | ||||||||||||||
| h0 | [-] | 91.4 | 91.6 | 99.8 | 87.2 | 116. | -8.29 | 17.1 | 1.47 | 0.475 | 0.761 | 0.785 | 0.810 | 0.718 | ||
| h0a | [-] | 91.4 | 91.6 | 99.8 | 87.2 | 116. | -8.29 | 17.1 | 1.47 | 0.475 | 0.761 | 0.785 | 0.810 | 0.718 |
Download Data |
Period Mean (original grids) [watt/m2] |
Model Period Mean (intersection) [watt/m2] |
Benchmark Period Mean (intersection) [watt/m2] |
Model Period Mean (complement) [watt/m2] |
Benchmark Period Mean (complement) [watt/m2] |
Bias [watt/m2] |
RMSE [watt/m2] |
Phase Shift [months] |
Bias Score [1] |
RMSE Score [1] |
Seasonal Cycle Score [1] |
Spatial Distribution Score [1] |
Overall Score [1] |
|||
|---|---|---|---|---|---|---|---|---|---|---|---|---|---|---|---|---|
| Benchmark | [-] | 70.4 | ||||||||||||||
| h0 | [-] | 63.8 | 63.4 | 70.4 | 68.3 | 61.9 | -6.82 | 19.2 | 0.838 | 0.516 | 0.599 | 0.916 | 0.865 | 0.699 | ||
| h0a | [-] | 63.8 | 63.4 | 70.4 | 68.3 | 61.9 | -6.82 | 19.2 | 0.838 | 0.516 | 0.599 | 0.916 | 0.865 | 0.699 |
Download Data |
Period Mean (original grids) [watt/m2] |
Model Period Mean (intersection) [watt/m2] |
Benchmark Period Mean (intersection) [watt/m2] |
Model Period Mean (complement) [watt/m2] |
Benchmark Period Mean (complement) [watt/m2] |
Bias [watt/m2] |
RMSE [watt/m2] |
Phase Shift [months] |
Bias Score [1] |
RMSE Score [1] |
Seasonal Cycle Score [1] |
Spatial Distribution Score [1] |
Overall Score [1] |
|||
|---|---|---|---|---|---|---|---|---|---|---|---|---|---|---|---|---|
| Benchmark | [-] | 34.7 | ||||||||||||||
| h0 | [-] | 27.5 | 29.1 | 34.7 | 13.9 | 30.5 | -5.62 | 14.9 | 0.724 | 0.381 | 0.616 | 0.921 | 0.869 | 0.681 | ||
| h0a | [-] | 27.5 | 29.1 | 34.7 | 13.9 | 30.5 | -5.62 | 14.9 | 0.724 | 0.381 | 0.616 | 0.921 | 0.869 | 0.681 |
Temporally integrated period mean