Mean State
Download Data |
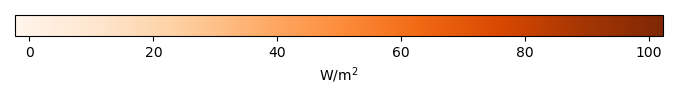
Period Mean (original grids) [W/m2] |
Model Period Mean (intersection) [W/m2] |
Benchmark Period Mean (intersection) [W/m2] |
Model Period Mean (complement) [W/m2] |
Benchmark Period Mean (complement) [W/m2] |
Bias [W/m2] |
RMSE [W/m2] |
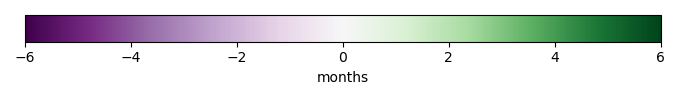
Phase Shift [months] |
Bias Score [1] |
RMSE Score [1] |
Seasonal Cycle Score [1] |
Spatial Distribution Score [1] |
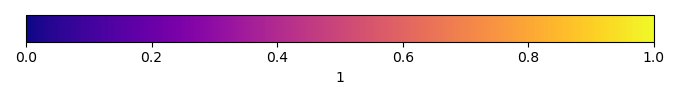
Overall Score [1] |
|||
|---|---|---|---|---|---|---|---|---|---|---|---|---|---|---|---|---|
| Benchmark | [-] | 71.1 | ||||||||||||||
| h0 | [-] | 72.0 | 72.5 | 71.2 | 65.2 | 6.43 | 0.643 | 14.0 | 1.96 | 0.623 | 0.691 | 0.710 | 0.980 | 0.739 | ||
| h0a | [-] | 72.0 | 72.5 | 71.2 | 65.2 | 6.43 | 0.643 | 14.0 | 1.96 | 0.623 | 0.691 | 0.710 | 0.980 | 0.739 |
Download Data |
Period Mean (original grids) [W/m2] |
Model Period Mean (intersection) [W/m2] |
Benchmark Period Mean (intersection) [W/m2] |
Model Period Mean (complement) [W/m2] |
Benchmark Period Mean (complement) [W/m2] |
Bias [W/m2] |
RMSE [W/m2] |
Phase Shift [months] |
Bias Score [1] |
RMSE Score [1] |
Seasonal Cycle Score [1] |
Spatial Distribution Score [1] |
Overall Score [1] |
|||
|---|---|---|---|---|---|---|---|---|---|---|---|---|---|---|---|---|
| Benchmark | [-] | 48.6 | ||||||||||||||
| h0 | [-] | 49.4 | 48.8 | 48.6 | 44.4 | 0.00 | 0.0269 | 24.1 | 1.39 | 0.495 | 0.286 | 0.800 | 0.890 | 0.551 | ||
| h0a | [-] | 49.4 | 48.8 | 48.6 | 44.4 | 0.00 | 0.0269 | 24.1 | 1.39 | 0.495 | 0.286 | 0.800 | 0.890 | 0.551 |
Download Data |
Period Mean (original grids) [W/m2] |
Model Period Mean (intersection) [W/m2] |
Benchmark Period Mean (intersection) [W/m2] |
Model Period Mean (complement) [W/m2] |
Benchmark Period Mean (complement) [W/m2] |
Bias [W/m2] |
RMSE [W/m2] |
Phase Shift [months] |
Bias Score [1] |
RMSE Score [1] |
Seasonal Cycle Score [1] |
Spatial Distribution Score [1] |
Overall Score [1] |
|||
|---|---|---|---|---|---|---|---|---|---|---|---|---|---|---|---|---|
| Benchmark | [-] | 52.1 | ||||||||||||||
| h0 | [-] | 46.1 | 45.8 | 52.2 | 51.2 | 10.7 | -6.22 | 21.0 | 1.28 | 0.467 | 0.551 | 0.835 | 0.963 | 0.673 | ||
| h0a | [-] | 46.1 | 45.8 | 52.2 | 51.2 | 10.7 | -6.22 | 21.0 | 1.28 | 0.467 | 0.551 | 0.835 | 0.963 | 0.673 |
Download Data |
Period Mean (original grids) [W/m2] |
Model Period Mean (intersection) [W/m2] |
Benchmark Period Mean (intersection) [W/m2] |
Model Period Mean (complement) [W/m2] |
Benchmark Period Mean (complement) [W/m2] |
Bias [W/m2] |
RMSE [W/m2] |
Phase Shift [months] |
Bias Score [1] |
RMSE Score [1] |
Seasonal Cycle Score [1] |
Spatial Distribution Score [1] |
Overall Score [1] |
|||
|---|---|---|---|---|---|---|---|---|---|---|---|---|---|---|---|---|
| Benchmark | [-] | 15.0 | ||||||||||||||
| h0 | [-] | 11.8 | 11.9 | 15.2 | 11.0 | -2.58 | -3.29 | 10.6 | 0.193 | 0.406 | 0.421 | 0.984 | 0.557 | 0.558 | ||
| h0a | [-] | 11.8 | 11.9 | 15.2 | 11.0 | -2.58 | -3.29 | 10.6 | 0.193 | 0.406 | 0.421 | 0.984 | 0.557 | 0.558 |
Download Data |
Period Mean (original grids) [W/m2] |
Model Period Mean (intersection) [W/m2] |
Benchmark Period Mean (intersection) [W/m2] |
Model Period Mean (complement) [W/m2] |
Benchmark Period Mean (complement) [W/m2] |
Bias [W/m2] |
RMSE [W/m2] |
Phase Shift [months] |
Bias Score [1] |
RMSE Score [1] |
Seasonal Cycle Score [1] |
Spatial Distribution Score [1] |
Overall Score [1] |
|||
|---|---|---|---|---|---|---|---|---|---|---|---|---|---|---|---|---|
| Benchmark | [-] | 77.6 | ||||||||||||||
| h0 | [-] | 101. | 100. | 78.6 | 103. | 25.9 | 21.7 | 26.7 | 2.34 | 0.439 | 0.840 | 0.638 | 0.326 | 0.617 | ||
| h0a | [-] | 101. | 100. | 78.6 | 103. | 25.9 | 21.7 | 26.7 | 2.34 | 0.439 | 0.840 | 0.638 | 0.326 | 0.617 |
Download Data |
Period Mean (original grids) [W/m2] |
Model Period Mean (intersection) [W/m2] |
Benchmark Period Mean (intersection) [W/m2] |
Model Period Mean (complement) [W/m2] |
Benchmark Period Mean (complement) [W/m2] |
Bias [W/m2] |
RMSE [W/m2] |
Phase Shift [months] |
Bias Score [1] |
RMSE Score [1] |
Seasonal Cycle Score [1] |
Spatial Distribution Score [1] |
Overall Score [1] |
|||
|---|---|---|---|---|---|---|---|---|---|---|---|---|---|---|---|---|
| Benchmark | [-] | 26.4 | ||||||||||||||
| h0 | [-] | 24.0 | 23.9 | 26.4 | 24.7 | 0.396 | -2.58 | 9.66 | 0.297 | 0.614 | 0.533 | 0.979 | 0.976 | 0.727 | ||
| h0a | [-] | 24.0 | 23.9 | 26.4 | 24.7 | 0.396 | -2.58 | 9.66 | 0.297 | 0.614 | 0.533 | 0.979 | 0.976 | 0.727 |
Download Data |
Period Mean (original grids) [W/m2] |
Model Period Mean (intersection) [W/m2] |
Benchmark Period Mean (intersection) [W/m2] |
Model Period Mean (complement) [W/m2] |
Benchmark Period Mean (complement) [W/m2] |
Bias [W/m2] |
RMSE [W/m2] |
Phase Shift [months] |
Bias Score [1] |
RMSE Score [1] |
Seasonal Cycle Score [1] |
Spatial Distribution Score [1] |
Overall Score [1] |
|||
|---|---|---|---|---|---|---|---|---|---|---|---|---|---|---|---|---|
| Benchmark | [-] | 28.2 | ||||||||||||||
| h0 | [-] | 26.7 | 26.6 | 28.2 | 29.7 | 15.0 | -1.18 | 12.2 | 0.744 | 0.567 | 0.613 | 0.927 | 0.914 | 0.727 | ||
| h0a | [-] | 26.7 | 26.6 | 28.2 | 29.7 | 15.0 | -1.18 | 12.2 | 0.744 | 0.567 | 0.613 | 0.927 | 0.914 | 0.727 |
Download Data |
Period Mean (original grids) [W/m2] |
Model Period Mean (intersection) [W/m2] |
Benchmark Period Mean (intersection) [W/m2] |
Model Period Mean (complement) [W/m2] |
Benchmark Period Mean (complement) [W/m2] |
Bias [W/m2] |
RMSE [W/m2] |
Phase Shift [months] |
Bias Score [1] |
RMSE Score [1] |
Seasonal Cycle Score [1] |
Spatial Distribution Score [1] |
Overall Score [1] |
|||
|---|---|---|---|---|---|---|---|---|---|---|---|---|---|---|---|---|
| Benchmark | [-] | 57.6 | ||||||||||||||
| h0 | [-] | 54.0 | 53.2 | 57.7 | 71.9 | 31.2 | -2.29 | 21.5 | 1.20 | 0.464 | 0.589 | 0.850 | 0.969 | 0.692 | ||
| h0a | [-] | 54.0 | 53.2 | 57.7 | 71.9 | 31.2 | -2.29 | 21.5 | 1.20 | 0.464 | 0.589 | 0.850 | 0.969 | 0.692 |
Download Data |
Period Mean (original grids) [W/m2] |
Model Period Mean (intersection) [W/m2] |
Benchmark Period Mean (intersection) [W/m2] |
Model Period Mean (complement) [W/m2] |
Benchmark Period Mean (complement) [W/m2] |
Bias [W/m2] |
RMSE [W/m2] |
Phase Shift [months] |
Bias Score [1] |
RMSE Score [1] |
Seasonal Cycle Score [1] |
Spatial Distribution Score [1] |
Overall Score [1] |
|||
|---|---|---|---|---|---|---|---|---|---|---|---|---|---|---|---|---|
| Benchmark | [-] | 15.8 | ||||||||||||||
| h0 | [-] | 14.9 | 15.2 | 15.9 | 7.95 | -8.34 | -0.905 | 12.1 | 0.196 | 0.590 | 0.281 | 0.985 | 0.830 | 0.593 | ||
| h0a | [-] | 14.9 | 15.2 | 15.9 | 7.95 | -8.34 | -0.905 | 12.1 | 0.196 | 0.590 | 0.281 | 0.985 | 0.830 | 0.593 |
Download Data |
Period Mean (original grids) [W/m2] |
Model Period Mean (intersection) [W/m2] |
Benchmark Period Mean (intersection) [W/m2] |
Model Period Mean (complement) [W/m2] |
Benchmark Period Mean (complement) [W/m2] |
Bias [W/m2] |
RMSE [W/m2] |
Phase Shift [months] |
Bias Score [1] |
RMSE Score [1] |
Seasonal Cycle Score [1] |
Spatial Distribution Score [1] |
Overall Score [1] |
|||
|---|---|---|---|---|---|---|---|---|---|---|---|---|---|---|---|---|
| Benchmark | [-] | 27.2 | ||||||||||||||
| h0 | [-] | 32.0 | 31.0 | 27.3 | 51.4 | 12.4 | 5.73 | 13.0 | 1.15 | 0.636 | 0.669 | 0.865 | 0.914 | 0.750 | ||
| h0a | [-] | 32.0 | 31.0 | 27.3 | 51.4 | 12.4 | 5.73 | 13.0 | 1.15 | 0.636 | 0.669 | 0.865 | 0.914 | 0.750 |
Download Data |
Period Mean (original grids) [W/m2] |
Model Period Mean (intersection) [W/m2] |
Benchmark Period Mean (intersection) [W/m2] |
Model Period Mean (complement) [W/m2] |
Benchmark Period Mean (complement) [W/m2] |
Bias [W/m2] |
RMSE [W/m2] |
Phase Shift [months] |
Bias Score [1] |
RMSE Score [1] |
Seasonal Cycle Score [1] |
Spatial Distribution Score [1] |
Overall Score [1] |
|||
|---|---|---|---|---|---|---|---|---|---|---|---|---|---|---|---|---|
| Benchmark | [-] | 31.7 | ||||||||||||||
| h0 | [-] | 32.4 | 32.4 | 31.9 | 32.0 | 7.29 | 0.275 | 13.9 | 0.618 | 0.588 | 0.530 | 0.956 | 0.873 | 0.696 | ||
| h0a | [-] | 32.4 | 32.4 | 31.9 | 32.0 | 7.29 | 0.275 | 13.9 | 0.618 | 0.588 | 0.530 | 0.956 | 0.873 | 0.696 |
Download Data |
Period Mean (original grids) [W/m2] |
Model Period Mean (intersection) [W/m2] |
Benchmark Period Mean (intersection) [W/m2] |
Model Period Mean (complement) [W/m2] |
Benchmark Period Mean (complement) [W/m2] |
Bias [W/m2] |
RMSE [W/m2] |
Phase Shift [months] |
Bias Score [1] |
RMSE Score [1] |
Seasonal Cycle Score [1] |
Spatial Distribution Score [1] |
Overall Score [1] |
|||
|---|---|---|---|---|---|---|---|---|---|---|---|---|---|---|---|---|
| Benchmark | [-] | 39.5 | ||||||||||||||
| h0 | [-] | 33.8 | 39.9 | 39.6 | 7.75 | 12.1 | 0.675 | 15.2 | 0.999 | 0.558 | 0.567 | 0.874 | 0.972 | 0.707 | ||
| h0a | [-] | 33.8 | 39.9 | 39.6 | 7.75 | 12.1 | 0.675 | 15.2 | 0.999 | 0.558 | 0.567 | 0.874 | 0.972 | 0.707 |
Download Data |
Period Mean (original grids) [W/m2] |
Model Period Mean (intersection) [W/m2] |
Benchmark Period Mean (intersection) [W/m2] |
Model Period Mean (complement) [W/m2] |
Benchmark Period Mean (complement) [W/m2] |
Bias [W/m2] |
RMSE [W/m2] |
Phase Shift [months] |
Bias Score [1] |
RMSE Score [1] |
Seasonal Cycle Score [1] |
Spatial Distribution Score [1] |
Overall Score [1] |
|||
|---|---|---|---|---|---|---|---|---|---|---|---|---|---|---|---|---|
| Benchmark | [-] | 8.37 | ||||||||||||||
| h0 | [-] | 9.45 | 14.9 | 8.39 | 4.58 | 4.38 | 6.84 | 12.5 | 1.15 | 0.553 | 0.623 | 0.851 | 0.917 | 0.714 | ||
| h0a | [-] | 9.45 | 14.9 | 8.39 | 4.58 | 4.38 | 6.84 | 12.5 | 1.15 | 0.553 | 0.623 | 0.851 | 0.917 | 0.714 |
Download Data |
Period Mean (original grids) [W/m2] |
Model Period Mean (intersection) [W/m2] |
Benchmark Period Mean (intersection) [W/m2] |
Model Period Mean (complement) [W/m2] |
Benchmark Period Mean (complement) [W/m2] |
Bias [W/m2] |
RMSE [W/m2] |
Phase Shift [months] |
Bias Score [1] |
RMSE Score [1] |
Seasonal Cycle Score [1] |
Spatial Distribution Score [1] |
Overall Score [1] |
|||
|---|---|---|---|---|---|---|---|---|---|---|---|---|---|---|---|---|
| Benchmark | [-] | 14.0 | ||||||||||||||
| h0 | [-] | 15.5 | 15.8 | 14.1 | 7.81 | 0.451 | 1.19 | 12.3 | 0.351 | 0.592 | 0.308 | 0.973 | 0.895 | 0.615 | ||
| h0a | [-] | 15.5 | 15.8 | 14.1 | 7.81 | 0.451 | 1.19 | 12.3 | 0.351 | 0.592 | 0.308 | 0.973 | 0.895 | 0.615 |
Download Data |
Period Mean (original grids) [W/m2] |
Model Period Mean (intersection) [W/m2] |
Benchmark Period Mean (intersection) [W/m2] |
Model Period Mean (complement) [W/m2] |
Benchmark Period Mean (complement) [W/m2] |
Bias [W/m2] |
RMSE [W/m2] |
Phase Shift [months] |
Bias Score [1] |
RMSE Score [1] |
Seasonal Cycle Score [1] |
Spatial Distribution Score [1] |
Overall Score [1] |
|||
|---|---|---|---|---|---|---|---|---|---|---|---|---|---|---|---|---|
| Benchmark | [-] | 50.3 | ||||||||||||||
| h0 | [-] | 59.1 | 57.8 | 50.7 | 73.7 | 19.0 | 9.50 | 21.7 | 1.11 | 0.455 | 0.671 | 0.862 | 0.920 | 0.716 | ||
| h0a | [-] | 59.1 | 57.8 | 50.7 | 73.7 | 19.0 | 9.50 | 21.7 | 1.11 | 0.455 | 0.671 | 0.862 | 0.920 | 0.716 |
Download Data |
Period Mean (original grids) [W/m2] |
Model Period Mean (intersection) [W/m2] |
Benchmark Period Mean (intersection) [W/m2] |
Model Period Mean (complement) [W/m2] |
Benchmark Period Mean (complement) [W/m2] |
Bias [W/m2] |
RMSE [W/m2] |
Phase Shift [months] |
Bias Score [1] |
RMSE Score [1] |
Seasonal Cycle Score [1] |
Spatial Distribution Score [1] |
Overall Score [1] |
|||
|---|---|---|---|---|---|---|---|---|---|---|---|---|---|---|---|---|
| Benchmark | [-] | 49.7 | ||||||||||||||
| h0 | [-] | 51.5 | 51.5 | 49.7 | 58.4 | 14.7 | 2.23 | 12.0 | 0.242 | 0.664 | 0.651 | 0.982 | 0.984 | 0.787 | ||
| h0a | [-] | 51.5 | 51.5 | 49.7 | 58.4 | 14.7 | 2.23 | 12.0 | 0.242 | 0.664 | 0.651 | 0.982 | 0.984 | 0.787 |
Download Data |
Period Mean (original grids) [W/m2] |
Model Period Mean (intersection) [W/m2] |
Benchmark Period Mean (intersection) [W/m2] |
Model Period Mean (complement) [W/m2] |
Benchmark Period Mean (complement) [W/m2] |
Bias [W/m2] |
RMSE [W/m2] |
Phase Shift [months] |
Bias Score [1] |
RMSE Score [1] |
Seasonal Cycle Score [1] |
Spatial Distribution Score [1] |
Overall Score [1] |
|||
|---|---|---|---|---|---|---|---|---|---|---|---|---|---|---|---|---|
| Benchmark | [-] | 25.3 | ||||||||||||||
| h0 | [-] | 30.0 | 30.0 | 25.3 | 33.6 | 6.07 | 4.62 | 12.8 | 0.157 | 0.596 | 0.460 | 0.989 | 0.977 | 0.696 | ||
| h0a | [-] | 30.0 | 30.0 | 25.3 | 33.6 | 6.07 | 4.62 | 12.8 | 0.157 | 0.596 | 0.460 | 0.989 | 0.977 | 0.696 |
Download Data |
Period Mean (original grids) [W/m2] |
Model Period Mean (intersection) [W/m2] |
Benchmark Period Mean (intersection) [W/m2] |
Model Period Mean (complement) [W/m2] |
Benchmark Period Mean (complement) [W/m2] |
Bias [W/m2] |
RMSE [W/m2] |
Phase Shift [months] |
Bias Score [1] |
RMSE Score [1] |
Seasonal Cycle Score [1] |
Spatial Distribution Score [1] |
Overall Score [1] |
|||
|---|---|---|---|---|---|---|---|---|---|---|---|---|---|---|---|---|
| Benchmark | [-] | 26.9 | ||||||||||||||
| h0 | [-] | 24.9 | 25.3 | 26.9 | 34.2 | 17.8 | -1.45 | 10.9 | 0.828 | 0.640 | 0.643 | 0.923 | 0.978 | 0.765 | ||
| h0a | [-] | 24.9 | 25.3 | 26.9 | 34.2 | 17.8 | -1.45 | 10.9 | 0.828 | 0.640 | 0.643 | 0.923 | 0.978 | 0.765 |
Download Data |
Period Mean (original grids) [W/m2] |
Model Period Mean (intersection) [W/m2] |
Benchmark Period Mean (intersection) [W/m2] |
Model Period Mean (complement) [W/m2] |
Benchmark Period Mean (complement) [W/m2] |
Bias [W/m2] |
RMSE [W/m2] |
Phase Shift [months] |
Bias Score [1] |
RMSE Score [1] |
Seasonal Cycle Score [1] |
Spatial Distribution Score [1] |
Overall Score [1] |
|||
|---|---|---|---|---|---|---|---|---|---|---|---|---|---|---|---|---|
| Benchmark | [-] | 90.1 | ||||||||||||||
| h0 | [-] | 91.5 | 91.5 | 90.2 | 91.5 | 29.7 | 1.06 | 15.0 | 2.56 | 0.643 | 0.716 | 0.592 | 0.903 | 0.714 | ||
| h0a | [-] | 91.5 | 91.5 | 90.2 | 91.5 | 29.7 | 1.06 | 15.0 | 2.56 | 0.643 | 0.716 | 0.592 | 0.903 | 0.714 |
Download Data |
Period Mean (original grids) [W/m2] |
Model Period Mean (intersection) [W/m2] |
Benchmark Period Mean (intersection) [W/m2] |
Model Period Mean (complement) [W/m2] |
Benchmark Period Mean (complement) [W/m2] |
Bias [W/m2] |
RMSE [W/m2] |
Phase Shift [months] |
Bias Score [1] |
RMSE Score [1] |
Seasonal Cycle Score [1] |
Spatial Distribution Score [1] |
Overall Score [1] |
|||
|---|---|---|---|---|---|---|---|---|---|---|---|---|---|---|---|---|
| Benchmark | [-] | 69.3 | ||||||||||||||
| h0 | [-] | 63.1 | 62.8 | 69.4 | 64.5 | 17.7 | -6.51 | 20.9 | 1.01 | 0.472 | 0.603 | 0.889 | 0.913 | 0.696 | ||
| h0a | [-] | 63.1 | 62.8 | 69.4 | 64.5 | 17.7 | -6.51 | 20.9 | 1.01 | 0.472 | 0.603 | 0.889 | 0.913 | 0.696 |
Download Data |
Period Mean (original grids) [W/m2] |
Model Period Mean (intersection) [W/m2] |
Benchmark Period Mean (intersection) [W/m2] |
Model Period Mean (complement) [W/m2] |
Benchmark Period Mean (complement) [W/m2] |
Bias [W/m2] |
RMSE [W/m2] |
Phase Shift [months] |
Bias Score [1] |
RMSE Score [1] |
Seasonal Cycle Score [1] |
Spatial Distribution Score [1] |
Overall Score [1] |
|||
|---|---|---|---|---|---|---|---|---|---|---|---|---|---|---|---|---|
| Benchmark | [-] | 22.7 | ||||||||||||||
| h0 | [-] | 27.5 | 27.7 | 22.8 | 18.0 | 3.19 | 4.97 | 14.0 | 1.01 | 0.529 | 0.615 | 0.880 | 0.925 | 0.713 | ||
| h0a | [-] | 27.5 | 27.7 | 22.8 | 18.0 | 3.19 | 4.97 | 14.0 | 1.01 | 0.529 | 0.615 | 0.880 | 0.925 | 0.713 |
Temporally integrated period mean