Mean State
Download Data |
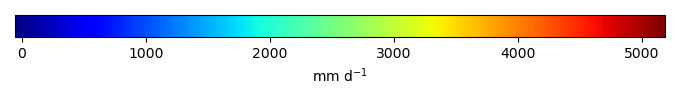
Period Mean (original grids) [mm d-1] |
Model Period Mean (intersection) [mm d-1] |
Benchmark Period Mean (intersection) [mm d-1] |
Model Period Mean (complement) [mm d-1] |
Benchmark Period Mean (complement) [mm d-1] |
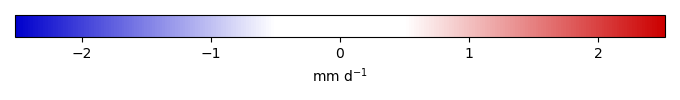
Bias [mm d-1] |
RMSE [mm d-1] |
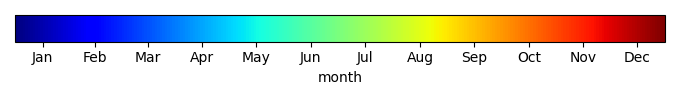
Phase Shift [months] |
Bias Score [1] |
RMSE Score [1] |
Seasonal Cycle Score [1] |
Spatial Distribution Score [1] |
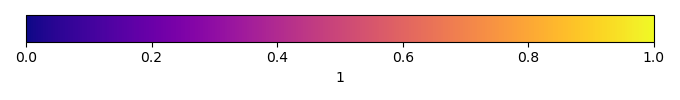
Overall Score [1] |
|||
|---|---|---|---|---|---|---|---|---|---|---|---|---|---|---|---|---|
| Benchmark | [-] | 1.03 | ||||||||||||||
| h0 | [-] | 1.26 | 1.24 | 1.03 | 1.98 | 0.00366 | 0.235 | 0.871 | 1.76 | 0.526 | 0.600 | 0.736 | 0.898 | 0.672 | ||
| h0a | [-] | 1.26 | 1.24 | 1.03 | 1.98 | 0.00366 | 0.235 | 0.871 | 1.76 | 0.526 | 0.600 | 0.736 | 0.898 | 0.672 |
Download Data |
Period Mean (original grids) [mm d-1] |
Model Period Mean (intersection) [mm d-1] |
Benchmark Period Mean (intersection) [mm d-1] |
Model Period Mean (complement) [mm d-1] |
Benchmark Period Mean (complement) [mm d-1] |
Bias [mm d-1] |
RMSE [mm d-1] |
Phase Shift [months] |
Bias Score [1] |
RMSE Score [1] |
Seasonal Cycle Score [1] |
Spatial Distribution Score [1] |
Overall Score [1] |
|||
|---|---|---|---|---|---|---|---|---|---|---|---|---|---|---|---|---|
| Benchmark | [-] | 0.422 | ||||||||||||||
| h0 | [-] | 0.865 | 0.850 | 0.422 | 1.92 | 3.63 | 0.427 | 0.760 | 0.866 | 0.387 | 0.443 | 0.899 | 0.776 | 0.589 | ||
| h0a | [-] | 0.865 | 0.850 | 0.422 | 1.92 | 3.63 | 0.427 | 0.760 | 0.866 | 0.387 | 0.443 | 0.899 | 0.776 | 0.589 |
Download Data |
Period Mean (original grids) [mm d-1] |
Model Period Mean (intersection) [mm d-1] |
Benchmark Period Mean (intersection) [mm d-1] |
Model Period Mean (complement) [mm d-1] |
Benchmark Period Mean (complement) [mm d-1] |
Bias [mm d-1] |
RMSE [mm d-1] |
Phase Shift [months] |
Bias Score [1] |
RMSE Score [1] |
Seasonal Cycle Score [1] |
Spatial Distribution Score [1] |
Overall Score [1] |
|||
|---|---|---|---|---|---|---|---|---|---|---|---|---|---|---|---|---|
| Benchmark | [-] | 0.420 | ||||||||||||||
| h0 | [-] | 0.790 | 0.793 | 0.420 | 0.670 | 0.357 | 0.365 | 0.715 | 1.43 | 0.432 | 0.576 | 0.801 | 0.863 | 0.649 | ||
| h0a | [-] | 0.790 | 0.793 | 0.420 | 0.670 | 0.357 | 0.365 | 0.715 | 1.43 | 0.432 | 0.576 | 0.801 | 0.863 | 0.649 |
Download Data |
Period Mean (original grids) [mm d-1] |
Model Period Mean (intersection) [mm d-1] |
Benchmark Period Mean (intersection) [mm d-1] |
Model Period Mean (complement) [mm d-1] |
Benchmark Period Mean (complement) [mm d-1] |
Bias [mm d-1] |
RMSE [mm d-1] |
Phase Shift [months] |
Bias Score [1] |
RMSE Score [1] |
Seasonal Cycle Score [1] |
Spatial Distribution Score [1] |
Overall Score [1] |
|||
|---|---|---|---|---|---|---|---|---|---|---|---|---|---|---|---|---|
| Benchmark | [-] | 0.995 | ||||||||||||||
| h0 | [-] | 0.572 | 0.518 | 0.994 | 0.986 | 2.48 | -0.462 | 1.20 | 0.599 | 0.297 | 0.413 | 0.943 | 0.736 | 0.561 | ||
| h0a | [-] | 0.572 | 0.518 | 0.994 | 0.986 | 2.48 | -0.462 | 1.20 | 0.599 | 0.297 | 0.413 | 0.943 | 0.736 | 0.561 |
Download Data |
Period Mean (original grids) [mm d-1] |
Model Period Mean (intersection) [mm d-1] |
Benchmark Period Mean (intersection) [mm d-1] |
Model Period Mean (complement) [mm d-1] |
Benchmark Period Mean (complement) [mm d-1] |
Bias [mm d-1] |
RMSE [mm d-1] |
Phase Shift [months] |
Bias Score [1] |
RMSE Score [1] |
Seasonal Cycle Score [1] |
Spatial Distribution Score [1] |
Overall Score [1] |
|||
|---|---|---|---|---|---|---|---|---|---|---|---|---|---|---|---|---|
| Benchmark | [-] | 2.90 | ||||||||||||||
| h0 | [-] | 4.52 | 4.91 | 2.90 | 3.68 | 3.25 | 1.78 | 2.45 | 1.43 | 0.358 | 0.671 | 0.803 | 0.879 | 0.676 | ||
| h0a | [-] | 4.52 | 4.91 | 2.90 | 3.68 | 3.25 | 1.78 | 2.45 | 1.43 | 0.358 | 0.671 | 0.803 | 0.879 | 0.676 |
Download Data |
Period Mean (original grids) [mm d-1] |
Model Period Mean (intersection) [mm d-1] |
Benchmark Period Mean (intersection) [mm d-1] |
Model Period Mean (complement) [mm d-1] |
Benchmark Period Mean (complement) [mm d-1] |
Bias [mm d-1] |
RMSE [mm d-1] |
Phase Shift [months] |
Bias Score [1] |
RMSE Score [1] |
Seasonal Cycle Score [1] |
Spatial Distribution Score [1] |
Overall Score [1] |
|||
|---|---|---|---|---|---|---|---|---|---|---|---|---|---|---|---|---|
| Benchmark | [-] | 0.804 | ||||||||||||||
| h0 | [-] | 0.524 | 0.518 | 0.804 | 0.957 | 2.85 | -0.282 | 0.815 | 0.670 | 0.390 | 0.536 | 0.920 | 0.814 | 0.639 | ||
| h0a | [-] | 0.524 | 0.518 | 0.804 | 0.957 | 2.85 | -0.282 | 0.815 | 0.670 | 0.390 | 0.536 | 0.920 | 0.814 | 0.639 |
Download Data |
Period Mean (original grids) [mm d-1] |
Model Period Mean (intersection) [mm d-1] |
Benchmark Period Mean (intersection) [mm d-1] |
Model Period Mean (complement) [mm d-1] |
Benchmark Period Mean (complement) [mm d-1] |
Bias [mm d-1] |
RMSE [mm d-1] |
Phase Shift [months] |
Bias Score [1] |
RMSE Score [1] |
Seasonal Cycle Score [1] |
Spatial Distribution Score [1] |
Overall Score [1] |
|||
|---|---|---|---|---|---|---|---|---|---|---|---|---|---|---|---|---|
| Benchmark | [-] | 0.519 | ||||||||||||||
| h0 | [-] | 0.571 | 0.574 | 0.518 | 0.726 | 1.63 | 0.0719 | 0.525 | 1.23 | 0.474 | 0.567 | 0.835 | 0.911 | 0.671 | ||
| h0a | [-] | 0.571 | 0.574 | 0.518 | 0.726 | 1.63 | 0.0719 | 0.525 | 1.23 | 0.474 | 0.567 | 0.835 | 0.911 | 0.671 |
Download Data |
Period Mean (original grids) [mm d-1] |
Model Period Mean (intersection) [mm d-1] |
Benchmark Period Mean (intersection) [mm d-1] |
Model Period Mean (complement) [mm d-1] |
Benchmark Period Mean (complement) [mm d-1] |
Bias [mm d-1] |
RMSE [mm d-1] |
Phase Shift [months] |
Bias Score [1] |
RMSE Score [1] |
Seasonal Cycle Score [1] |
Spatial Distribution Score [1] |
Overall Score [1] |
|||
|---|---|---|---|---|---|---|---|---|---|---|---|---|---|---|---|---|
| Benchmark | [-] | 1.42 | ||||||||||||||
| h0 | [-] | 1.79 | 1.63 | 1.42 | 3.30 | 2.68 | 0.240 | 1.56 | 1.13 | 0.477 | 0.427 | 0.868 | 0.913 | 0.623 | ||
| h0a | [-] | 1.79 | 1.63 | 1.42 | 3.30 | 2.68 | 0.240 | 1.56 | 1.13 | 0.477 | 0.427 | 0.868 | 0.913 | 0.623 |
Download Data |
Period Mean (original grids) [mm d-1] |
Model Period Mean (intersection) [mm d-1] |
Benchmark Period Mean (intersection) [mm d-1] |
Model Period Mean (complement) [mm d-1] |
Benchmark Period Mean (complement) [mm d-1] |
Bias [mm d-1] |
RMSE [mm d-1] |
Phase Shift [months] |
Bias Score [1] |
RMSE Score [1] |
Seasonal Cycle Score [1] |
Spatial Distribution Score [1] |
Overall Score [1] |
|||
|---|---|---|---|---|---|---|---|---|---|---|---|---|---|---|---|---|
| Benchmark | [-] | 1.12 | ||||||||||||||
| h0 | [-] | 0.590 | 0.576 | 1.12 | 0.701 | -0.534 | 1.32 | 0.363 | 0.208 | 0.340 | 0.975 | 0.562 | 0.485 | |||
| h0a | [-] | 0.590 | 0.576 | 1.12 | 0.701 | -0.534 | 1.32 | 0.363 | 0.208 | 0.340 | 0.975 | 0.562 | 0.485 |
Download Data |
Period Mean (original grids) [mm d-1] |
Model Period Mean (intersection) [mm d-1] |
Benchmark Period Mean (intersection) [mm d-1] |
Model Period Mean (complement) [mm d-1] |
Benchmark Period Mean (complement) [mm d-1] |
Bias [mm d-1] |
RMSE [mm d-1] |
Phase Shift [months] |
Bias Score [1] |
RMSE Score [1] |
Seasonal Cycle Score [1] |
Spatial Distribution Score [1] |
Overall Score [1] |
|||
|---|---|---|---|---|---|---|---|---|---|---|---|---|---|---|---|---|
| Benchmark | [-] | 0.240 | ||||||||||||||
| h0 | [-] | 0.282 | 0.232 | 0.239 | 0.923 | 1.63 | 0.0184 | 0.264 | 1.89 | 0.482 | 0.618 | 0.726 | 0.818 | 0.653 | ||
| h0a | [-] | 0.282 | 0.232 | 0.239 | 0.923 | 1.63 | 0.0184 | 0.264 | 1.89 | 0.482 | 0.618 | 0.726 | 0.818 | 0.653 |
Download Data |
Period Mean (original grids) [mm d-1] |
Model Period Mean (intersection) [mm d-1] |
Benchmark Period Mean (intersection) [mm d-1] |
Model Period Mean (complement) [mm d-1] |
Benchmark Period Mean (complement) [mm d-1] |
Bias [mm d-1] |
RMSE [mm d-1] |
Phase Shift [months] |
Bias Score [1] |
RMSE Score [1] |
Seasonal Cycle Score [1] |
Spatial Distribution Score [1] |
Overall Score [1] |
|||
|---|---|---|---|---|---|---|---|---|---|---|---|---|---|---|---|---|
| Benchmark | [-] | 0.930 | ||||||||||||||
| h0 | [-] | 1.11 | 1.05 | 0.930 | 1.53 | 1.08 | 0.122 | 0.752 | 1.68 | 0.376 | 0.515 | 0.752 | 0.945 | 0.621 | ||
| h0a | [-] | 1.11 | 1.05 | 0.930 | 1.53 | 1.08 | 0.122 | 0.752 | 1.68 | 0.376 | 0.515 | 0.752 | 0.945 | 0.621 |
Download Data |
Period Mean (original grids) [mm d-1] |
Model Period Mean (intersection) [mm d-1] |
Benchmark Period Mean (intersection) [mm d-1] |
Model Period Mean (complement) [mm d-1] |
Benchmark Period Mean (complement) [mm d-1] |
Bias [mm d-1] |
RMSE [mm d-1] |
Phase Shift [months] |
Bias Score [1] |
RMSE Score [1] |
Seasonal Cycle Score [1] |
Spatial Distribution Score [1] |
Overall Score [1] |
|||
|---|---|---|---|---|---|---|---|---|---|---|---|---|---|---|---|---|
| Benchmark | [-] | 0.841 | ||||||||||||||
| h0 | [-] | 0.817 | 0.864 | 0.841 | 0.573 | 1.46 | 0.0377 | 0.807 | 1.34 | 0.463 | 0.562 | 0.815 | 0.915 | 0.664 | ||
| h0a | [-] | 0.817 | 0.864 | 0.841 | 0.573 | 1.46 | 0.0377 | 0.807 | 1.34 | 0.463 | 0.562 | 0.815 | 0.915 | 0.664 |
Download Data |
Period Mean (original grids) [mm d-1] |
Model Period Mean (intersection) [mm d-1] |
Benchmark Period Mean (intersection) [mm d-1] |
Model Period Mean (complement) [mm d-1] |
Benchmark Period Mean (complement) [mm d-1] |
Bias [mm d-1] |
RMSE [mm d-1] |
Phase Shift [months] |
Bias Score [1] |
RMSE Score [1] |
Seasonal Cycle Score [1] |
Spatial Distribution Score [1] |
Overall Score [1] |
|||
|---|---|---|---|---|---|---|---|---|---|---|---|---|---|---|---|---|
| Benchmark | [-] | 0.0577 | ||||||||||||||
| h0 | [-] | 0.0718 | 0.0681 | 0.0576 | 0.119 | 0.232 | 0.0123 | 0.0950 | 2.00 | 0.664 | 0.735 | 0.691 | 0.827 | 0.731 | ||
| h0a | [-] | 0.0718 | 0.0681 | 0.0576 | 0.119 | 0.232 | 0.0123 | 0.0950 | 2.00 | 0.664 | 0.735 | 0.691 | 0.827 | 0.731 |
Download Data |
Period Mean (original grids) [mm d-1] |
Model Period Mean (intersection) [mm d-1] |
Benchmark Period Mean (intersection) [mm d-1] |
Model Period Mean (complement) [mm d-1] |
Benchmark Period Mean (complement) [mm d-1] |
Bias [mm d-1] |
RMSE [mm d-1] |
Phase Shift [months] |
Bias Score [1] |
RMSE Score [1] |
Seasonal Cycle Score [1] |
Spatial Distribution Score [1] |
Overall Score [1] |
|||
|---|---|---|---|---|---|---|---|---|---|---|---|---|---|---|---|---|
| Benchmark | [-] | 0.967 | ||||||||||||||
| h0 | [-] | 0.694 | 0.683 | 0.967 | 0.735 | 1.04 | -0.266 | 1.13 | 0.792 | 0.369 | 0.399 | 0.918 | 0.904 | 0.598 | ||
| h0a | [-] | 0.694 | 0.683 | 0.967 | 0.735 | 1.04 | -0.266 | 1.13 | 0.792 | 0.369 | 0.399 | 0.918 | 0.904 | 0.598 |
Download Data |
Period Mean (original grids) [mm d-1] |
Model Period Mean (intersection) [mm d-1] |
Benchmark Period Mean (intersection) [mm d-1] |
Model Period Mean (complement) [mm d-1] |
Benchmark Period Mean (complement) [mm d-1] |
Bias [mm d-1] |
RMSE [mm d-1] |
Phase Shift [months] |
Bias Score [1] |
RMSE Score [1] |
Seasonal Cycle Score [1] |
Spatial Distribution Score [1] |
Overall Score [1] |
|||
|---|---|---|---|---|---|---|---|---|---|---|---|---|---|---|---|---|
| Benchmark | [-] | 1.04 | ||||||||||||||
| h0 | [-] | 1.02 | 0.945 | 1.04 | 1.40 | 1.10 | -0.0692 | 0.877 | 1.36 | 0.479 | 0.549 | 0.821 | 0.925 | 0.664 | ||
| h0a | [-] | 1.02 | 0.945 | 1.04 | 1.40 | 1.10 | -0.0692 | 0.877 | 1.36 | 0.479 | 0.549 | 0.821 | 0.925 | 0.664 |
Download Data |
Period Mean (original grids) [mm d-1] |
Model Period Mean (intersection) [mm d-1] |
Benchmark Period Mean (intersection) [mm d-1] |
Model Period Mean (complement) [mm d-1] |
Benchmark Period Mean (complement) [mm d-1] |
Bias [mm d-1] |
RMSE [mm d-1] |
Phase Shift [months] |
Bias Score [1] |
RMSE Score [1] |
Seasonal Cycle Score [1] |
Spatial Distribution Score [1] |
Overall Score [1] |
|||
|---|---|---|---|---|---|---|---|---|---|---|---|---|---|---|---|---|
| Benchmark | [-] | 0.831 | ||||||||||||||
| h0 | [-] | 1.13 | 1.14 | 0.831 | 1.17 | 0.765 | 0.310 | 0.577 | 1.46 | 0.458 | 0.671 | 0.798 | 0.971 | 0.714 | ||
| h0a | [-] | 1.13 | 1.14 | 0.831 | 1.17 | 0.765 | 0.310 | 0.577 | 1.46 | 0.458 | 0.671 | 0.798 | 0.971 | 0.714 |
Download Data |
Period Mean (original grids) [mm d-1] |
Model Period Mean (intersection) [mm d-1] |
Benchmark Period Mean (intersection) [mm d-1] |
Model Period Mean (complement) [mm d-1] |
Benchmark Period Mean (complement) [mm d-1] |
Bias [mm d-1] |
RMSE [mm d-1] |
Phase Shift [months] |
Bias Score [1] |
RMSE Score [1] |
Seasonal Cycle Score [1] |
Spatial Distribution Score [1] |
Overall Score [1] |
|||
|---|---|---|---|---|---|---|---|---|---|---|---|---|---|---|---|---|
| Benchmark | [-] | 1.17 | ||||||||||||||
| h0 | [-] | 1.03 | 0.874 | 1.17 | 3.11 | 6.21 | -0.258 | 1.01 | 0.948 | 0.504 | 0.535 | 0.883 | 0.947 | 0.681 | ||
| h0a | [-] | 1.03 | 0.874 | 1.17 | 3.11 | 6.21 | -0.258 | 1.01 | 0.948 | 0.504 | 0.535 | 0.883 | 0.947 | 0.681 |
Download Data |
Period Mean (original grids) [mm d-1] |
Model Period Mean (intersection) [mm d-1] |
Benchmark Period Mean (intersection) [mm d-1] |
Model Period Mean (complement) [mm d-1] |
Benchmark Period Mean (complement) [mm d-1] |
Bias [mm d-1] |
RMSE [mm d-1] |
Phase Shift [months] |
Bias Score [1] |
RMSE Score [1] |
Seasonal Cycle Score [1] |
Spatial Distribution Score [1] |
Overall Score [1] |
|||
|---|---|---|---|---|---|---|---|---|---|---|---|---|---|---|---|---|
| Benchmark | [-] | 0.280 | ||||||||||||||
| h0 | [-] | 0.439 | 0.408 | 0.279 | 2.71 | 1.59 | 0.141 | 0.427 | 1.74 | 0.371 | 0.592 | 0.753 | 0.908 | 0.643 | ||
| h0a | [-] | 0.439 | 0.408 | 0.279 | 2.71 | 1.59 | 0.141 | 0.427 | 1.74 | 0.371 | 0.592 | 0.753 | 0.908 | 0.643 |
Download Data |
Period Mean (original grids) [mm d-1] |
Model Period Mean (intersection) [mm d-1] |
Benchmark Period Mean (intersection) [mm d-1] |
Model Period Mean (complement) [mm d-1] |
Benchmark Period Mean (complement) [mm d-1] |
Bias [mm d-1] |
RMSE [mm d-1] |
Phase Shift [months] |
Bias Score [1] |
RMSE Score [1] |
Seasonal Cycle Score [1] |
Spatial Distribution Score [1] |
Overall Score [1] |
|||
|---|---|---|---|---|---|---|---|---|---|---|---|---|---|---|---|---|
| Benchmark | [-] | 3.42 | ||||||||||||||
| h0 | [-] | 2.75 | 2.72 | 3.42 | 3.43 | 1.51 | -0.686 | 2.21 | 0.981 | 0.398 | 0.410 | 0.892 | 0.934 | 0.609 | ||
| h0a | [-] | 2.75 | 2.72 | 3.42 | 3.43 | 1.51 | -0.686 | 2.21 | 0.981 | 0.398 | 0.410 | 0.892 | 0.934 | 0.609 |
Download Data |
Period Mean (original grids) [mm d-1] |
Model Period Mean (intersection) [mm d-1] |
Benchmark Period Mean (intersection) [mm d-1] |
Model Period Mean (complement) [mm d-1] |
Benchmark Period Mean (complement) [mm d-1] |
Bias [mm d-1] |
RMSE [mm d-1] |
Phase Shift [months] |
Bias Score [1] |
RMSE Score [1] |
Seasonal Cycle Score [1] |
Spatial Distribution Score [1] |
Overall Score [1] |
|||
|---|---|---|---|---|---|---|---|---|---|---|---|---|---|---|---|---|
| Benchmark | [-] | 0.639 | ||||||||||||||
| h0 | [-] | 0.923 | 0.924 | 0.639 | 0.781 | 1.29 | 0.284 | 0.706 | 1.82 | 0.527 | 0.736 | 0.737 | 0.893 | 0.726 | ||
| h0a | [-] | 0.923 | 0.924 | 0.639 | 0.781 | 1.29 | 0.284 | 0.706 | 1.82 | 0.527 | 0.736 | 0.737 | 0.893 | 0.726 |
Download Data |
Period Mean (original grids) [mm d-1] |
Model Period Mean (intersection) [mm d-1] |
Benchmark Period Mean (intersection) [mm d-1] |
Model Period Mean (complement) [mm d-1] |
Benchmark Period Mean (complement) [mm d-1] |
Bias [mm d-1] |
RMSE [mm d-1] |
Phase Shift [months] |
Bias Score [1] |
RMSE Score [1] |
Seasonal Cycle Score [1] |
Spatial Distribution Score [1] |
Overall Score [1] |
|||
|---|---|---|---|---|---|---|---|---|---|---|---|---|---|---|---|---|
| Benchmark | [-] | 0.576 | ||||||||||||||
| h0 | [-] | 0.750 | 0.688 | 0.576 | 1.43 | 0.0217 | 0.123 | 0.676 | 1.71 | 0.472 | 0.558 | 0.754 | 0.832 | 0.635 | ||
| h0a | [-] | 0.750 | 0.688 | 0.576 | 1.43 | 0.0217 | 0.123 | 0.676 | 1.71 | 0.472 | 0.558 | 0.754 | 0.832 | 0.635 |
Temporally integrated period mean