Mean State
Download Data |
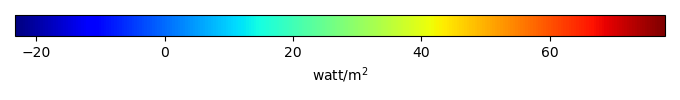
Period Mean (original grids) [watt/m2] |
Model Period Mean (intersection) [watt/m2] |
Benchmark Period Mean (intersection) [watt/m2] |
Model Period Mean (complement) [watt/m2] |
Benchmark Period Mean (complement) [watt/m2] |
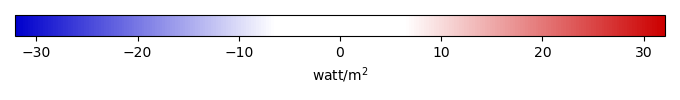
Bias [watt/m2] |
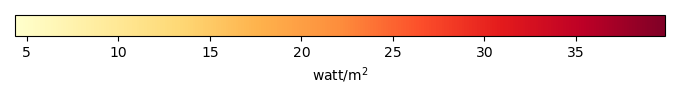
RMSE [watt/m2] |
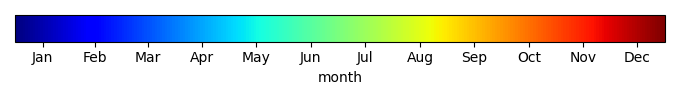
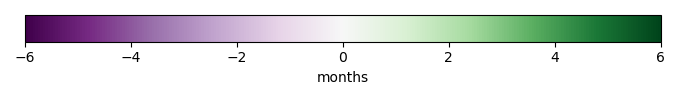
Phase Shift [months] |
Bias Score [1] |
RMSE Score [1] |
Seasonal Cycle Score [1] |
Spatial Distribution Score [1] |
Overall Score [1] |
|||
|---|---|---|---|---|---|---|---|---|---|---|---|---|---|---|---|---|
| Benchmark | [-] | 45.9 | ||||||||||||||
| h0 | [-] | 36.5 | 36.5 | 45.9 | 42.6 | 74.8 | -9.01 | 16.8 | 1.77 | 0.347 | 0.691 | 0.745 | 0.703 | 0.635 | ||
| h0a | [-] | 36.5 | 36.5 | 45.9 | 42.6 | 74.8 | -9.01 | 16.8 | 1.77 | 0.347 | 0.691 | 0.745 | 0.703 | 0.635 |
Download Data |
Period Mean (original grids) [watt/m2] |
Model Period Mean (intersection) [watt/m2] |
Benchmark Period Mean (intersection) [watt/m2] |
Model Period Mean (complement) [watt/m2] |
Benchmark Period Mean (complement) [watt/m2] |
Bias [watt/m2] |
RMSE [watt/m2] |
Phase Shift [months] |
Bias Score [1] |
RMSE Score [1] |
Seasonal Cycle Score [1] |
Spatial Distribution Score [1] |
Overall Score [1] |
|||
|---|---|---|---|---|---|---|---|---|---|---|---|---|---|---|---|---|
| Benchmark | [-] | 54.9 | ||||||||||||||
| h0 | [-] | 52.1 | 52.2 | 54.9 | 54.6 | 55.6 | -2.83 | 18.8 | 0.948 | 0.629 | 0.355 | 0.901 | 0.873 | 0.623 | ||
| h0a | [-] | 52.1 | 52.2 | 54.9 | 54.6 | 55.6 | -2.83 | 18.8 | 0.948 | 0.629 | 0.355 | 0.901 | 0.873 | 0.623 |
Download Data |
Period Mean (original grids) [watt/m2] |
Model Period Mean (intersection) [watt/m2] |
Benchmark Period Mean (intersection) [watt/m2] |
Model Period Mean (complement) [watt/m2] |
Benchmark Period Mean (complement) [watt/m2] |
Bias [watt/m2] |
RMSE [watt/m2] |
Phase Shift [months] |
Bias Score [1] |
RMSE Score [1] |
Seasonal Cycle Score [1] |
Spatial Distribution Score [1] |
Overall Score [1] |
|||
|---|---|---|---|---|---|---|---|---|---|---|---|---|---|---|---|---|
| Benchmark | [-] | 59.5 | ||||||||||||||
| h0 | [-] | 59.3 | 59.5 | 59.5 | 57.0 | 59.9 | 0.0104 | 20.8 | 1.24 | 0.517 | 0.330 | 0.852 | 0.808 | 0.567 | ||
| h0a | [-] | 59.3 | 59.5 | 59.5 | 57.0 | 59.9 | 0.0104 | 20.8 | 1.24 | 0.517 | 0.330 | 0.852 | 0.808 | 0.567 |
Download Data |
Period Mean (original grids) [watt/m2] |
Model Period Mean (intersection) [watt/m2] |
Benchmark Period Mean (intersection) [watt/m2] |
Model Period Mean (complement) [watt/m2] |
Benchmark Period Mean (complement) [watt/m2] |
Bias [watt/m2] |
RMSE [watt/m2] |
Phase Shift [months] |
Bias Score [1] |
RMSE Score [1] |
Seasonal Cycle Score [1] |
Spatial Distribution Score [1] |
Overall Score [1] |
|||
|---|---|---|---|---|---|---|---|---|---|---|---|---|---|---|---|---|
| Benchmark | [-] | 23.6 | ||||||||||||||
| h0 | [-] | 15.8 | 16.3 | 23.6 | 8.32 | 21.5 | -7.81 | 22.1 | 0.804 | 0.489 | 0.222 | 0.929 | 0.391 | 0.451 | ||
| h0a | [-] | 15.8 | 16.3 | 23.6 | 8.32 | 21.5 | -7.81 | 22.1 | 0.804 | 0.489 | 0.222 | 0.929 | 0.391 | 0.451 |
Download Data |
Period Mean (original grids) [watt/m2] |
Model Period Mean (intersection) [watt/m2] |
Benchmark Period Mean (intersection) [watt/m2] |
Model Period Mean (complement) [watt/m2] |
Benchmark Period Mean (complement) [watt/m2] |
Bias [watt/m2] |
RMSE [watt/m2] |
Phase Shift [months] |
Bias Score [1] |
RMSE Score [1] |
Seasonal Cycle Score [1] |
Spatial Distribution Score [1] |
Overall Score [1] |
|||
|---|---|---|---|---|---|---|---|---|---|---|---|---|---|---|---|---|
| Benchmark | [-] | 34.1 | ||||||||||||||
| h0 | [-] | 22.7 | 21.0 | 34.1 | 29.6 | 37.1 | -11.2 | 15.9 | 1.12 | 0.382 | 0.777 | 0.842 | 0.518 | 0.659 | ||
| h0a | [-] | 22.7 | 21.0 | 34.1 | 29.6 | 37.1 | -11.2 | 15.9 | 1.12 | 0.382 | 0.777 | 0.842 | 0.518 | 0.659 |
Download Data |
Period Mean (original grids) [watt/m2] |
Model Period Mean (intersection) [watt/m2] |
Benchmark Period Mean (intersection) [watt/m2] |
Model Period Mean (complement) [watt/m2] |
Benchmark Period Mean (complement) [watt/m2] |
Bias [watt/m2] |
RMSE [watt/m2] |
Phase Shift [months] |
Bias Score [1] |
RMSE Score [1] |
Seasonal Cycle Score [1] |
Spatial Distribution Score [1] |
Overall Score [1] |
|||
|---|---|---|---|---|---|---|---|---|---|---|---|---|---|---|---|---|
| Benchmark | [-] | 28.6 | ||||||||||||||
| h0 | [-] | 24.4 | 24.4 | 28.6 | 25.0 | 32.6 | -4.11 | 14.6 | 0.750 | 0.591 | 0.450 | 0.932 | 0.726 | 0.630 | ||
| h0a | [-] | 24.4 | 24.4 | 28.6 | 25.0 | 32.6 | -4.11 | 14.6 | 0.750 | 0.591 | 0.450 | 0.932 | 0.726 | 0.630 |
Download Data |
Period Mean (original grids) [watt/m2] |
Model Period Mean (intersection) [watt/m2] |
Benchmark Period Mean (intersection) [watt/m2] |
Model Period Mean (complement) [watt/m2] |
Benchmark Period Mean (complement) [watt/m2] |
Bias [watt/m2] |
RMSE [watt/m2] |
Phase Shift [months] |
Bias Score [1] |
RMSE Score [1] |
Seasonal Cycle Score [1] |
Spatial Distribution Score [1] |
Overall Score [1] |
|||
|---|---|---|---|---|---|---|---|---|---|---|---|---|---|---|---|---|
| Benchmark | [-] | 34.1 | ||||||||||||||
| h0 | [-] | 33.7 | 33.1 | 34.1 | 37.6 | 27.6 | -0.991 | 12.3 | 0.820 | 0.508 | 0.613 | 0.911 | 0.976 | 0.724 | ||
| h0a | [-] | 33.7 | 33.1 | 34.1 | 37.6 | 27.6 | -0.991 | 12.3 | 0.820 | 0.508 | 0.613 | 0.911 | 0.976 | 0.724 |
Download Data |
Period Mean (original grids) [watt/m2] |
Model Period Mean (intersection) [watt/m2] |
Benchmark Period Mean (intersection) [watt/m2] |
Model Period Mean (complement) [watt/m2] |
Benchmark Period Mean (complement) [watt/m2] |
Bias [watt/m2] |
RMSE [watt/m2] |
Phase Shift [months] |
Bias Score [1] |
RMSE Score [1] |
Seasonal Cycle Score [1] |
Spatial Distribution Score [1] |
Overall Score [1] |
|||
|---|---|---|---|---|---|---|---|---|---|---|---|---|---|---|---|---|
| Benchmark | [-] | 43.3 | ||||||||||||||
| h0 | [-] | 35.2 | 34.4 | 43.3 | 41.5 | 35.3 | -8.82 | 16.8 | 0.903 | 0.435 | 0.579 | 0.916 | 0.746 | 0.651 | ||
| h0a | [-] | 35.2 | 34.4 | 43.3 | 41.5 | 35.3 | -8.82 | 16.8 | 0.903 | 0.435 | 0.579 | 0.916 | 0.746 | 0.651 |
Download Data |
Period Mean (original grids) [watt/m2] |
Model Period Mean (intersection) [watt/m2] |
Benchmark Period Mean (intersection) [watt/m2] |
Model Period Mean (complement) [watt/m2] |
Benchmark Period Mean (complement) [watt/m2] |
Bias [watt/m2] |
RMSE [watt/m2] |
Phase Shift [months] |
Bias Score [1] |
RMSE Score [1] |
Seasonal Cycle Score [1] |
Spatial Distribution Score [1] |
Overall Score [1] |
|||
|---|---|---|---|---|---|---|---|---|---|---|---|---|---|---|---|---|
| Benchmark | [-] | 19.6 | ||||||||||||||
| h0 | [-] | 7.03 | 7.56 | 19.6 | 0.339 | 12.9 | -12.2 | 24.4 | 1.06 | 0.297 | 0.192 | 0.880 | 0.616 | 0.435 | ||
| h0a | [-] | 7.03 | 7.56 | 19.6 | 0.339 | 12.9 | -12.2 | 24.4 | 1.06 | 0.297 | 0.192 | 0.880 | 0.616 | 0.435 |
Download Data |
Period Mean (original grids) [watt/m2] |
Model Period Mean (intersection) [watt/m2] |
Benchmark Period Mean (intersection) [watt/m2] |
Model Period Mean (complement) [watt/m2] |
Benchmark Period Mean (complement) [watt/m2] |
Bias [watt/m2] |
RMSE [watt/m2] |
Phase Shift [months] |
Bias Score [1] |
RMSE Score [1] |
Seasonal Cycle Score [1] |
Spatial Distribution Score [1] |
Overall Score [1] |
|||
|---|---|---|---|---|---|---|---|---|---|---|---|---|---|---|---|---|
| Benchmark | [-] | 62.2 | ||||||||||||||
| h0 | [-] | 60.4 | 61.0 | 62.2 | 47.7 | 54.0 | -2.05 | 12.1 | 0.689 | 0.638 | 0.582 | 0.937 | 0.871 | 0.722 | ||
| h0a | [-] | 60.4 | 61.0 | 62.2 | 47.7 | 54.0 | -2.05 | 12.1 | 0.689 | 0.638 | 0.582 | 0.937 | 0.871 | 0.722 |
Download Data |
Period Mean (original grids) [watt/m2] |
Model Period Mean (intersection) [watt/m2] |
Benchmark Period Mean (intersection) [watt/m2] |
Model Period Mean (complement) [watt/m2] |
Benchmark Period Mean (complement) [watt/m2] |
Bias [watt/m2] |
RMSE [watt/m2] |
Phase Shift [months] |
Bias Score [1] |
RMSE Score [1] |
Seasonal Cycle Score [1] |
Spatial Distribution Score [1] |
Overall Score [1] |
|||
|---|---|---|---|---|---|---|---|---|---|---|---|---|---|---|---|---|
| Benchmark | [-] | 24.0 | ||||||||||||||
| h0 | [-] | 20.7 | 20.2 | 24.0 | 26.9 | 33.3 | -2.91 | 11.1 | 0.812 | 0.537 | 0.604 | 0.910 | 0.930 | 0.717 | ||
| h0a | [-] | 20.7 | 20.2 | 24.0 | 26.9 | 33.3 | -2.91 | 11.1 | 0.812 | 0.537 | 0.604 | 0.910 | 0.930 | 0.717 |
Download Data |
Period Mean (original grids) [watt/m2] |
Model Period Mean (intersection) [watt/m2] |
Benchmark Period Mean (intersection) [watt/m2] |
Model Period Mean (complement) [watt/m2] |
Benchmark Period Mean (complement) [watt/m2] |
Bias [watt/m2] |
RMSE [watt/m2] |
Phase Shift [months] |
Bias Score [1] |
RMSE Score [1] |
Seasonal Cycle Score [1] |
Spatial Distribution Score [1] |
Overall Score [1] |
|||
|---|---|---|---|---|---|---|---|---|---|---|---|---|---|---|---|---|
| Benchmark | [-] | 40.5 | ||||||||||||||
| h0 | [-] | 30.7 | 36.1 | 40.5 | 12.5 | 39.3 | -4.42 | 16.4 | 0.971 | 0.470 | 0.514 | 0.892 | 0.909 | 0.660 | ||
| h0a | [-] | 30.7 | 36.1 | 40.5 | 12.5 | 39.3 | -4.42 | 16.4 | 0.971 | 0.470 | 0.514 | 0.892 | 0.909 | 0.660 |
Download Data |
Period Mean (original grids) [watt/m2] |
Model Period Mean (intersection) [watt/m2] |
Benchmark Period Mean (intersection) [watt/m2] |
Model Period Mean (complement) [watt/m2] |
Benchmark Period Mean (complement) [watt/m2] |
Bias [watt/m2] |
RMSE [watt/m2] |
Phase Shift [months] |
Bias Score [1] |
RMSE Score [1] |
Seasonal Cycle Score [1] |
Spatial Distribution Score [1] |
Overall Score [1] |
|||
|---|---|---|---|---|---|---|---|---|---|---|---|---|---|---|---|---|
| Benchmark | [-] | 50.9 | ||||||||||||||
| h0 | [-] | 40.0 | 44.7 | 50.9 | 37.8 | 41.8 | -5.34 | 17.7 | 0.693 | 0.307 | 0.611 | 0.932 | 0.969 | 0.686 | ||
| h0a | [-] | 40.0 | 44.7 | 50.9 | 37.8 | 41.8 | -5.34 | 17.7 | 0.693 | 0.307 | 0.611 | 0.932 | 0.969 | 0.686 |
Download Data |
Period Mean (original grids) [watt/m2] |
Model Period Mean (intersection) [watt/m2] |
Benchmark Period Mean (intersection) [watt/m2] |
Model Period Mean (complement) [watt/m2] |
Benchmark Period Mean (complement) [watt/m2] |
Bias [watt/m2] |
RMSE [watt/m2] |
Phase Shift [months] |
Bias Score [1] |
RMSE Score [1] |
Seasonal Cycle Score [1] |
Spatial Distribution Score [1] |
Overall Score [1] |
|||
|---|---|---|---|---|---|---|---|---|---|---|---|---|---|---|---|---|
| Benchmark | [-] | 22.7 | ||||||||||||||
| h0 | [-] | 7.67 | 8.68 | 22.7 | 0.963 | 16.9 | -14.3 | 24.2 | 1.03 | 0.182 | 0.231 | 0.900 | 0.911 | 0.491 | ||
| h0a | [-] | 7.67 | 8.68 | 22.7 | 0.963 | 16.9 | -14.3 | 24.2 | 1.03 | 0.182 | 0.231 | 0.900 | 0.911 | 0.491 |
Download Data |
Period Mean (original grids) [watt/m2] |
Model Period Mean (intersection) [watt/m2] |
Benchmark Period Mean (intersection) [watt/m2] |
Model Period Mean (complement) [watt/m2] |
Benchmark Period Mean (complement) [watt/m2] |
Bias [watt/m2] |
RMSE [watt/m2] |
Phase Shift [months] |
Bias Score [1] |
RMSE Score [1] |
Seasonal Cycle Score [1] |
Spatial Distribution Score [1] |
Overall Score [1] |
|||
|---|---|---|---|---|---|---|---|---|---|---|---|---|---|---|---|---|
| Benchmark | [-] | 53.7 | ||||||||||||||
| h0 | [-] | 49.0 | 49.3 | 53.7 | 48.0 | 43.0 | -4.54 | 17.0 | 0.644 | 0.430 | 0.582 | 0.930 | 0.851 | 0.675 | ||
| h0a | [-] | 49.0 | 49.3 | 53.7 | 48.0 | 43.0 | -4.54 | 17.0 | 0.644 | 0.430 | 0.582 | 0.930 | 0.851 | 0.675 |
Download Data |
Period Mean (original grids) [watt/m2] |
Model Period Mean (intersection) [watt/m2] |
Benchmark Period Mean (intersection) [watt/m2] |
Model Period Mean (complement) [watt/m2] |
Benchmark Period Mean (complement) [watt/m2] |
Bias [watt/m2] |
RMSE [watt/m2] |
Phase Shift [months] |
Bias Score [1] |
RMSE Score [1] |
Seasonal Cycle Score [1] |
Spatial Distribution Score [1] |
Overall Score [1] |
|||
|---|---|---|---|---|---|---|---|---|---|---|---|---|---|---|---|---|
| Benchmark | [-] | 29.4 | ||||||||||||||
| h0 | [-] | 31.1 | 30.9 | 29.4 | 31.2 | 36.8 | 1.63 | 11.8 | 1.05 | 0.631 | 0.543 | 0.863 | 0.987 | 0.713 | ||
| h0a | [-] | 31.1 | 30.9 | 29.4 | 31.2 | 36.8 | 1.63 | 11.8 | 1.05 | 0.631 | 0.543 | 0.863 | 0.987 | 0.713 |
Download Data |
Period Mean (original grids) [watt/m2] |
Model Period Mean (intersection) [watt/m2] |
Benchmark Period Mean (intersection) [watt/m2] |
Model Period Mean (complement) [watt/m2] |
Benchmark Period Mean (complement) [watt/m2] |
Bias [watt/m2] |
RMSE [watt/m2] |
Phase Shift [months] |
Bias Score [1] |
RMSE Score [1] |
Seasonal Cycle Score [1] |
Spatial Distribution Score [1] |
Overall Score [1] |
|||
|---|---|---|---|---|---|---|---|---|---|---|---|---|---|---|---|---|
| Benchmark | [-] | 31.9 | ||||||||||||||
| h0 | [-] | 24.3 | 24.3 | 31.9 | 24.4 | 28.4 | -7.53 | 18.0 | 0.956 | 0.445 | 0.330 | 0.906 | 0.898 | 0.582 | ||
| h0a | [-] | 24.3 | 24.3 | 31.9 | 24.4 | 28.4 | -7.53 | 18.0 | 0.956 | 0.445 | 0.330 | 0.906 | 0.898 | 0.582 |
Download Data |
Period Mean (original grids) [watt/m2] |
Model Period Mean (intersection) [watt/m2] |
Benchmark Period Mean (intersection) [watt/m2] |
Model Period Mean (complement) [watt/m2] |
Benchmark Period Mean (complement) [watt/m2] |
Bias [watt/m2] |
RMSE [watt/m2] |
Phase Shift [months] |
Bias Score [1] |
RMSE Score [1] |
Seasonal Cycle Score [1] |
Spatial Distribution Score [1] |
Overall Score [1] |
|||
|---|---|---|---|---|---|---|---|---|---|---|---|---|---|---|---|---|
| Benchmark | [-] | 46.8 | ||||||||||||||
| h0 | [-] | 49.9 | 49.7 | 46.8 | 56.7 | 49.2 | 3.05 | 12.3 | 0.747 | 0.463 | 0.582 | 0.926 | 0.990 | 0.709 | ||
| h0a | [-] | 49.9 | 49.7 | 46.8 | 56.7 | 49.2 | 3.05 | 12.3 | 0.747 | 0.463 | 0.582 | 0.926 | 0.990 | 0.709 |
Download Data |
Period Mean (original grids) [watt/m2] |
Model Period Mean (intersection) [watt/m2] |
Benchmark Period Mean (intersection) [watt/m2] |
Model Period Mean (complement) [watt/m2] |
Benchmark Period Mean (complement) [watt/m2] |
Bias [watt/m2] |
RMSE [watt/m2] |
Phase Shift [months] |
Bias Score [1] |
RMSE Score [1] |
Seasonal Cycle Score [1] |
Spatial Distribution Score [1] |
Overall Score [1] |
|||
|---|---|---|---|---|---|---|---|---|---|---|---|---|---|---|---|---|
| Benchmark | [-] | 35.7 | ||||||||||||||
| h0 | [-] | 24.9 | 24.6 | 35.7 | 40.0 | 49.2 | -10.6 | 16.4 | 1.60 | 0.378 | 0.736 | 0.789 | 0.500 | 0.628 | ||
| h0a | [-] | 24.9 | 24.6 | 35.7 | 40.0 | 49.2 | -10.6 | 16.4 | 1.60 | 0.378 | 0.736 | 0.789 | 0.500 | 0.628 |
Download Data |
Period Mean (original grids) [watt/m2] |
Model Period Mean (intersection) [watt/m2] |
Benchmark Period Mean (intersection) [watt/m2] |
Model Period Mean (complement) [watt/m2] |
Benchmark Period Mean (complement) [watt/m2] |
Bias [watt/m2] |
RMSE [watt/m2] |
Phase Shift [months] |
Bias Score [1] |
RMSE Score [1] |
Seasonal Cycle Score [1] |
Spatial Distribution Score [1] |
Overall Score [1] |
|||
|---|---|---|---|---|---|---|---|---|---|---|---|---|---|---|---|---|
| Benchmark | [-] | 44.7 | ||||||||||||||
| h0 | [-] | 47.0 | 47.2 | 44.7 | 43.7 | 33.5 | 2.35 | 15.9 | 0.984 | 0.484 | 0.583 | 0.896 | 0.782 | 0.665 | ||
| h0a | [-] | 47.0 | 47.2 | 44.7 | 43.7 | 33.5 | 2.35 | 15.9 | 0.984 | 0.484 | 0.583 | 0.896 | 0.782 | 0.665 |
Download Data |
Period Mean (original grids) [watt/m2] |
Model Period Mean (intersection) [watt/m2] |
Benchmark Period Mean (intersection) [watt/m2] |
Model Period Mean (complement) [watt/m2] |
Benchmark Period Mean (complement) [watt/m2] |
Bias [watt/m2] |
RMSE [watt/m2] |
Phase Shift [months] |
Bias Score [1] |
RMSE Score [1] |
Seasonal Cycle Score [1] |
Spatial Distribution Score [1] |
Overall Score [1] |
|||
|---|---|---|---|---|---|---|---|---|---|---|---|---|---|---|---|---|
| Benchmark | [-] | 55.6 | ||||||||||||||
| h0 | [-] | 56.3 | 53.7 | 55.7 | 72.1 | 40.5 | -2.82 | 19.6 | 0.807 | 0.342 | 0.517 | 0.915 | 0.761 | 0.610 | ||
| h0a | [-] | 56.3 | 53.7 | 55.7 | 72.1 | 40.5 | -2.82 | 19.6 | 0.807 | 0.342 | 0.517 | 0.915 | 0.761 | 0.610 |
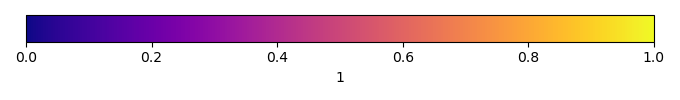
Temporally integrated period mean