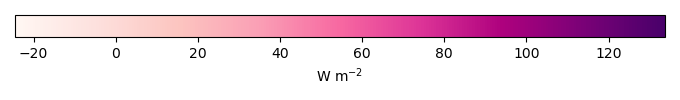
Mean State
Download Data |
Period Mean (original grids) [W m-2] |
Model Period Mean (intersection) [W m-2] |
Benchmark Period Mean (intersection) [W m-2] |
Model Period Mean (complement) [W m-2] |
Benchmark Period Mean (complement) [W m-2] |
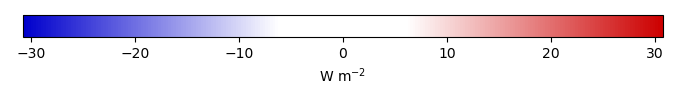
Bias [W m-2] |
RMSE [W m-2] |
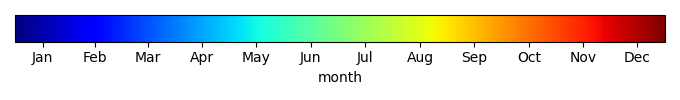
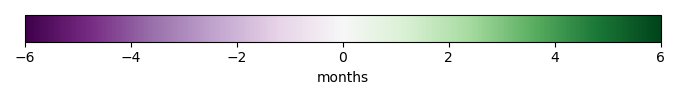
Phase Shift [months] |
Bias Score [1] |
RMSE Score [1] |
Seasonal Cycle Score [1] |
Spatial Distribution Score [1] |
Overall Score [1] |
|||
|---|---|---|---|---|---|---|---|---|---|---|---|---|---|---|---|---|
| Benchmark | [-] | 108. | ||||||||||||||
| h0 | [-] | 108. | 109. | 108. | 108. | 66.8 | 0.381 | 13.0 | 2.07 | 0.660 | 0.590 | 0.665 | 0.993 | 0.700 | ||
| h0a | [-] | 108. | 109. | 108. | 108. | 66.8 | 0.381 | 13.0 | 2.07 | 0.660 | 0.590 | 0.665 | 0.993 | 0.700 |
Download Data |
Period Mean (original grids) [W m-2] |
Model Period Mean (intersection) [W m-2] |
Benchmark Period Mean (intersection) [W m-2] |
Model Period Mean (complement) [W m-2] |
Benchmark Period Mean (complement) [W m-2] |
Bias [W m-2] |
RMSE [W m-2] |
Phase Shift [months] |
Bias Score [1] |
RMSE Score [1] |
Seasonal Cycle Score [1] |
Spatial Distribution Score [1] |
Overall Score [1] |
|||
|---|---|---|---|---|---|---|---|---|---|---|---|---|---|---|---|---|
| Benchmark | [-] | 98.5 | ||||||||||||||
| h0 | [-] | 101. | 100. | 98.5 | 105. | 1.58 | 15.2 | 1.68 | 0.655 | 0.481 | 0.749 | 0.993 | 0.672 | |||
| h0a | [-] | 101. | 100. | 98.5 | 105. | 1.58 | 15.2 | 1.68 | 0.655 | 0.481 | 0.749 | 0.993 | 0.672 |
Download Data |
Period Mean (original grids) [W m-2] |
Model Period Mean (intersection) [W m-2] |
Benchmark Period Mean (intersection) [W m-2] |
Model Period Mean (complement) [W m-2] |
Benchmark Period Mean (complement) [W m-2] |
Bias [W m-2] |
RMSE [W m-2] |
Phase Shift [months] |
Bias Score [1] |
RMSE Score [1] |
Seasonal Cycle Score [1] |
Spatial Distribution Score [1] |
Overall Score [1] |
|||
|---|---|---|---|---|---|---|---|---|---|---|---|---|---|---|---|---|
| Benchmark | [-] | 105. | ||||||||||||||
| h0 | [-] | 106. | 105. | 105. | 114. | 89.0 | -0.460 | 11.6 | 1.45 | 0.594 | 0.674 | 0.788 | 0.975 | 0.741 | ||
| h0a | [-] | 106. | 105. | 105. | 114. | 89.0 | -0.460 | 11.6 | 1.45 | 0.594 | 0.674 | 0.788 | 0.975 | 0.741 |
Download Data |
Period Mean (original grids) [W m-2] |
Model Period Mean (intersection) [W m-2] |
Benchmark Period Mean (intersection) [W m-2] |
Model Period Mean (complement) [W m-2] |
Benchmark Period Mean (complement) [W m-2] |
Bias [W m-2] |
RMSE [W m-2] |
Phase Shift [months] |
Bias Score [1] |
RMSE Score [1] |
Seasonal Cycle Score [1] |
Spatial Distribution Score [1] |
Overall Score [1] |
|||
|---|---|---|---|---|---|---|---|---|---|---|---|---|---|---|---|---|
| Benchmark | [-] | 20.1 | ||||||||||||||
| h0 | [-] | 30.5 | 32.1 | 20.1 | 22.6 | 28.4 | 12.0 | 22.8 | 0.465 | 0.366 | 0.239 | 0.969 | 0.873 | 0.537 | ||
| h0a | [-] | 30.5 | 32.1 | 20.1 | 22.6 | 28.4 | 12.0 | 22.8 | 0.465 | 0.366 | 0.239 | 0.969 | 0.873 | 0.537 |
Download Data |
Period Mean (original grids) [W m-2] |
Model Period Mean (intersection) [W m-2] |
Benchmark Period Mean (intersection) [W m-2] |
Model Period Mean (complement) [W m-2] |
Benchmark Period Mean (complement) [W m-2] |
Bias [W m-2] |
RMSE [W m-2] |
Phase Shift [months] |
Bias Score [1] |
RMSE Score [1] |
Seasonal Cycle Score [1] |
Spatial Distribution Score [1] |
Overall Score [1] |
|||
|---|---|---|---|---|---|---|---|---|---|---|---|---|---|---|---|---|
| Benchmark | [-] | 112. | ||||||||||||||
| h0 | [-] | 122. | 118. | 112. | 128. | 121. | 6.86 | 14.0 | 2.42 | 0.597 | 0.698 | 0.616 | 0.996 | 0.721 | ||
| h0a | [-] | 122. | 118. | 112. | 128. | 121. | 6.86 | 14.0 | 2.42 | 0.597 | 0.698 | 0.616 | 0.996 | 0.721 |
Download Data |
Period Mean (original grids) [W m-2] |
Model Period Mean (intersection) [W m-2] |
Benchmark Period Mean (intersection) [W m-2] |
Model Period Mean (complement) [W m-2] |
Benchmark Period Mean (complement) [W m-2] |
Bias [W m-2] |
RMSE [W m-2] |
Phase Shift [months] |
Bias Score [1] |
RMSE Score [1] |
Seasonal Cycle Score [1] |
Spatial Distribution Score [1] |
Overall Score [1] |
|||
|---|---|---|---|---|---|---|---|---|---|---|---|---|---|---|---|---|
| Benchmark | [-] | 37.0 | ||||||||||||||
| h0 | [-] | 50.8 | 50.8 | 37.0 | 49.3 | 48.1 | 13.9 | 20.5 | 0.402 | 0.236 | 0.398 | 0.973 | 0.885 | 0.578 | ||
| h0a | [-] | 50.8 | 50.8 | 37.0 | 49.3 | 48.1 | 13.9 | 20.5 | 0.402 | 0.236 | 0.398 | 0.973 | 0.885 | 0.578 |
Download Data |
Period Mean (original grids) [W m-2] |
Model Period Mean (intersection) [W m-2] |
Benchmark Period Mean (intersection) [W m-2] |
Model Period Mean (complement) [W m-2] |
Benchmark Period Mean (complement) [W m-2] |
Bias [W m-2] |
RMSE [W m-2] |
Phase Shift [months] |
Bias Score [1] |
RMSE Score [1] |
Seasonal Cycle Score [1] |
Spatial Distribution Score [1] |
Overall Score [1] |
|||
|---|---|---|---|---|---|---|---|---|---|---|---|---|---|---|---|---|
| Benchmark | [-] | 54.8 | ||||||||||||||
| h0 | [-] | 62.1 | 61.1 | 54.8 | 73.0 | 56.6 | 6.55 | 16.7 | 0.538 | 0.371 | 0.509 | 0.955 | 0.981 | 0.665 | ||
| h0a | [-] | 62.1 | 61.1 | 54.8 | 73.0 | 56.6 | 6.55 | 16.7 | 0.538 | 0.371 | 0.509 | 0.955 | 0.981 | 0.665 |
Download Data |
Period Mean (original grids) [W m-2] |
Model Period Mean (intersection) [W m-2] |
Benchmark Period Mean (intersection) [W m-2] |
Model Period Mean (complement) [W m-2] |
Benchmark Period Mean (complement) [W m-2] |
Bias [W m-2] |
RMSE [W m-2] |
Phase Shift [months] |
Bias Score [1] |
RMSE Score [1] |
Seasonal Cycle Score [1] |
Spatial Distribution Score [1] |
Overall Score [1] |
|||
|---|---|---|---|---|---|---|---|---|---|---|---|---|---|---|---|---|
| Benchmark | [-] | 90.0 | ||||||||||||||
| h0 | [-] | 89.3 | 85.5 | 90.0 | 111. | -4.09 | 17.2 | 1.71 | 0.512 | 0.481 | 0.747 | 0.934 | 0.631 | |||
| h0a | [-] | 89.3 | 85.5 | 90.0 | 111. | -4.09 | 17.2 | 1.71 | 0.512 | 0.481 | 0.747 | 0.934 | 0.631 |
Download Data |
Period Mean (original grids) [W m-2] |
Model Period Mean (intersection) [W m-2] |
Benchmark Period Mean (intersection) [W m-2] |
Model Period Mean (complement) [W m-2] |
Benchmark Period Mean (complement) [W m-2] |
Bias [W m-2] |
RMSE [W m-2] |
Phase Shift [months] |
Bias Score [1] |
RMSE Score [1] |
Seasonal Cycle Score [1] |
Spatial Distribution Score [1] |
Overall Score [1] |
|||
|---|---|---|---|---|---|---|---|---|---|---|---|---|---|---|---|---|
| Benchmark | [-] | 18.4 | ||||||||||||||
| h0 | [-] | 25.9 | 27.8 | 18.4 | 17.7 | 9.36 | 19.5 | 0.349 | 0.460 | 0.306 | 0.977 | 0.942 | 0.598 | |||
| h0a | [-] | 25.9 | 27.8 | 18.4 | 17.7 | 9.36 | 19.5 | 0.349 | 0.460 | 0.306 | 0.977 | 0.942 | 0.598 |
Download Data |
Period Mean (original grids) [W m-2] |
Model Period Mean (intersection) [W m-2] |
Benchmark Period Mean (intersection) [W m-2] |
Model Period Mean (complement) [W m-2] |
Benchmark Period Mean (complement) [W m-2] |
Bias [W m-2] |
RMSE [W m-2] |
Phase Shift [months] |
Bias Score [1] |
RMSE Score [1] |
Seasonal Cycle Score [1] |
Spatial Distribution Score [1] |
Overall Score [1] |
|||
|---|---|---|---|---|---|---|---|---|---|---|---|---|---|---|---|---|
| Benchmark | [-] | 91.7 | ||||||||||||||
| h0 | [-] | 92.5 | 91.7 | 91.7 | 99.5 | 90.8 | 0.282 | 10.2 | 0.751 | 0.728 | 0.673 | 0.934 | 0.993 | 0.800 | ||
| h0a | [-] | 92.5 | 91.7 | 91.7 | 99.5 | 90.8 | 0.282 | 10.2 | 0.751 | 0.728 | 0.673 | 0.934 | 0.993 | 0.800 |
Download Data |
Period Mean (original grids) [W m-2] |
Model Period Mean (intersection) [W m-2] |
Benchmark Period Mean (intersection) [W m-2] |
Model Period Mean (complement) [W m-2] |
Benchmark Period Mean (complement) [W m-2] |
Bias [W m-2] |
RMSE [W m-2] |
Phase Shift [months] |
Bias Score [1] |
RMSE Score [1] |
Seasonal Cycle Score [1] |
Spatial Distribution Score [1] |
Overall Score [1] |
|||
|---|---|---|---|---|---|---|---|---|---|---|---|---|---|---|---|---|
| Benchmark | [-] | 44.4 | ||||||||||||||
| h0 | [-] | 54.4 | 54.4 | 44.4 | 54.4 | 55.1 | 10.4 | 16.7 | 0.420 | 0.398 | 0.456 | 0.972 | 0.971 | 0.650 | ||
| h0a | [-] | 54.4 | 54.4 | 44.4 | 54.4 | 55.1 | 10.4 | 16.7 | 0.420 | 0.398 | 0.456 | 0.972 | 0.971 | 0.650 |
Download Data |
Period Mean (original grids) [W m-2] |
Model Period Mean (intersection) [W m-2] |
Benchmark Period Mean (intersection) [W m-2] |
Model Period Mean (complement) [W m-2] |
Benchmark Period Mean (complement) [W m-2] |
Bias [W m-2] |
RMSE [W m-2] |
Phase Shift [months] |
Bias Score [1] |
RMSE Score [1] |
Seasonal Cycle Score [1] |
Spatial Distribution Score [1] |
Overall Score [1] |
|||
|---|---|---|---|---|---|---|---|---|---|---|---|---|---|---|---|---|
| Benchmark | [-] | 72.3 | ||||||||||||||
| h0 | [-] | 65.4 | 75.1 | 72.3 | 26.9 | 74.8 | 3.09 | 16.6 | 0.999 | 0.475 | 0.519 | 0.872 | 0.987 | 0.674 | ||
| h0a | [-] | 65.4 | 75.1 | 72.3 | 26.9 | 74.8 | 3.09 | 16.6 | 0.999 | 0.475 | 0.519 | 0.872 | 0.987 | 0.674 |
Download Data |
Period Mean (original grids) [W m-2] |
Model Period Mean (intersection) [W m-2] |
Benchmark Period Mean (intersection) [W m-2] |
Model Period Mean (complement) [W m-2] |
Benchmark Period Mean (complement) [W m-2] |
Bias [W m-2] |
RMSE [W m-2] |
Phase Shift [months] |
Bias Score [1] |
RMSE Score [1] |
Seasonal Cycle Score [1] |
Spatial Distribution Score [1] |
Overall Score [1] |
|||
|---|---|---|---|---|---|---|---|---|---|---|---|---|---|---|---|---|
| Benchmark | [-] | 57.6 | ||||||||||||||
| h0 | [-] | 50.1 | 49.0 | 57.6 | 72.5 | 57.9 | -8.15 | 18.2 | 1.12 | 0.376 | 0.652 | 0.859 | 0.776 | 0.663 | ||
| h0a | [-] | 50.1 | 49.0 | 57.6 | 72.5 | 57.9 | -8.15 | 18.2 | 1.12 | 0.376 | 0.652 | 0.859 | 0.776 | 0.663 |
Download Data |
Period Mean (original grids) [W m-2] |
Model Period Mean (intersection) [W m-2] |
Benchmark Period Mean (intersection) [W m-2] |
Model Period Mean (complement) [W m-2] |
Benchmark Period Mean (complement) [W m-2] |
Bias [W m-2] |
RMSE [W m-2] |
Phase Shift [months] |
Bias Score [1] |
RMSE Score [1] |
Seasonal Cycle Score [1] |
Spatial Distribution Score [1] |
Overall Score [1] |
|||
|---|---|---|---|---|---|---|---|---|---|---|---|---|---|---|---|---|
| Benchmark | [-] | 23.5 | ||||||||||||||
| h0 | [-] | 26.6 | 29.1 | 23.5 | 20.3 | 5.37 | 22.1 | 0.253 | 0.579 | 0.171 | 0.982 | 0.883 | 0.557 | |||
| h0a | [-] | 26.6 | 29.1 | 23.5 | 20.3 | 5.37 | 22.1 | 0.253 | 0.579 | 0.171 | 0.982 | 0.883 | 0.557 |
Download Data |
Period Mean (original grids) [W m-2] |
Model Period Mean (intersection) [W m-2] |
Benchmark Period Mean (intersection) [W m-2] |
Model Period Mean (complement) [W m-2] |
Benchmark Period Mean (complement) [W m-2] |
Bias [W m-2] |
RMSE [W m-2] |
Phase Shift [months] |
Bias Score [1] |
RMSE Score [1] |
Seasonal Cycle Score [1] |
Spatial Distribution Score [1] |
Overall Score [1] |
|||
|---|---|---|---|---|---|---|---|---|---|---|---|---|---|---|---|---|
| Benchmark | [-] | 98.2 | ||||||||||||||
| h0 | [-] | 109. | 104. | 98.2 | 123. | 80.4 | 6.67 | 16.3 | 1.21 | 0.517 | 0.562 | 0.853 | 0.883 | 0.675 | ||
| h0a | [-] | 109. | 104. | 98.2 | 123. | 80.4 | 6.67 | 16.3 | 1.21 | 0.517 | 0.562 | 0.853 | 0.883 | 0.675 |
Download Data |
Period Mean (original grids) [W m-2] |
Model Period Mean (intersection) [W m-2] |
Benchmark Period Mean (intersection) [W m-2] |
Model Period Mean (complement) [W m-2] |
Benchmark Period Mean (complement) [W m-2] |
Bias [W m-2] |
RMSE [W m-2] |
Phase Shift [months] |
Bias Score [1] |
RMSE Score [1] |
Seasonal Cycle Score [1] |
Spatial Distribution Score [1] |
Overall Score [1] |
|||
|---|---|---|---|---|---|---|---|---|---|---|---|---|---|---|---|---|
| Benchmark | [-] | 75.4 | ||||||||||||||
| h0 | [-] | 84.0 | 83.8 | 75.4 | 85.7 | 8.86 | 14.6 | 0.596 | 0.419 | 0.534 | 0.959 | 0.996 | 0.688 | |||
| h0a | [-] | 84.0 | 83.8 | 75.4 | 85.7 | 8.86 | 14.6 | 0.596 | 0.419 | 0.534 | 0.959 | 0.996 | 0.688 |
Download Data |
Period Mean (original grids) [W m-2] |
Model Period Mean (intersection) [W m-2] |
Benchmark Period Mean (intersection) [W m-2] |
Model Period Mean (complement) [W m-2] |
Benchmark Period Mean (complement) [W m-2] |
Bias [W m-2] |
RMSE [W m-2] |
Phase Shift [months] |
Bias Score [1] |
RMSE Score [1] |
Seasonal Cycle Score [1] |
Spatial Distribution Score [1] |
Overall Score [1] |
|||
|---|---|---|---|---|---|---|---|---|---|---|---|---|---|---|---|---|
| Benchmark | [-] | 44.3 | ||||||||||||||
| h0 | [-] | 57.9 | 57.9 | 44.3 | 58.8 | 13.5 | 19.8 | 0.299 | 0.211 | 0.416 | 0.980 | 0.953 | 0.595 | |||
| h0a | [-] | 57.9 | 57.9 | 44.3 | 58.8 | 13.5 | 19.8 | 0.299 | 0.211 | 0.416 | 0.980 | 0.953 | 0.595 |
Download Data |
Period Mean (original grids) [W m-2] |
Model Period Mean (intersection) [W m-2] |
Benchmark Period Mean (intersection) [W m-2] |
Model Period Mean (complement) [W m-2] |
Benchmark Period Mean (complement) [W m-2] |
Bias [W m-2] |
RMSE [W m-2] |
Phase Shift [months] |
Bias Score [1] |
RMSE Score [1] |
Seasonal Cycle Score [1] |
Spatial Distribution Score [1] |
Overall Score [1] |
|||
|---|---|---|---|---|---|---|---|---|---|---|---|---|---|---|---|---|
| Benchmark | [-] | 66.6 | ||||||||||||||
| h0 | [-] | 77.1 | 77.2 | 66.6 | 83.7 | 66.6 | 10.6 | 16.6 | 0.507 | 0.362 | 0.538 | 0.959 | 0.957 | 0.671 | ||
| h0a | [-] | 77.1 | 77.2 | 66.6 | 83.7 | 66.6 | 10.6 | 16.6 | 0.507 | 0.362 | 0.538 | 0.959 | 0.957 | 0.671 |
Download Data |
Period Mean (original grids) [W m-2] |
Model Period Mean (intersection) [W m-2] |
Benchmark Period Mean (intersection) [W m-2] |
Model Period Mean (complement) [W m-2] |
Benchmark Period Mean (complement) [W m-2] |
Bias [W m-2] |
RMSE [W m-2] |
Phase Shift [months] |
Bias Score [1] |
RMSE Score [1] |
Seasonal Cycle Score [1] |
Spatial Distribution Score [1] |
Overall Score [1] |
|||
|---|---|---|---|---|---|---|---|---|---|---|---|---|---|---|---|---|
| Benchmark | [-] | 116. | ||||||||||||||
| h0 | [-] | 116. | 116. | 116. | 126. | 114. | 0.0108 | 16.9 | 1.63 | 0.626 | 0.507 | 0.756 | 0.982 | 0.676 | ||
| h0a | [-] | 116. | 116. | 116. | 126. | 114. | 0.0108 | 16.9 | 1.63 | 0.626 | 0.507 | 0.756 | 0.982 | 0.676 |
Download Data |
Period Mean (original grids) [W m-2] |
Model Period Mean (intersection) [W m-2] |
Benchmark Period Mean (intersection) [W m-2] |
Model Period Mean (complement) [W m-2] |
Benchmark Period Mean (complement) [W m-2] |
Bias [W m-2] |
RMSE [W m-2] |
Phase Shift [months] |
Bias Score [1] |
RMSE Score [1] |
Seasonal Cycle Score [1] |
Spatial Distribution Score [1] |
Overall Score [1] |
|||
|---|---|---|---|---|---|---|---|---|---|---|---|---|---|---|---|---|
| Benchmark | [-] | 111. | ||||||||||||||
| h0 | [-] | 110. | 110. | 111. | 109. | 121. | -1.75 | 14.9 | 1.64 | 0.623 | 0.495 | 0.765 | 0.987 | 0.673 | ||
| h0a | [-] | 110. | 110. | 111. | 109. | 121. | -1.75 | 14.9 | 1.64 | 0.623 | 0.495 | 0.765 | 0.987 | 0.673 |
Download Data |
Period Mean (original grids) [W m-2] |
Model Period Mean (intersection) [W m-2] |
Benchmark Period Mean (intersection) [W m-2] |
Model Period Mean (complement) [W m-2] |
Benchmark Period Mean (complement) [W m-2] |
Bias [W m-2] |
RMSE [W m-2] |
Phase Shift [months] |
Bias Score [1] |
RMSE Score [1] |
Seasonal Cycle Score [1] |
Spatial Distribution Score [1] |
Overall Score [1] |
|||
|---|---|---|---|---|---|---|---|---|---|---|---|---|---|---|---|---|
| Benchmark | [-] | 80.4 | ||||||||||||||
| h0 | [-] | 84.4 | 86.3 | 80.4 | 69.0 | 54.2 | 5.52 | 17.5 | 0.682 | 0.434 | 0.557 | 0.931 | 0.934 | 0.683 | ||
| h0a | [-] | 84.4 | 86.3 | 80.4 | 69.0 | 54.2 | 5.52 | 17.5 | 0.682 | 0.434 | 0.557 | 0.931 | 0.934 | 0.683 |
Temporally integrated period mean