Mean State
Download Data |
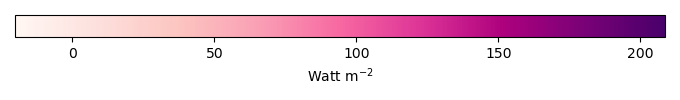
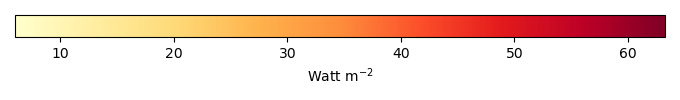
Period Mean (original grids) [Watt m-2] |
Model Period Mean (intersection) [Watt m-2] |
Benchmark Period Mean (intersection) [Watt m-2] |
Model Period Mean (complement) [Watt m-2] |
Benchmark Period Mean (complement) [Watt m-2] |
Bias [Watt m-2] |
RMSE [Watt m-2] |
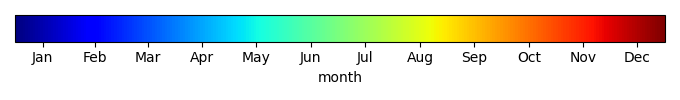
Phase Shift [months] |
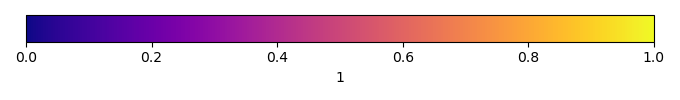
Bias Score [1] |
RMSE Score [1] |
Seasonal Cycle Score [1] |
Spatial Distribution Score [1] |
Overall Score [1] |
|||
|---|---|---|---|---|---|---|---|---|---|---|---|---|---|---|---|---|
| Benchmark | [-] | 120. | ||||||||||||||
| h0 | [-] | 108. | 109. | 118. | 166. | -9.15 | 16.7 | 1.32 | 0.402 | 0.707 | 0.831 | 0.821 | 0.694 | |||
| h0a | [-] | 108. | 109. | 118. | 166. | -9.15 | 16.7 | 1.32 | 0.402 | 0.707 | 0.831 | 0.821 | 0.694 |
Download Data |
Period Mean (original grids) [Watt m-2] |
Model Period Mean (intersection) [Watt m-2] |
Benchmark Period Mean (intersection) [Watt m-2] |
Model Period Mean (complement) [Watt m-2] |
Benchmark Period Mean (complement) [Watt m-2] |
Bias [Watt m-2] |
RMSE [Watt m-2] |
Phase Shift [months] |
Bias Score [1] |
RMSE Score [1] |
Seasonal Cycle Score [1] |
Spatial Distribution Score [1] |
Overall Score [1] |
|||
|---|---|---|---|---|---|---|---|---|---|---|---|---|---|---|---|---|
| Benchmark | [-] | 100. | ||||||||||||||
| h0 | [-] | 101. | 100. | 99.9 | 163. | 1.13 | 16.6 | 1.51 | 0.470 | 0.580 | 0.767 | 0.840 | 0.647 | |||
| h0a | [-] | 101. | 100. | 99.9 | 163. | 1.13 | 16.6 | 1.51 | 0.470 | 0.580 | 0.767 | 0.840 | 0.647 |
Download Data |
Period Mean (original grids) [Watt m-2] |
Model Period Mean (intersection) [Watt m-2] |
Benchmark Period Mean (intersection) [Watt m-2] |
Model Period Mean (complement) [Watt m-2] |
Benchmark Period Mean (complement) [Watt m-2] |
Bias [Watt m-2] |
RMSE [Watt m-2] |
Phase Shift [months] |
Bias Score [1] |
RMSE Score [1] |
Seasonal Cycle Score [1] |
Spatial Distribution Score [1] |
Overall Score [1] |
|||
|---|---|---|---|---|---|---|---|---|---|---|---|---|---|---|---|---|
| Benchmark | [-] | 110. | ||||||||||||||
| h0 | [-] | 105. | 105. | 107. | 161. | -0.528 | 17.1 | 1.28 | 0.512 | 0.636 | 0.818 | 0.752 | 0.671 | |||
| h0a | [-] | 105. | 105. | 107. | 161. | -0.528 | 17.1 | 1.28 | 0.512 | 0.636 | 0.818 | 0.752 | 0.671 |
Download Data |
Period Mean (original grids) [Watt m-2] |
Model Period Mean (intersection) [Watt m-2] |
Benchmark Period Mean (intersection) [Watt m-2] |
Model Period Mean (complement) [Watt m-2] |
Benchmark Period Mean (complement) [Watt m-2] |
Bias [Watt m-2] |
RMSE [Watt m-2] |
Phase Shift [months] |
Bias Score [1] |
RMSE Score [1] |
Seasonal Cycle Score [1] |
Spatial Distribution Score [1] |
Overall Score [1] |
|||
|---|---|---|---|---|---|---|---|---|---|---|---|---|---|---|---|---|
| Benchmark | [-] | 42.3 | ||||||||||||||
| h0 | [-] | 29.8 | 29.9 | 42.2 | 43.3 | -13.5 | 23.5 | 0.344 | 0.333 | 0.218 | 0.977 | 0.842 | 0.517 | |||
| h0a | [-] | 29.8 | 29.9 | 42.2 | 43.3 | -13.5 | 23.5 | 0.344 | 0.333 | 0.218 | 0.977 | 0.842 | 0.517 |
Download Data |
Period Mean (original grids) [Watt m-2] |
Model Period Mean (intersection) [Watt m-2] |
Benchmark Period Mean (intersection) [Watt m-2] |
Model Period Mean (complement) [Watt m-2] |
Benchmark Period Mean (complement) [Watt m-2] |
Bias [Watt m-2] |
RMSE [Watt m-2] |
Phase Shift [months] |
Bias Score [1] |
RMSE Score [1] |
Seasonal Cycle Score [1] |
Spatial Distribution Score [1] |
Overall Score [1] |
|||
|---|---|---|---|---|---|---|---|---|---|---|---|---|---|---|---|---|
| Benchmark | [-] | 140. | ||||||||||||||
| h0 | [-] | 123. | 123. | 136. | 159. | -8.10 | 15.2 | 0.992 | 0.559 | 0.776 | 0.862 | 0.842 | 0.763 | |||
| h0a | [-] | 123. | 123. | 136. | 159. | -8.10 | 15.2 | 0.992 | 0.559 | 0.776 | 0.862 | 0.842 | 0.763 |
Download Data |
Period Mean (original grids) [Watt m-2] |
Model Period Mean (intersection) [Watt m-2] |
Benchmark Period Mean (intersection) [Watt m-2] |
Model Period Mean (complement) [Watt m-2] |
Benchmark Period Mean (complement) [Watt m-2] |
Bias [Watt m-2] |
RMSE [Watt m-2] |
Phase Shift [months] |
Bias Score [1] |
RMSE Score [1] |
Seasonal Cycle Score [1] |
Spatial Distribution Score [1] |
Overall Score [1] |
|||
|---|---|---|---|---|---|---|---|---|---|---|---|---|---|---|---|---|
| Benchmark | [-] | 59.4 | ||||||||||||||
| h0 | [-] | 50.0 | 50.0 | 59.3 | 69.5 | -9.23 | 17.3 | 0.420 | 0.391 | 0.445 | 0.970 | 0.873 | 0.625 | |||
| h0a | [-] | 50.0 | 50.0 | 59.3 | 69.5 | -9.23 | 17.3 | 0.420 | 0.391 | 0.445 | 0.970 | 0.873 | 0.625 |
Download Data |
Period Mean (original grids) [Watt m-2] |
Model Period Mean (intersection) [Watt m-2] |
Benchmark Period Mean (intersection) [Watt m-2] |
Model Period Mean (complement) [Watt m-2] |
Benchmark Period Mean (complement) [Watt m-2] |
Bias [Watt m-2] |
RMSE [Watt m-2] |
Phase Shift [months] |
Bias Score [1] |
RMSE Score [1] |
Seasonal Cycle Score [1] |
Spatial Distribution Score [1] |
Overall Score [1] |
|||
|---|---|---|---|---|---|---|---|---|---|---|---|---|---|---|---|---|
| Benchmark | [-] | 66.5 | ||||||||||||||
| h0 | [-] | 61.7 | 61.7 | 65.8 | 104. | -3.17 | 16.2 | 0.637 | 0.561 | 0.449 | 0.942 | 0.978 | 0.676 | |||
| h0a | [-] | 61.7 | 61.7 | 65.8 | 104. | -3.17 | 16.2 | 0.637 | 0.561 | 0.449 | 0.942 | 0.978 | 0.676 |
Download Data |
Period Mean (original grids) [Watt m-2] |
Model Period Mean (intersection) [Watt m-2] |
Benchmark Period Mean (intersection) [Watt m-2] |
Model Period Mean (complement) [Watt m-2] |
Benchmark Period Mean (complement) [Watt m-2] |
Bias [Watt m-2] |
RMSE [Watt m-2] |
Phase Shift [months] |
Bias Score [1] |
RMSE Score [1] |
Seasonal Cycle Score [1] |
Spatial Distribution Score [1] |
Overall Score [1] |
|||
|---|---|---|---|---|---|---|---|---|---|---|---|---|---|---|---|---|
| Benchmark | [-] | 103. | ||||||||||||||
| h0 | [-] | 89.6 | 89.3 | 100. | 157. | -6.11 | 18.1 | 1.10 | 0.513 | 0.563 | 0.844 | 0.947 | 0.686 | |||
| h0a | [-] | 89.6 | 89.3 | 100. | 157. | -6.11 | 18.1 | 1.10 | 0.513 | 0.563 | 0.844 | 0.947 | 0.686 |
Download Data |
Period Mean (original grids) [Watt m-2] |
Model Period Mean (intersection) [Watt m-2] |
Benchmark Period Mean (intersection) [Watt m-2] |
Model Period Mean (complement) [Watt m-2] |
Benchmark Period Mean (complement) [Watt m-2] |
Bias [Watt m-2] |
RMSE [Watt m-2] |
Phase Shift [months] |
Bias Score [1] |
RMSE Score [1] |
Seasonal Cycle Score [1] |
Spatial Distribution Score [1] |
Overall Score [1] |
|||
|---|---|---|---|---|---|---|---|---|---|---|---|---|---|---|---|---|
| Benchmark | [-] | 41.3 | ||||||||||||||
| h0 | [-] | 24.5 | 24.9 | 41.4 | 41.0 | -17.8 | 21.9 | 0.439 | 0.148 | 0.310 | 0.971 | 0.940 | 0.536 | |||
| h0a | [-] | 24.5 | 24.9 | 41.4 | 41.0 | -17.8 | 21.9 | 0.439 | 0.148 | 0.310 | 0.971 | 0.940 | 0.536 |
Download Data |
Period Mean (original grids) [Watt m-2] |
Model Period Mean (intersection) [Watt m-2] |
Benchmark Period Mean (intersection) [Watt m-2] |
Model Period Mean (complement) [Watt m-2] |
Benchmark Period Mean (complement) [Watt m-2] |
Bias [Watt m-2] |
RMSE [Watt m-2] |
Phase Shift [months] |
Bias Score [1] |
RMSE Score [1] |
Seasonal Cycle Score [1] |
Spatial Distribution Score [1] |
Overall Score [1] |
|||
|---|---|---|---|---|---|---|---|---|---|---|---|---|---|---|---|---|
| Benchmark | [-] | 91.6 | ||||||||||||||
| h0 | [-] | 92.7 | 92.7 | 88.8 | 138. | 5.92 | 18.4 | 0.455 | 0.393 | 0.624 | 0.964 | 0.787 | 0.678 | |||
| h0a | [-] | 92.7 | 92.7 | 88.8 | 138. | 5.92 | 18.4 | 0.455 | 0.393 | 0.624 | 0.964 | 0.787 | 0.678 |
Download Data |
Period Mean (original grids) [Watt m-2] |
Model Period Mean (intersection) [Watt m-2] |
Benchmark Period Mean (intersection) [Watt m-2] |
Model Period Mean (complement) [Watt m-2] |
Benchmark Period Mean (complement) [Watt m-2] |
Bias [Watt m-2] |
RMSE [Watt m-2] |
Phase Shift [months] |
Bias Score [1] |
RMSE Score [1] |
Seasonal Cycle Score [1] |
Spatial Distribution Score [1] |
Overall Score [1] |
|||
|---|---|---|---|---|---|---|---|---|---|---|---|---|---|---|---|---|
| Benchmark | [-] | 64.5 | ||||||||||||||
| h0 | [-] | 54.2 | 54.2 | 62.8 | 91.5 | -6.89 | 16.2 | 0.401 | 0.457 | 0.504 | 0.971 | 0.985 | 0.684 | |||
| h0a | [-] | 54.2 | 54.2 | 62.8 | 91.5 | -6.89 | 16.2 | 0.401 | 0.457 | 0.504 | 0.971 | 0.985 | 0.684 |
Download Data |
Period Mean (original grids) [Watt m-2] |
Model Period Mean (intersection) [Watt m-2] |
Benchmark Period Mean (intersection) [Watt m-2] |
Model Period Mean (complement) [Watt m-2] |
Benchmark Period Mean (complement) [Watt m-2] |
Bias [Watt m-2] |
RMSE [Watt m-2] |
Phase Shift [months] |
Bias Score [1] |
RMSE Score [1] |
Seasonal Cycle Score [1] |
Spatial Distribution Score [1] |
Overall Score [1] |
|||
|---|---|---|---|---|---|---|---|---|---|---|---|---|---|---|---|---|
| Benchmark | [-] | 76.8 | ||||||||||||||
| h0 | [-] | 65.3 | 65.3 | 74.8 | 124. | -7.88 | 19.3 | 0.759 | 0.391 | 0.536 | 0.913 | 0.956 | 0.666 | |||
| h0a | [-] | 65.3 | 65.3 | 74.8 | 124. | -7.88 | 19.3 | 0.759 | 0.391 | 0.536 | 0.913 | 0.956 | 0.666 |
Download Data |
Period Mean (original grids) [Watt m-2] |
Model Period Mean (intersection) [Watt m-2] |
Benchmark Period Mean (intersection) [Watt m-2] |
Model Period Mean (complement) [Watt m-2] |
Benchmark Period Mean (complement) [Watt m-2] |
Bias [Watt m-2] |
RMSE [Watt m-2] |
Phase Shift [months] |
Bias Score [1] |
RMSE Score [1] |
Seasonal Cycle Score [1] |
Spatial Distribution Score [1] |
Overall Score [1] |
|||
|---|---|---|---|---|---|---|---|---|---|---|---|---|---|---|---|---|
| Benchmark | [-] | 50.3 | ||||||||||||||
| h0 | [-] | 49.9 | 50.0 | 47.3 | 139. | 5.12 | 22.7 | 0.976 | 0.427 | 0.477 | 0.883 | 0.780 | 0.609 | |||
| h0a | [-] | 49.9 | 50.0 | 47.3 | 139. | 5.12 | 22.7 | 0.976 | 0.427 | 0.477 | 0.883 | 0.780 | 0.609 |
Download Data |
Period Mean (original grids) [Watt m-2] |
Model Period Mean (intersection) [Watt m-2] |
Benchmark Period Mean (intersection) [Watt m-2] |
Model Period Mean (complement) [Watt m-2] |
Benchmark Period Mean (complement) [Watt m-2] |
Bias [Watt m-2] |
RMSE [Watt m-2] |
Phase Shift [months] |
Bias Score [1] |
RMSE Score [1] |
Seasonal Cycle Score [1] |
Spatial Distribution Score [1] |
Overall Score [1] |
|||
|---|---|---|---|---|---|---|---|---|---|---|---|---|---|---|---|---|
| Benchmark | [-] | 43.7 | ||||||||||||||
| h0 | [-] | 26.3 | 26.1 | 43.7 | 44.4 | -19.4 | 24.3 | 0.168 | 0.0987 | 0.308 | 0.989 | 0.944 | 0.529 | |||
| h0a | [-] | 26.3 | 26.1 | 43.7 | 44.4 | -19.4 | 24.3 | 0.168 | 0.0987 | 0.308 | 0.989 | 0.944 | 0.529 |
Download Data |
Period Mean (original grids) [Watt m-2] |
Model Period Mean (intersection) [Watt m-2] |
Benchmark Period Mean (intersection) [Watt m-2] |
Model Period Mean (complement) [Watt m-2] |
Benchmark Period Mean (complement) [Watt m-2] |
Bias [Watt m-2] |
RMSE [Watt m-2] |
Phase Shift [months] |
Bias Score [1] |
RMSE Score [1] |
Seasonal Cycle Score [1] |
Spatial Distribution Score [1] |
Overall Score [1] |
|||
|---|---|---|---|---|---|---|---|---|---|---|---|---|---|---|---|---|
| Benchmark | [-] | 135. | ||||||||||||||
| h0 | [-] | 109. | 109. | 129. | 172. | -15.4 | 21.7 | 0.969 | 0.350 | 0.661 | 0.872 | 0.879 | 0.685 | |||
| h0a | [-] | 109. | 109. | 129. | 172. | -15.4 | 21.7 | 0.969 | 0.350 | 0.661 | 0.872 | 0.879 | 0.685 |
Download Data |
Period Mean (original grids) [Watt m-2] |
Model Period Mean (intersection) [Watt m-2] |
Benchmark Period Mean (intersection) [Watt m-2] |
Model Period Mean (complement) [Watt m-2] |
Benchmark Period Mean (complement) [Watt m-2] |
Bias [Watt m-2] |
RMSE [Watt m-2] |
Phase Shift [months] |
Bias Score [1] |
RMSE Score [1] |
Seasonal Cycle Score [1] |
Spatial Distribution Score [1] |
Overall Score [1] |
|||
|---|---|---|---|---|---|---|---|---|---|---|---|---|---|---|---|---|
| Benchmark | [-] | 103. | ||||||||||||||
| h0 | [-] | 84.0 | 84.0 | 102. | 135. | -15.9 | 18.0 | 0.621 | 0.167 | 0.692 | 0.953 | 0.998 | 0.701 | |||
| h0a | [-] | 84.0 | 84.0 | 102. | 135. | -15.9 | 18.0 | 0.621 | 0.167 | 0.692 | 0.953 | 0.998 | 0.701 |
Download Data |
Period Mean (original grids) [Watt m-2] |
Model Period Mean (intersection) [Watt m-2] |
Benchmark Period Mean (intersection) [Watt m-2] |
Model Period Mean (complement) [Watt m-2] |
Benchmark Period Mean (complement) [Watt m-2] |
Bias [Watt m-2] |
RMSE [Watt m-2] |
Phase Shift [months] |
Bias Score [1] |
RMSE Score [1] |
Seasonal Cycle Score [1] |
Spatial Distribution Score [1] |
Overall Score [1] |
|||
|---|---|---|---|---|---|---|---|---|---|---|---|---|---|---|---|---|
| Benchmark | [-] | 71.8 | ||||||||||||||
| h0 | [-] | 57.6 | 57.7 | 71.5 | 83.8 | -13.8 | 18.7 | 0.216 | 0.229 | 0.506 | 0.986 | 0.993 | 0.644 | |||
| h0a | [-] | 57.6 | 57.7 | 71.5 | 83.8 | -13.8 | 18.7 | 0.216 | 0.229 | 0.506 | 0.986 | 0.993 | 0.644 |
Download Data |
Period Mean (original grids) [Watt m-2] |
Model Period Mean (intersection) [Watt m-2] |
Benchmark Period Mean (intersection) [Watt m-2] |
Model Period Mean (complement) [Watt m-2] |
Benchmark Period Mean (complement) [Watt m-2] |
Bias [Watt m-2] |
RMSE [Watt m-2] |
Phase Shift [months] |
Bias Score [1] |
RMSE Score [1] |
Seasonal Cycle Score [1] |
Spatial Distribution Score [1] |
Overall Score [1] |
|||
|---|---|---|---|---|---|---|---|---|---|---|---|---|---|---|---|---|
| Benchmark | [-] | 79.5 | ||||||||||||||
| h0 | [-] | 77.3 | 77.6 | 78.8 | 116. | -0.728 | 16.2 | 0.448 | 0.480 | 0.499 | 0.966 | 0.988 | 0.686 | |||
| h0a | [-] | 77.3 | 77.6 | 78.8 | 116. | -0.728 | 16.2 | 0.448 | 0.480 | 0.499 | 0.966 | 0.988 | 0.686 |
Download Data |
Period Mean (original grids) [Watt m-2] |
Model Period Mean (intersection) [Watt m-2] |
Benchmark Period Mean (intersection) [Watt m-2] |
Model Period Mean (complement) [Watt m-2] |
Benchmark Period Mean (complement) [Watt m-2] |
Bias [Watt m-2] |
RMSE [Watt m-2] |
Phase Shift [months] |
Bias Score [1] |
RMSE Score [1] |
Seasonal Cycle Score [1] |
Spatial Distribution Score [1] |
Overall Score [1] |
|||
|---|---|---|---|---|---|---|---|---|---|---|---|---|---|---|---|---|
| Benchmark | [-] | 138. | ||||||||||||||
| h0 | [-] | 117. | 117. | 138. | 184. | -19.7 | 22.4 | 1.11 | 0.139 | 0.750 | 0.849 | 0.965 | 0.691 | |||
| h0a | [-] | 117. | 117. | 138. | 184. | -19.7 | 22.4 | 1.11 | 0.139 | 0.750 | 0.849 | 0.965 | 0.691 |
Download Data |
Period Mean (original grids) [Watt m-2] |
Model Period Mean (intersection) [Watt m-2] |
Benchmark Period Mean (intersection) [Watt m-2] |
Model Period Mean (complement) [Watt m-2] |
Benchmark Period Mean (complement) [Watt m-2] |
Bias [Watt m-2] |
RMSE [Watt m-2] |
Phase Shift [months] |
Bias Score [1] |
RMSE Score [1] |
Seasonal Cycle Score [1] |
Spatial Distribution Score [1] |
Overall Score [1] |
|||
|---|---|---|---|---|---|---|---|---|---|---|---|---|---|---|---|---|
| Benchmark | [-] | 121. | ||||||||||||||
| h0 | [-] | 110. | 110. | 120. | 148. | -9.93 | 15.5 | 1.18 | 0.453 | 0.632 | 0.853 | 0.989 | 0.712 | |||
| h0a | [-] | 110. | 110. | 120. | 148. | -9.93 | 15.5 | 1.18 | 0.453 | 0.632 | 0.853 | 0.989 | 0.712 |
Download Data |
Period Mean (original grids) [Watt m-2] |
Model Period Mean (intersection) [Watt m-2] |
Benchmark Period Mean (intersection) [Watt m-2] |
Model Period Mean (complement) [Watt m-2] |
Benchmark Period Mean (complement) [Watt m-2] |
Bias [Watt m-2] |
RMSE [Watt m-2] |
Phase Shift [months] |
Bias Score [1] |
RMSE Score [1] |
Seasonal Cycle Score [1] |
Spatial Distribution Score [1] |
Overall Score [1] |
|||
|---|---|---|---|---|---|---|---|---|---|---|---|---|---|---|---|---|
| Benchmark | [-] | 95.3 | ||||||||||||||
| h0 | [-] | 84.5 | 83.8 | 92.9 | 125. | -8.90 | 21.8 | 0.568 | 0.276 | 0.602 | 0.949 | 0.984 | 0.683 | |||
| h0a | [-] | 84.5 | 83.8 | 92.9 | 125. | -8.90 | 21.8 | 0.568 | 0.276 | 0.602 | 0.949 | 0.984 | 0.683 |
Temporally integrated period mean