Mean State
Download Data |
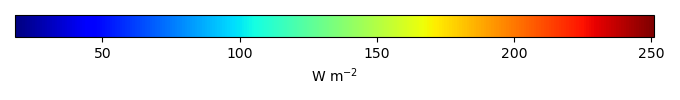
Period Mean (original grids) [W m-2] |
Model Period Mean (intersection) [W m-2] |
Benchmark Period Mean (intersection) [W m-2] |
Model Period Mean (complement) [W m-2] |
Benchmark Period Mean (complement) [W m-2] |
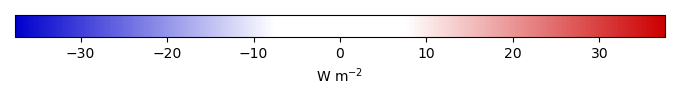
Bias [W m-2] |
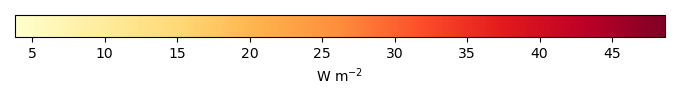
RMSE [W m-2] |
Phase Shift [months] |
Bias Score [1] |
RMSE Score [1] |
Seasonal Cycle Score [1] |
Spatial Distribution Score [1] |
Overall Score [1] |
|||
|---|---|---|---|---|---|---|---|---|---|---|---|---|---|---|---|---|
| Benchmark | [-] | 185. | ||||||||||||||
| h0 | [-] | 178. | 178. | 184. | 208. | -5.43 | 12.0 | 0.934 | 0.623 | 0.737 | 0.870 | 0.983 | 0.790 | |||
| h0a | [-] | 178. | 178. | 184. | 208. | -5.43 | 12.0 | 0.934 | 0.623 | 0.737 | 0.870 | 0.983 | 0.790 |
Download Data |
Period Mean (original grids) [W m-2] |
Model Period Mean (intersection) [W m-2] |
Benchmark Period Mean (intersection) [W m-2] |
Model Period Mean (complement) [W m-2] |
Benchmark Period Mean (complement) [W m-2] |
Bias [W m-2] |
RMSE [W m-2] |
Phase Shift [months] |
Bias Score [1] |
RMSE Score [1] |
Seasonal Cycle Score [1] |
Spatial Distribution Score [1] |
Overall Score [1] |
|||
|---|---|---|---|---|---|---|---|---|---|---|---|---|---|---|---|---|
| Benchmark | [-] | 198. | ||||||||||||||
| h0 | [-] | 197. | 197. | 198. | 214. | -0.131 | 12.0 | 1.55 | 0.625 | 0.647 | 0.772 | 0.950 | 0.728 | |||
| h0a | [-] | 197. | 197. | 198. | 214. | -0.131 | 12.0 | 1.55 | 0.625 | 0.647 | 0.772 | 0.950 | 0.728 |
Download Data |
Period Mean (original grids) [W m-2] |
Model Period Mean (intersection) [W m-2] |
Benchmark Period Mean (intersection) [W m-2] |
Model Period Mean (complement) [W m-2] |
Benchmark Period Mean (complement) [W m-2] |
Bias [W m-2] |
RMSE [W m-2] |
Phase Shift [months] |
Bias Score [1] |
RMSE Score [1] |
Seasonal Cycle Score [1] |
Spatial Distribution Score [1] |
Overall Score [1] |
|||
|---|---|---|---|---|---|---|---|---|---|---|---|---|---|---|---|---|
| Benchmark | [-] | 201. | ||||||||||||||
| h0 | [-] | 195. | 195. | 200. | 220. | -4.76 | 11.0 | 0.840 | 0.668 | 0.749 | 0.897 | 0.993 | 0.811 | |||
| h0a | [-] | 195. | 195. | 200. | 220. | -4.76 | 11.0 | 0.840 | 0.668 | 0.749 | 0.897 | 0.993 | 0.811 |
Download Data |
Period Mean (original grids) [W m-2] |
Model Period Mean (intersection) [W m-2] |
Benchmark Period Mean (intersection) [W m-2] |
Model Period Mean (complement) [W m-2] |
Benchmark Period Mean (complement) [W m-2] |
Bias [W m-2] |
RMSE [W m-2] |
Phase Shift [months] |
Bias Score [1] |
RMSE Score [1] |
Seasonal Cycle Score [1] |
Spatial Distribution Score [1] |
Overall Score [1] |
|||
|---|---|---|---|---|---|---|---|---|---|---|---|---|---|---|---|---|
| Benchmark | [-] | 69.8 | ||||||||||||||
| h0 | [-] | 72.7 | 72.8 | 69.9 | 68.8 | 1.88 | 15.7 | 0.334 | 0.658 | 0.477 | 0.978 | 0.996 | 0.717 | |||
| h0a | [-] | 72.7 | 72.8 | 69.9 | 68.8 | 1.88 | 15.7 | 0.334 | 0.658 | 0.477 | 0.978 | 0.996 | 0.717 |
Download Data |
Period Mean (original grids) [W m-2] |
Model Period Mean (intersection) [W m-2] |
Benchmark Period Mean (intersection) [W m-2] |
Model Period Mean (complement) [W m-2] |
Benchmark Period Mean (complement) [W m-2] |
Bias [W m-2] |
RMSE [W m-2] |
Phase Shift [months] |
Bias Score [1] |
RMSE Score [1] |
Seasonal Cycle Score [1] |
Spatial Distribution Score [1] |
Overall Score [1] |
|||
|---|---|---|---|---|---|---|---|---|---|---|---|---|---|---|---|---|
| Benchmark | [-] | 191. | ||||||||||||||
| h0 | [-] | 177. | 177. | 188. | 205. | -8.20 | 13.1 | 0.890 | 0.668 | 0.782 | 0.878 | 0.893 | 0.801 | |||
| h0a | [-] | 177. | 177. | 188. | 205. | -8.20 | 13.1 | 0.890 | 0.668 | 0.782 | 0.878 | 0.893 | 0.801 |
Download Data |
Period Mean (original grids) [W m-2] |
Model Period Mean (intersection) [W m-2] |
Benchmark Period Mean (intersection) [W m-2] |
Model Period Mean (complement) [W m-2] |
Benchmark Period Mean (complement) [W m-2] |
Bias [W m-2] |
RMSE [W m-2] |
Phase Shift [months] |
Bias Score [1] |
RMSE Score [1] |
Seasonal Cycle Score [1] |
Spatial Distribution Score [1] |
Overall Score [1] |
|||
|---|---|---|---|---|---|---|---|---|---|---|---|---|---|---|---|---|
| Benchmark | [-] | 98.8 | ||||||||||||||
| h0 | [-] | 99.7 | 99.6 | 98.7 | 109. | 1.11 | 8.80 | 0.215 | 0.773 | 0.685 | 0.986 | 0.981 | 0.822 | |||
| h0a | [-] | 99.7 | 99.6 | 98.7 | 109. | 1.11 | 8.80 | 0.215 | 0.773 | 0.685 | 0.986 | 0.981 | 0.822 |
Download Data |
Period Mean (original grids) [W m-2] |
Model Period Mean (intersection) [W m-2] |
Benchmark Period Mean (intersection) [W m-2] |
Model Period Mean (complement) [W m-2] |
Benchmark Period Mean (complement) [W m-2] |
Bias [W m-2] |
RMSE [W m-2] |
Phase Shift [months] |
Bias Score [1] |
RMSE Score [1] |
Seasonal Cycle Score [1] |
Spatial Distribution Score [1] |
Overall Score [1] |
|||
|---|---|---|---|---|---|---|---|---|---|---|---|---|---|---|---|---|
| Benchmark | [-] | 139. | ||||||||||||||
| h0 | [-] | 134. | 134. | 139. | 154. | -4.45 | 13.6 | 0.352 | 0.528 | 0.560 | 0.970 | 0.997 | 0.723 | |||
| h0a | [-] | 134. | 134. | 139. | 154. | -4.45 | 13.6 | 0.352 | 0.528 | 0.560 | 0.970 | 0.997 | 0.723 |
Download Data |
Period Mean (original grids) [W m-2] |
Model Period Mean (intersection) [W m-2] |
Benchmark Period Mean (intersection) [W m-2] |
Model Period Mean (complement) [W m-2] |
Benchmark Period Mean (complement) [W m-2] |
Bias [W m-2] |
RMSE [W m-2] |
Phase Shift [months] |
Bias Score [1] |
RMSE Score [1] |
Seasonal Cycle Score [1] |
Spatial Distribution Score [1] |
Overall Score [1] |
|||
|---|---|---|---|---|---|---|---|---|---|---|---|---|---|---|---|---|
| Benchmark | [-] | 181. | ||||||||||||||
| h0 | [-] | 175. | 174. | 180. | 205. | -3.69 | 14.3 | 0.429 | 0.594 | 0.626 | 0.962 | 0.958 | 0.753 | |||
| h0a | [-] | 175. | 174. | 180. | 205. | -3.69 | 14.3 | 0.429 | 0.594 | 0.626 | 0.962 | 0.958 | 0.753 |
Download Data |
Period Mean (original grids) [W m-2] |
Model Period Mean (intersection) [W m-2] |
Benchmark Period Mean (intersection) [W m-2] |
Model Period Mean (complement) [W m-2] |
Benchmark Period Mean (complement) [W m-2] |
Bias [W m-2] |
RMSE [W m-2] |
Phase Shift [months] |
Bias Score [1] |
RMSE Score [1] |
Seasonal Cycle Score [1] |
Spatial Distribution Score [1] |
Overall Score [1] |
|||
|---|---|---|---|---|---|---|---|---|---|---|---|---|---|---|---|---|
| Benchmark | [-] | 62.2 | ||||||||||||||
| h0 | [-] | 63.5 | 63.9 | 62.5 | 53.8 | -0.412 | 12.4 | 0.237 | 0.781 | 0.567 | 0.984 | 0.993 | 0.778 | |||
| h0a | [-] | 63.5 | 63.9 | 62.5 | 53.8 | -0.412 | 12.4 | 0.237 | 0.781 | 0.567 | 0.984 | 0.993 | 0.778 |
Download Data |
Period Mean (original grids) [W m-2] |
Model Period Mean (intersection) [W m-2] |
Benchmark Period Mean (intersection) [W m-2] |
Model Period Mean (complement) [W m-2] |
Benchmark Period Mean (complement) [W m-2] |
Bias [W m-2] |
RMSE [W m-2] |
Phase Shift [months] |
Bias Score [1] |
RMSE Score [1] |
Seasonal Cycle Score [1] |
Spatial Distribution Score [1] |
Overall Score [1] |
|||
|---|---|---|---|---|---|---|---|---|---|---|---|---|---|---|---|---|
| Benchmark | [-] | 200. | ||||||||||||||
| h0 | [-] | 189. | 189. | 200. | 202. | -11.9 | 13.9 | 0.391 | 0.365 | 0.757 | 0.970 | 0.994 | 0.769 | |||
| h0a | [-] | 189. | 189. | 200. | 202. | -11.9 | 13.9 | 0.391 | 0.365 | 0.757 | 0.970 | 0.994 | 0.769 |
Download Data |
Period Mean (original grids) [W m-2] |
Model Period Mean (intersection) [W m-2] |
Benchmark Period Mean (intersection) [W m-2] |
Model Period Mean (complement) [W m-2] |
Benchmark Period Mean (complement) [W m-2] |
Bias [W m-2] |
RMSE [W m-2] |
Phase Shift [months] |
Bias Score [1] |
RMSE Score [1] |
Seasonal Cycle Score [1] |
Spatial Distribution Score [1] |
Overall Score [1] |
|||
|---|---|---|---|---|---|---|---|---|---|---|---|---|---|---|---|---|
| Benchmark | [-] | 121. | ||||||||||||||
| h0 | [-] | 109. | 109. | 120. | 147. | -7.76 | 12.7 | 0.202 | 0.487 | 0.679 | 0.987 | 0.981 | 0.762 | |||
| h0a | [-] | 109. | 109. | 120. | 147. | -7.76 | 12.7 | 0.202 | 0.487 | 0.679 | 0.987 | 0.981 | 0.762 |
Download Data |
Period Mean (original grids) [W m-2] |
Model Period Mean (intersection) [W m-2] |
Benchmark Period Mean (intersection) [W m-2] |
Model Period Mean (complement) [W m-2] |
Benchmark Period Mean (complement) [W m-2] |
Bias [W m-2] |
RMSE [W m-2] |
Phase Shift [months] |
Bias Score [1] |
RMSE Score [1] |
Seasonal Cycle Score [1] |
Spatial Distribution Score [1] |
Overall Score [1] |
|||
|---|---|---|---|---|---|---|---|---|---|---|---|---|---|---|---|---|
| Benchmark | [-] | 143. | ||||||||||||||
| h0 | [-] | 136. | 136. | 142. | 171. | -5.40 | 13.1 | 0.474 | 0.575 | 0.659 | 0.947 | 0.998 | 0.768 | |||
| h0a | [-] | 136. | 136. | 142. | 171. | -5.40 | 13.1 | 0.474 | 0.575 | 0.659 | 0.947 | 0.998 | 0.768 |
Download Data |
Period Mean (original grids) [W m-2] |
Model Period Mean (intersection) [W m-2] |
Benchmark Period Mean (intersection) [W m-2] |
Model Period Mean (complement) [W m-2] |
Benchmark Period Mean (complement) [W m-2] |
Bias [W m-2] |
RMSE [W m-2] |
Phase Shift [months] |
Bias Score [1] |
RMSE Score [1] |
Seasonal Cycle Score [1] |
Spatial Distribution Score [1] |
Overall Score [1] |
|||
|---|---|---|---|---|---|---|---|---|---|---|---|---|---|---|---|---|
| Benchmark | [-] | 177. | ||||||||||||||
| h0 | [-] | 162. | 162. | 175. | 217. | -11.5 | 16.6 | 0.412 | 0.356 | 0.690 | 0.958 | 0.947 | 0.728 | |||
| h0a | [-] | 162. | 162. | 175. | 217. | -11.5 | 16.6 | 0.412 | 0.356 | 0.690 | 0.958 | 0.947 | 0.728 |
Download Data |
Period Mean (original grids) [W m-2] |
Model Period Mean (intersection) [W m-2] |
Benchmark Period Mean (intersection) [W m-2] |
Model Period Mean (complement) [W m-2] |
Benchmark Period Mean (complement) [W m-2] |
Bias [W m-2] |
RMSE [W m-2] |
Phase Shift [months] |
Bias Score [1] |
RMSE Score [1] |
Seasonal Cycle Score [1] |
Spatial Distribution Score [1] |
Overall Score [1] |
|||
|---|---|---|---|---|---|---|---|---|---|---|---|---|---|---|---|---|
| Benchmark | [-] | 68.9 | ||||||||||||||
| h0 | [-] | 70.8 | 70.7 | 68.9 | 68.6 | -0.385 | 15.7 | 0.136 | 0.667 | 0.455 | 0.991 | 0.967 | 0.707 | |||
| h0a | [-] | 70.8 | 70.7 | 68.9 | 68.6 | -0.385 | 15.7 | 0.136 | 0.667 | 0.455 | 0.991 | 0.967 | 0.707 |
Download Data |
Period Mean (original grids) [W m-2] |
Model Period Mean (intersection) [W m-2] |
Benchmark Period Mean (intersection) [W m-2] |
Model Period Mean (complement) [W m-2] |
Benchmark Period Mean (complement) [W m-2] |
Bias [W m-2] |
RMSE [W m-2] |
Phase Shift [months] |
Bias Score [1] |
RMSE Score [1] |
Seasonal Cycle Score [1] |
Spatial Distribution Score [1] |
Overall Score [1] |
|||
|---|---|---|---|---|---|---|---|---|---|---|---|---|---|---|---|---|
| Benchmark | [-] | 204. | ||||||||||||||
| h0 | [-] | 191. | 191. | 201. | 220. | -7.99 | 14.2 | 0.522 | 0.501 | 0.726 | 0.946 | 0.971 | 0.774 | |||
| h0a | [-] | 191. | 191. | 201. | 220. | -7.99 | 14.2 | 0.522 | 0.501 | 0.726 | 0.946 | 0.971 | 0.774 |
Download Data |
Period Mean (original grids) [W m-2] |
Model Period Mean (intersection) [W m-2] |
Benchmark Period Mean (intersection) [W m-2] |
Model Period Mean (complement) [W m-2] |
Benchmark Period Mean (complement) [W m-2] |
Bias [W m-2] |
RMSE [W m-2] |
Phase Shift [months] |
Bias Score [1] |
RMSE Score [1] |
Seasonal Cycle Score [1] |
Spatial Distribution Score [1] |
Overall Score [1] |
|||
|---|---|---|---|---|---|---|---|---|---|---|---|---|---|---|---|---|
| Benchmark | [-] | 151. | ||||||||||||||
| h0 | [-] | 141. | 141. | 150. | 188. | -6.43 | 10.3 | 0.404 | 0.576 | 0.729 | 0.973 | 0.992 | 0.800 | |||
| h0a | [-] | 141. | 141. | 150. | 188. | -6.43 | 10.3 | 0.404 | 0.576 | 0.729 | 0.973 | 0.992 | 0.800 |
Download Data |
Period Mean (original grids) [W m-2] |
Model Period Mean (intersection) [W m-2] |
Benchmark Period Mean (intersection) [W m-2] |
Model Period Mean (complement) [W m-2] |
Benchmark Period Mean (complement) [W m-2] |
Bias [W m-2] |
RMSE [W m-2] |
Phase Shift [months] |
Bias Score [1] |
RMSE Score [1] |
Seasonal Cycle Score [1] |
Spatial Distribution Score [1] |
Overall Score [1] |
|||
|---|---|---|---|---|---|---|---|---|---|---|---|---|---|---|---|---|
| Benchmark | [-] | 110. | ||||||||||||||
| h0 | [-] | 110. | 110. | 110. | 121. | -0.472 | 9.47 | 0.185 | 0.706 | 0.668 | 0.986 | 0.975 | 0.801 | |||
| h0a | [-] | 110. | 110. | 110. | 121. | -0.472 | 9.47 | 0.185 | 0.706 | 0.668 | 0.986 | 0.975 | 0.801 |
Download Data |
Period Mean (original grids) [W m-2] |
Model Period Mean (intersection) [W m-2] |
Benchmark Period Mean (intersection) [W m-2] |
Model Period Mean (complement) [W m-2] |
Benchmark Period Mean (complement) [W m-2] |
Bias [W m-2] |
RMSE [W m-2] |
Phase Shift [months] |
Bias Score [1] |
RMSE Score [1] |
Seasonal Cycle Score [1] |
Spatial Distribution Score [1] |
Overall Score [1] |
|||
|---|---|---|---|---|---|---|---|---|---|---|---|---|---|---|---|---|
| Benchmark | [-] | 163. | ||||||||||||||
| h0 | [-] | 159. | 159. | 163. | 165. | -4.42 | 10.2 | 0.146 | 0.585 | 0.697 | 0.990 | 0.978 | 0.790 | |||
| h0a | [-] | 159. | 159. | 163. | 165. | -4.42 | 10.2 | 0.146 | 0.585 | 0.697 | 0.990 | 0.978 | 0.790 |
Download Data |
Period Mean (original grids) [W m-2] |
Model Period Mean (intersection) [W m-2] |
Benchmark Period Mean (intersection) [W m-2] |
Model Period Mean (complement) [W m-2] |
Benchmark Period Mean (complement) [W m-2] |
Bias [W m-2] |
RMSE [W m-2] |
Phase Shift [months] |
Bias Score [1] |
RMSE Score [1] |
Seasonal Cycle Score [1] |
Spatial Distribution Score [1] |
Overall Score [1] |
|||
|---|---|---|---|---|---|---|---|---|---|---|---|---|---|---|---|---|
| Benchmark | [-] | 175. | ||||||||||||||
| h0 | [-] | 171. | 171. | 174. | 223. | -2.58 | 9.52 | 0.938 | 0.741 | 0.794 | 0.879 | 0.936 | 0.829 | |||
| h0a | [-] | 171. | 171. | 174. | 223. | -2.58 | 9.52 | 0.938 | 0.741 | 0.794 | 0.879 | 0.936 | 0.829 |
Download Data |
Period Mean (original grids) [W m-2] |
Model Period Mean (intersection) [W m-2] |
Benchmark Period Mean (intersection) [W m-2] |
Model Period Mean (complement) [W m-2] |
Benchmark Period Mean (complement) [W m-2] |
Bias [W m-2] |
RMSE [W m-2] |
Phase Shift [months] |
Bias Score [1] |
RMSE Score [1] |
Seasonal Cycle Score [1] |
Spatial Distribution Score [1] |
Overall Score [1] |
|||
|---|---|---|---|---|---|---|---|---|---|---|---|---|---|---|---|---|
| Benchmark | [-] | 184. | ||||||||||||||
| h0 | [-] | 178. | 179. | 184. | 207. | -5.02 | 12.2 | 0.907 | 0.671 | 0.684 | 0.889 | 0.990 | 0.783 | |||
| h0a | [-] | 178. | 179. | 184. | 207. | -5.02 | 12.2 | 0.907 | 0.671 | 0.684 | 0.889 | 0.990 | 0.783 |
Download Data |
Period Mean (original grids) [W m-2] |
Model Period Mean (intersection) [W m-2] |
Benchmark Period Mean (intersection) [W m-2] |
Model Period Mean (complement) [W m-2] |
Benchmark Period Mean (complement) [W m-2] |
Bias [W m-2] |
RMSE [W m-2] |
Phase Shift [months] |
Bias Score [1] |
RMSE Score [1] |
Seasonal Cycle Score [1] |
Spatial Distribution Score [1] |
Overall Score [1] |
|||
|---|---|---|---|---|---|---|---|---|---|---|---|---|---|---|---|---|
| Benchmark | [-] | 179. | ||||||||||||||
| h0 | [-] | 172. | 171. | 179. | 176. | -10.2 | 19.3 | 0.540 | 0.291 | 0.523 | 0.941 | 0.997 | 0.655 | |||
| h0a | [-] | 172. | 171. | 179. | 176. | -10.2 | 19.3 | 0.540 | 0.291 | 0.523 | 0.941 | 0.997 | 0.655 |
Temporally integrated period mean