Mean State
Download Data |
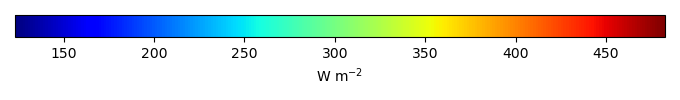
Period Mean (original grids) [W m-2] |
Model Period Mean (intersection) [W m-2] |
Benchmark Period Mean (intersection) [W m-2] |
Model Period Mean (complement) [W m-2] |
Benchmark Period Mean (complement) [W m-2] |
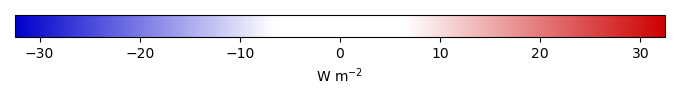
Bias [W m-2] |
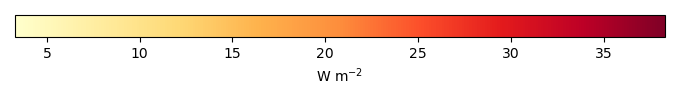
RMSE [W m-2] |
Phase Shift [months] |
Bias Score [1] |
RMSE Score [1] |
Seasonal Cycle Score [1] |
Spatial Distribution Score [1] |
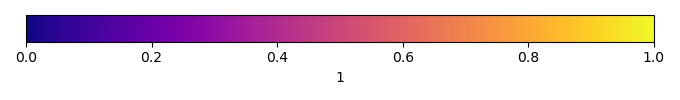
Overall Score [1] |
|||
|---|---|---|---|---|---|---|---|---|---|---|---|---|---|---|---|---|
| Benchmark | [-] | 449. | ||||||||||||||
| h0 | [-] | 458. | 458. | 449. | 463. | 10.2 | 13.0 | 1.20 | 0.286 | 0.791 | 0.841 | 0.998 | 0.742 | |||
| h0a | [-] | 458. | 458. | 449. | 463. | 10.2 | 13.0 | 1.20 | 0.286 | 0.791 | 0.841 | 0.998 | 0.742 |
Download Data |
Period Mean (original grids) [W m-2] |
Model Period Mean (intersection) [W m-2] |
Benchmark Period Mean (intersection) [W m-2] |
Model Period Mean (complement) [W m-2] |
Benchmark Period Mean (complement) [W m-2] |
Bias [W m-2] |
RMSE [W m-2] |
Phase Shift [months] |
Bias Score [1] |
RMSE Score [1] |
Seasonal Cycle Score [1] |
Spatial Distribution Score [1] |
Overall Score [1] |
|||
|---|---|---|---|---|---|---|---|---|---|---|---|---|---|---|---|---|
| Benchmark | [-] | 467. | ||||||||||||||
| h0 | [-] | 474. | 474. | 467. | 457. | 6.57 | 14.8 | 0.408 | 0.446 | 0.580 | 0.963 | 0.951 | 0.704 | |||
| h0a | [-] | 474. | 474. | 467. | 457. | 6.57 | 14.8 | 0.408 | 0.446 | 0.580 | 0.963 | 0.951 | 0.704 |
Download Data |
Period Mean (original grids) [W m-2] |
Model Period Mean (intersection) [W m-2] |
Benchmark Period Mean (intersection) [W m-2] |
Model Period Mean (complement) [W m-2] |
Benchmark Period Mean (complement) [W m-2] |
Bias [W m-2] |
RMSE [W m-2] |
Phase Shift [months] |
Bias Score [1] |
RMSE Score [1] |
Seasonal Cycle Score [1] |
Spatial Distribution Score [1] |
Overall Score [1] |
|||
|---|---|---|---|---|---|---|---|---|---|---|---|---|---|---|---|---|
| Benchmark | [-] | 438. | ||||||||||||||
| h0 | [-] | 443. | 443. | 438. | 442. | 6.08 | 12.7 | 0.891 | 0.438 | 0.650 | 0.886 | 0.998 | 0.724 | |||
| h0a | [-] | 443. | 443. | 438. | 442. | 6.08 | 12.7 | 0.891 | 0.438 | 0.650 | 0.886 | 0.998 | 0.724 |
Download Data |
Period Mean (original grids) [W m-2] |
Model Period Mean (intersection) [W m-2] |
Benchmark Period Mean (intersection) [W m-2] |
Model Period Mean (complement) [W m-2] |
Benchmark Period Mean (complement) [W m-2] |
Bias [W m-2] |
RMSE [W m-2] |
Phase Shift [months] |
Bias Score [1] |
RMSE Score [1] |
Seasonal Cycle Score [1] |
Spatial Distribution Score [1] |
Overall Score [1] |
|||
|---|---|---|---|---|---|---|---|---|---|---|---|---|---|---|---|---|
| Benchmark | [-] | 284. | ||||||||||||||
| h0 | [-] | 270. | 270. | 283. | 299. | -9.44 | 15.5 | 0.121 | 0.296 | 0.470 | 0.992 | 0.995 | 0.645 | |||
| h0a | [-] | 270. | 270. | 283. | 299. | -9.44 | 15.5 | 0.121 | 0.296 | 0.470 | 0.992 | 0.995 | 0.645 |
Download Data |
Period Mean (original grids) [W m-2] |
Model Period Mean (intersection) [W m-2] |
Benchmark Period Mean (intersection) [W m-2] |
Model Period Mean (complement) [W m-2] |
Benchmark Period Mean (complement) [W m-2] |
Bias [W m-2] |
RMSE [W m-2] |
Phase Shift [months] |
Bias Score [1] |
RMSE Score [1] |
Seasonal Cycle Score [1] |
Spatial Distribution Score [1] |
Overall Score [1] |
|||
|---|---|---|---|---|---|---|---|---|---|---|---|---|---|---|---|---|
| Benchmark | [-] | 456. | ||||||||||||||
| h0 | [-] | 455. | 455. | 454. | 468. | 2.20 | 12.8 | 2.02 | 0.290 | 0.863 | 0.687 | 0.624 | 0.666 | |||
| h0a | [-] | 455. | 455. | 454. | 468. | 2.20 | 12.8 | 2.02 | 0.290 | 0.863 | 0.687 | 0.624 | 0.666 |
Download Data |
Period Mean (original grids) [W m-2] |
Model Period Mean (intersection) [W m-2] |
Benchmark Period Mean (intersection) [W m-2] |
Model Period Mean (complement) [W m-2] |
Benchmark Period Mean (complement) [W m-2] |
Bias [W m-2] |
RMSE [W m-2] |
Phase Shift [months] |
Bias Score [1] |
RMSE Score [1] |
Seasonal Cycle Score [1] |
Spatial Distribution Score [1] |
Overall Score [1] |
|||
|---|---|---|---|---|---|---|---|---|---|---|---|---|---|---|---|---|
| Benchmark | [-] | 311. | ||||||||||||||
| h0 | [-] | 310. | 310. | 311. | 334. | -0.233 | 8.79 | 0.0438 | 0.704 | 0.594 | 0.997 | 0.999 | 0.777 | |||
| h0a | [-] | 310. | 310. | 311. | 334. | -0.233 | 8.79 | 0.0438 | 0.704 | 0.594 | 0.997 | 0.999 | 0.777 |
Download Data |
Period Mean (original grids) [W m-2] |
Model Period Mean (intersection) [W m-2] |
Benchmark Period Mean (intersection) [W m-2] |
Model Period Mean (complement) [W m-2] |
Benchmark Period Mean (complement) [W m-2] |
Bias [W m-2] |
RMSE [W m-2] |
Phase Shift [months] |
Bias Score [1] |
RMSE Score [1] |
Seasonal Cycle Score [1] |
Spatial Distribution Score [1] |
Overall Score [1] |
|||
|---|---|---|---|---|---|---|---|---|---|---|---|---|---|---|---|---|
| Benchmark | [-] | 363. | ||||||||||||||
| h0 | [-] | 359. | 359. | 362. | 413. | -0.929 | 10.3 | 0.0874 | 0.565 | 0.672 | 0.994 | 1.00 | 0.780 | |||
| h0a | [-] | 359. | 359. | 362. | 413. | -0.929 | 10.3 | 0.0874 | 0.565 | 0.672 | 0.994 | 1.00 | 0.780 |
Download Data |
Period Mean (original grids) [W m-2] |
Model Period Mean (intersection) [W m-2] |
Benchmark Period Mean (intersection) [W m-2] |
Model Period Mean (complement) [W m-2] |
Benchmark Period Mean (complement) [W m-2] |
Bias [W m-2] |
RMSE [W m-2] |
Phase Shift [months] |
Bias Score [1] |
RMSE Score [1] |
Seasonal Cycle Score [1] |
Spatial Distribution Score [1] |
Overall Score [1] |
|||
|---|---|---|---|---|---|---|---|---|---|---|---|---|---|---|---|---|
| Benchmark | [-] | 446. | ||||||||||||||
| h0 | [-] | 448. | 449. | 445. | 466. | 6.95 | 13.5 | 0.398 | 0.363 | 0.645 | 0.963 | 0.993 | 0.722 | |||
| h0a | [-] | 448. | 449. | 445. | 466. | 6.95 | 13.5 | 0.398 | 0.363 | 0.645 | 0.963 | 0.993 | 0.722 |
Download Data |
Period Mean (original grids) [W m-2] |
Model Period Mean (intersection) [W m-2] |
Benchmark Period Mean (intersection) [W m-2] |
Model Period Mean (complement) [W m-2] |
Benchmark Period Mean (complement) [W m-2] |
Bias [W m-2] |
RMSE [W m-2] |
Phase Shift [months] |
Bias Score [1] |
RMSE Score [1] |
Seasonal Cycle Score [1] |
Spatial Distribution Score [1] |
Overall Score [1] |
|||
|---|---|---|---|---|---|---|---|---|---|---|---|---|---|---|---|---|
| Benchmark | [-] | 284. | ||||||||||||||
| h0 | [-] | 277. | 277. | 283. | 298. | -4.98 | 11.9 | 0.0890 | 0.528 | 0.511 | 0.994 | 0.970 | 0.703 | |||
| h0a | [-] | 277. | 277. | 283. | 298. | -4.98 | 11.9 | 0.0890 | 0.528 | 0.511 | 0.994 | 0.970 | 0.703 |
Download Data |
Period Mean (original grids) [W m-2] |
Model Period Mean (intersection) [W m-2] |
Benchmark Period Mean (intersection) [W m-2] |
Model Period Mean (complement) [W m-2] |
Benchmark Period Mean (complement) [W m-2] |
Bias [W m-2] |
RMSE [W m-2] |
Phase Shift [months] |
Bias Score [1] |
RMSE Score [1] |
Seasonal Cycle Score [1] |
Spatial Distribution Score [1] |
Overall Score [1] |
|||
|---|---|---|---|---|---|---|---|---|---|---|---|---|---|---|---|---|
| Benchmark | [-] | 441. | ||||||||||||||
| h0 | [-] | 443. | 443. | 442. | 426. | -1.08 | 10.8 | 0.373 | 0.618 | 0.686 | 0.969 | 0.993 | 0.790 | |||
| h0a | [-] | 443. | 443. | 442. | 426. | -1.08 | 10.8 | 0.373 | 0.618 | 0.686 | 0.969 | 0.993 | 0.790 |
Download Data |
Period Mean (original grids) [W m-2] |
Model Period Mean (intersection) [W m-2] |
Benchmark Period Mean (intersection) [W m-2] |
Model Period Mean (complement) [W m-2] |
Benchmark Period Mean (complement) [W m-2] |
Bias [W m-2] |
RMSE [W m-2] |
Phase Shift [months] |
Bias Score [1] |
RMSE Score [1] |
Seasonal Cycle Score [1] |
Spatial Distribution Score [1] |
Overall Score [1] |
|||
|---|---|---|---|---|---|---|---|---|---|---|---|---|---|---|---|---|
| Benchmark | [-] | 365. | ||||||||||||||
| h0 | [-] | 358. | 358. | 364. | 388. | -2.00 | 10.0 | 0.378 | 0.552 | 0.651 | 0.975 | 0.996 | 0.765 | |||
| h0a | [-] | 358. | 358. | 364. | 388. | -2.00 | 10.0 | 0.378 | 0.552 | 0.651 | 0.975 | 0.996 | 0.765 |
Download Data |
Period Mean (original grids) [W m-2] |
Model Period Mean (intersection) [W m-2] |
Benchmark Period Mean (intersection) [W m-2] |
Model Period Mean (complement) [W m-2] |
Benchmark Period Mean (complement) [W m-2] |
Bias [W m-2] |
RMSE [W m-2] |
Phase Shift [months] |
Bias Score [1] |
RMSE Score [1] |
Seasonal Cycle Score [1] |
Spatial Distribution Score [1] |
Overall Score [1] |
|||
|---|---|---|---|---|---|---|---|---|---|---|---|---|---|---|---|---|
| Benchmark | [-] | 377. | ||||||||||||||
| h0 | [-] | 374. | 374. | 376. | 409. | 0.666 | 11.9 | 0.485 | 0.487 | 0.670 | 0.947 | 0.997 | 0.754 | |||
| h0a | [-] | 374. | 374. | 376. | 409. | 0.666 | 11.9 | 0.485 | 0.487 | 0.670 | 0.947 | 0.997 | 0.754 |
Download Data |
Period Mean (original grids) [W m-2] |
Model Period Mean (intersection) [W m-2] |
Benchmark Period Mean (intersection) [W m-2] |
Model Period Mean (complement) [W m-2] |
Benchmark Period Mean (complement) [W m-2] |
Bias [W m-2] |
RMSE [W m-2] |
Phase Shift [months] |
Bias Score [1] |
RMSE Score [1] |
Seasonal Cycle Score [1] |
Spatial Distribution Score [1] |
Overall Score [1] |
|||
|---|---|---|---|---|---|---|---|---|---|---|---|---|---|---|---|---|
| Benchmark | [-] | 453. | ||||||||||||||
| h0 | [-] | 450. | 449. | 453. | 439. | -3.27 | 12.0 | 0.438 | 0.617 | 0.715 | 0.966 | 1.00 | 0.802 | |||
| h0a | [-] | 450. | 449. | 453. | 439. | -3.27 | 12.0 | 0.438 | 0.617 | 0.715 | 0.966 | 1.00 | 0.802 |
Download Data |
Period Mean (original grids) [W m-2] |
Model Period Mean (intersection) [W m-2] |
Benchmark Period Mean (intersection) [W m-2] |
Model Period Mean (complement) [W m-2] |
Benchmark Period Mean (complement) [W m-2] |
Bias [W m-2] |
RMSE [W m-2] |
Phase Shift [months] |
Bias Score [1] |
RMSE Score [1] |
Seasonal Cycle Score [1] |
Spatial Distribution Score [1] |
Overall Score [1] |
|||
|---|---|---|---|---|---|---|---|---|---|---|---|---|---|---|---|---|
| Benchmark | [-] | 286. | ||||||||||||||
| h0 | [-] | 279. | 278. | 286. | 296. | -7.25 | 13.5 | 0.162 | 0.399 | 0.511 | 0.989 | 0.965 | 0.675 | |||
| h0a | [-] | 279. | 278. | 286. | 296. | -7.25 | 13.5 | 0.162 | 0.399 | 0.511 | 0.989 | 0.965 | 0.675 |
Download Data |
Period Mean (original grids) [W m-2] |
Model Period Mean (intersection) [W m-2] |
Benchmark Period Mean (intersection) [W m-2] |
Model Period Mean (complement) [W m-2] |
Benchmark Period Mean (complement) [W m-2] |
Bias [W m-2] |
RMSE [W m-2] |
Phase Shift [months] |
Bias Score [1] |
RMSE Score [1] |
Seasonal Cycle Score [1] |
Spatial Distribution Score [1] |
Overall Score [1] |
|||
|---|---|---|---|---|---|---|---|---|---|---|---|---|---|---|---|---|
| Benchmark | [-] | 443. | ||||||||||||||
| h0 | [-] | 441. | 440. | 439. | 461. | 5.37 | 13.2 | 0.720 | 0.389 | 0.693 | 0.913 | 0.977 | 0.733 | |||
| h0a | [-] | 441. | 440. | 439. | 461. | 5.37 | 13.2 | 0.720 | 0.389 | 0.693 | 0.913 | 0.977 | 0.733 |
Download Data |
Period Mean (original grids) [W m-2] |
Model Period Mean (intersection) [W m-2] |
Benchmark Period Mean (intersection) [W m-2] |
Model Period Mean (complement) [W m-2] |
Benchmark Period Mean (complement) [W m-2] |
Bias [W m-2] |
RMSE [W m-2] |
Phase Shift [months] |
Bias Score [1] |
RMSE Score [1] |
Seasonal Cycle Score [1] |
Spatial Distribution Score [1] |
Overall Score [1] |
|||
|---|---|---|---|---|---|---|---|---|---|---|---|---|---|---|---|---|
| Benchmark | [-] | 383. | ||||||||||||||
| h0 | [-] | 387. | 387. | 382. | 427. | 8.23 | 10.9 | 0.288 | 0.335 | 0.755 | 0.981 | 0.999 | 0.765 | |||
| h0a | [-] | 387. | 387. | 382. | 427. | 8.23 | 10.9 | 0.288 | 0.335 | 0.755 | 0.981 | 0.999 | 0.765 |
Download Data |
Period Mean (original grids) [W m-2] |
Model Period Mean (intersection) [W m-2] |
Benchmark Period Mean (intersection) [W m-2] |
Model Period Mean (complement) [W m-2] |
Benchmark Period Mean (complement) [W m-2] |
Bias [W m-2] |
RMSE [W m-2] |
Phase Shift [months] |
Bias Score [1] |
RMSE Score [1] |
Seasonal Cycle Score [1] |
Spatial Distribution Score [1] |
Overall Score [1] |
|||
|---|---|---|---|---|---|---|---|---|---|---|---|---|---|---|---|---|
| Benchmark | [-] | 322. | ||||||||||||||
| h0 | [-] | 321. | 321. | 322. | 348. | 0.912 | 8.62 | 0.107 | 0.660 | 0.624 | 0.993 | 1.00 | 0.780 | |||
| h0a | [-] | 321. | 321. | 322. | 348. | 0.912 | 8.62 | 0.107 | 0.660 | 0.624 | 0.993 | 1.00 | 0.780 |
Download Data |
Period Mean (original grids) [W m-2] |
Model Period Mean (intersection) [W m-2] |
Benchmark Period Mean (intersection) [W m-2] |
Model Period Mean (complement) [W m-2] |
Benchmark Period Mean (complement) [W m-2] |
Bias [W m-2] |
RMSE [W m-2] |
Phase Shift [months] |
Bias Score [1] |
RMSE Score [1] |
Seasonal Cycle Score [1] |
Spatial Distribution Score [1] |
Overall Score [1] |
|||
|---|---|---|---|---|---|---|---|---|---|---|---|---|---|---|---|---|
| Benchmark | [-] | 375. | ||||||||||||||
| h0 | [-] | 375. | 376. | 375. | 379. | 0.703 | 9.30 | 0.126 | 0.571 | 0.696 | 0.991 | 0.990 | 0.789 | |||
| h0a | [-] | 375. | 376. | 375. | 379. | 0.703 | 9.30 | 0.126 | 0.571 | 0.696 | 0.991 | 0.990 | 0.789 |
Download Data |
Period Mean (original grids) [W m-2] |
Model Period Mean (intersection) [W m-2] |
Benchmark Period Mean (intersection) [W m-2] |
Model Period Mean (complement) [W m-2] |
Benchmark Period Mean (complement) [W m-2] |
Bias [W m-2] |
RMSE [W m-2] |
Phase Shift [months] |
Bias Score [1] |
RMSE Score [1] |
Seasonal Cycle Score [1] |
Spatial Distribution Score [1] |
Overall Score [1] |
|||
|---|---|---|---|---|---|---|---|---|---|---|---|---|---|---|---|---|
| Benchmark | [-] | 444. | ||||||||||||||
| h0 | [-] | 455. | 455. | 443. | 462. | 11.7 | 14.2 | 1.51 | 0.168 | 0.803 | 0.788 | 0.992 | 0.711 | |||
| h0a | [-] | 455. | 455. | 443. | 462. | 11.7 | 14.2 | 1.51 | 0.168 | 0.803 | 0.788 | 0.992 | 0.711 |
Download Data |
Period Mean (original grids) [W m-2] |
Model Period Mean (intersection) [W m-2] |
Benchmark Period Mean (intersection) [W m-2] |
Model Period Mean (complement) [W m-2] |
Benchmark Period Mean (complement) [W m-2] |
Bias [W m-2] |
RMSE [W m-2] |
Phase Shift [months] |
Bias Score [1] |
RMSE Score [1] |
Seasonal Cycle Score [1] |
Spatial Distribution Score [1] |
Overall Score [1] |
|||
|---|---|---|---|---|---|---|---|---|---|---|---|---|---|---|---|---|
| Benchmark | [-] | 434. | ||||||||||||||
| h0 | [-] | 441. | 440. | 434. | 431. | 6.30 | 9.25 | 0.698 | 0.487 | 0.730 | 0.918 | 0.987 | 0.770 | |||
| h0a | [-] | 441. | 440. | 434. | 431. | 6.30 | 9.25 | 0.698 | 0.487 | 0.730 | 0.918 | 0.987 | 0.770 |
Download Data |
Period Mean (original grids) [W m-2] |
Model Period Mean (intersection) [W m-2] |
Benchmark Period Mean (intersection) [W m-2] |
Model Period Mean (complement) [W m-2] |
Benchmark Period Mean (complement) [W m-2] |
Bias [W m-2] |
RMSE [W m-2] |
Phase Shift [months] |
Bias Score [1] |
RMSE Score [1] |
Seasonal Cycle Score [1] |
Spatial Distribution Score [1] |
Overall Score [1] |
|||
|---|---|---|---|---|---|---|---|---|---|---|---|---|---|---|---|---|
| Benchmark | [-] | 382. | ||||||||||||||
| h0 | [-] | 384. | 384. | 381. | 391. | 4.91 | 13.5 | 0.614 | 0.391 | 0.725 | 0.928 | 0.998 | 0.754 | |||
| h0a | [-] | 384. | 384. | 381. | 391. | 4.91 | 13.5 | 0.614 | 0.391 | 0.725 | 0.928 | 0.998 | 0.754 |
Temporally integrated period mean