Mean State
Download Data |
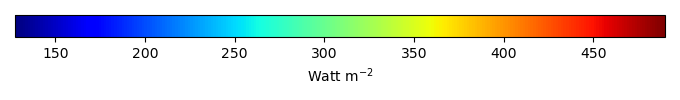
Period Mean (original grids) [Watt m-2] |
Model Period Mean (intersection) [Watt m-2] |
Benchmark Period Mean (intersection) [Watt m-2] |
Model Period Mean (complement) [Watt m-2] |
Benchmark Period Mean (complement) [Watt m-2] |
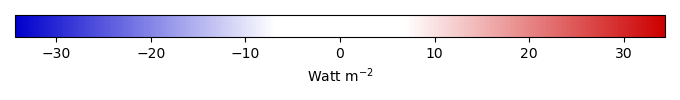
Bias [Watt m-2] |
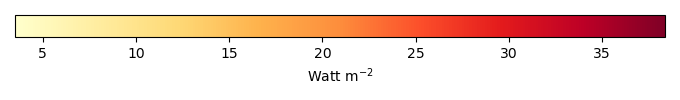
RMSE [Watt m-2] |
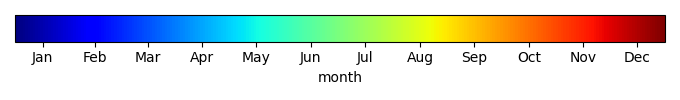
Phase Shift [months] |
Bias Score [1] |
RMSE Score [1] |
Seasonal Cycle Score [1] |
Spatial Distribution Score [1] |
Overall Score [1] |
|||
|---|---|---|---|---|---|---|---|---|---|---|---|---|---|---|---|---|
| Benchmark | [-] | 455. | ||||||||||||||
| h0 | [-] | 458. | 458. | 454. | 461. | 4.41 | 12.5 | 1.56 | 0.403 | 0.680 | 0.795 | 0.957 | 0.703 | |||
| h0a | [-] | 458. | 458. | 454. | 461. | 4.41 | 12.5 | 1.56 | 0.403 | 0.680 | 0.795 | 0.957 | 0.703 |
Download Data |
Period Mean (original grids) [Watt m-2] |
Model Period Mean (intersection) [Watt m-2] |
Benchmark Period Mean (intersection) [Watt m-2] |
Model Period Mean (complement) [Watt m-2] |
Benchmark Period Mean (complement) [Watt m-2] |
Bias [Watt m-2] |
RMSE [Watt m-2] |
Phase Shift [months] |
Bias Score [1] |
RMSE Score [1] |
Seasonal Cycle Score [1] |
Spatial Distribution Score [1] |
Overall Score [1] |
|||
|---|---|---|---|---|---|---|---|---|---|---|---|---|---|---|---|---|
| Benchmark | [-] | 473. | ||||||||||||||
| h0 | [-] | 474. | 475. | 473. | 457. | 1.60 | 19.0 | 0.711 | 0.459 | 0.312 | 0.942 | 0.969 | 0.599 | |||
| h0a | [-] | 474. | 475. | 473. | 457. | 1.60 | 19.0 | 0.711 | 0.459 | 0.312 | 0.942 | 0.969 | 0.599 |
Download Data |
Period Mean (original grids) [Watt m-2] |
Model Period Mean (intersection) [Watt m-2] |
Benchmark Period Mean (intersection) [Watt m-2] |
Model Period Mean (complement) [Watt m-2] |
Benchmark Period Mean (complement) [Watt m-2] |
Bias [Watt m-2] |
RMSE [Watt m-2] |
Phase Shift [months] |
Bias Score [1] |
RMSE Score [1] |
Seasonal Cycle Score [1] |
Spatial Distribution Score [1] |
Overall Score [1] |
|||
|---|---|---|---|---|---|---|---|---|---|---|---|---|---|---|---|---|
| Benchmark | [-] | 446. | ||||||||||||||
| h0 | [-] | 443. | 443. | 447. | 442. | -2.90 | 16.8 | 1.35 | 0.473 | 0.388 | 0.826 | 0.982 | 0.611 | |||
| h0a | [-] | 443. | 443. | 447. | 442. | -2.90 | 16.8 | 1.35 | 0.473 | 0.388 | 0.826 | 0.982 | 0.611 |
Download Data |
Period Mean (original grids) [Watt m-2] |
Model Period Mean (intersection) [Watt m-2] |
Benchmark Period Mean (intersection) [Watt m-2] |
Model Period Mean (complement) [Watt m-2] |
Benchmark Period Mean (complement) [Watt m-2] |
Bias [Watt m-2] |
RMSE [Watt m-2] |
Phase Shift [months] |
Bias Score [1] |
RMSE Score [1] |
Seasonal Cycle Score [1] |
Spatial Distribution Score [1] |
Overall Score [1] |
|||
|---|---|---|---|---|---|---|---|---|---|---|---|---|---|---|---|---|
| Benchmark | [-] | 277. | ||||||||||||||
| h0 | [-] | 270. | 270. | 276. | 289. | -3.31 | 14.3 | 0.0769 | 0.547 | 0.338 | 0.995 | 0.991 | 0.642 | |||
| h0a | [-] | 270. | 270. | 276. | 289. | -3.31 | 14.3 | 0.0769 | 0.547 | 0.338 | 0.995 | 0.991 | 0.642 |
Download Data |
Period Mean (original grids) [Watt m-2] |
Model Period Mean (intersection) [Watt m-2] |
Benchmark Period Mean (intersection) [Watt m-2] |
Model Period Mean (complement) [Watt m-2] |
Benchmark Period Mean (complement) [Watt m-2] |
Bias [Watt m-2] |
RMSE [Watt m-2] |
Phase Shift [months] |
Bias Score [1] |
RMSE Score [1] |
Seasonal Cycle Score [1] |
Spatial Distribution Score [1] |
Overall Score [1] |
|||
|---|---|---|---|---|---|---|---|---|---|---|---|---|---|---|---|---|
| Benchmark | [-] | 456. | ||||||||||||||
| h0 | [-] | 455. | 455. | 455. | 465. | 1.26 | 8.46 | 2.13 | 0.504 | 0.848 | 0.669 | 0.914 | 0.757 | |||
| h0a | [-] | 455. | 455. | 455. | 465. | 1.26 | 8.46 | 2.13 | 0.504 | 0.848 | 0.669 | 0.914 | 0.757 |
Download Data |
Period Mean (original grids) [Watt m-2] |
Model Period Mean (intersection) [Watt m-2] |
Benchmark Period Mean (intersection) [Watt m-2] |
Model Period Mean (complement) [Watt m-2] |
Benchmark Period Mean (complement) [Watt m-2] |
Bias [Watt m-2] |
RMSE [Watt m-2] |
Phase Shift [months] |
Bias Score [1] |
RMSE Score [1] |
Seasonal Cycle Score [1] |
Spatial Distribution Score [1] |
Overall Score [1] |
|||
|---|---|---|---|---|---|---|---|---|---|---|---|---|---|---|---|---|
| Benchmark | [-] | 307. | ||||||||||||||
| h0 | [-] | 309. | 309. | 307. | 327. | 3.14 | 11.2 | 0.0216 | 0.587 | 0.483 | 0.999 | 1.00 | 0.710 | |||
| h0a | [-] | 309. | 309. | 307. | 327. | 3.14 | 11.2 | 0.0216 | 0.587 | 0.483 | 0.999 | 1.00 | 0.710 |
Download Data |
Period Mean (original grids) [Watt m-2] |
Model Period Mean (intersection) [Watt m-2] |
Benchmark Period Mean (intersection) [Watt m-2] |
Model Period Mean (complement) [Watt m-2] |
Benchmark Period Mean (complement) [Watt m-2] |
Bias [Watt m-2] |
RMSE [Watt m-2] |
Phase Shift [months] |
Bias Score [1] |
RMSE Score [1] |
Seasonal Cycle Score [1] |
Spatial Distribution Score [1] |
Overall Score [1] |
|||
|---|---|---|---|---|---|---|---|---|---|---|---|---|---|---|---|---|
| Benchmark | [-] | 365. | ||||||||||||||
| h0 | [-] | 359. | 358. | 364. | 411. | -3.92 | 12.3 | 0.179 | 0.553 | 0.564 | 0.987 | 0.996 | 0.733 | |||
| h0a | [-] | 359. | 358. | 364. | 411. | -3.92 | 12.3 | 0.179 | 0.553 | 0.564 | 0.987 | 0.996 | 0.733 |
Download Data |
Period Mean (original grids) [Watt m-2] |
Model Period Mean (intersection) [Watt m-2] |
Benchmark Period Mean (intersection) [Watt m-2] |
Model Period Mean (complement) [Watt m-2] |
Benchmark Period Mean (complement) [Watt m-2] |
Bias [Watt m-2] |
RMSE [Watt m-2] |
Phase Shift [months] |
Bias Score [1] |
RMSE Score [1] |
Seasonal Cycle Score [1] |
Spatial Distribution Score [1] |
Overall Score [1] |
|||
|---|---|---|---|---|---|---|---|---|---|---|---|---|---|---|---|---|
| Benchmark | [-] | 451. | ||||||||||||||
| h0 | [-] | 449. | 449. | 451. | 462. | 0.613 | 15.3 | 0.705 | 0.489 | 0.427 | 0.938 | 0.996 | 0.656 | |||
| h0a | [-] | 449. | 449. | 451. | 462. | 0.613 | 15.3 | 0.705 | 0.489 | 0.427 | 0.938 | 0.996 | 0.656 |
Download Data |
Period Mean (original grids) [Watt m-2] |
Model Period Mean (intersection) [Watt m-2] |
Benchmark Period Mean (intersection) [Watt m-2] |
Model Period Mean (complement) [Watt m-2] |
Benchmark Period Mean (complement) [Watt m-2] |
Bias [Watt m-2] |
RMSE [Watt m-2] |
Phase Shift [months] |
Bias Score [1] |
RMSE Score [1] |
Seasonal Cycle Score [1] |
Spatial Distribution Score [1] |
Overall Score [1] |
|||
|---|---|---|---|---|---|---|---|---|---|---|---|---|---|---|---|---|
| Benchmark | [-] | 275. | ||||||||||||||
| h0 | [-] | 276. | 277. | 275. | 283. | 2.38 | 13.0 | 0.0819 | 0.620 | 0.367 | 0.994 | 0.987 | 0.667 | |||
| h0a | [-] | 276. | 277. | 275. | 283. | 2.38 | 13.0 | 0.0819 | 0.620 | 0.367 | 0.994 | 0.987 | 0.667 |
Download Data |
Period Mean (original grids) [Watt m-2] |
Model Period Mean (intersection) [Watt m-2] |
Benchmark Period Mean (intersection) [Watt m-2] |
Model Period Mean (complement) [Watt m-2] |
Benchmark Period Mean (complement) [Watt m-2] |
Bias [Watt m-2] |
RMSE [Watt m-2] |
Phase Shift [months] |
Bias Score [1] |
RMSE Score [1] |
Seasonal Cycle Score [1] |
Spatial Distribution Score [1] |
Overall Score [1] |
|||
|---|---|---|---|---|---|---|---|---|---|---|---|---|---|---|---|---|
| Benchmark | [-] | 449. | ||||||||||||||
| h0 | [-] | 443. | 443. | 450. | 424. | -9.49 | 15.9 | 0.487 | 0.421 | 0.587 | 0.956 | 0.999 | 0.710 | |||
| h0a | [-] | 443. | 443. | 450. | 424. | -9.49 | 15.9 | 0.487 | 0.421 | 0.587 | 0.956 | 0.999 | 0.710 |
Download Data |
Period Mean (original grids) [Watt m-2] |
Model Period Mean (intersection) [Watt m-2] |
Benchmark Period Mean (intersection) [Watt m-2] |
Model Period Mean (complement) [Watt m-2] |
Benchmark Period Mean (complement) [Watt m-2] |
Bias [Watt m-2] |
RMSE [Watt m-2] |
Phase Shift [months] |
Bias Score [1] |
RMSE Score [1] |
Seasonal Cycle Score [1] |
Spatial Distribution Score [1] |
Overall Score [1] |
|||
|---|---|---|---|---|---|---|---|---|---|---|---|---|---|---|---|---|
| Benchmark | [-] | 366. | ||||||||||||||
| h0 | [-] | 357. | 357. | 365. | 386. | -4.64 | 10.3 | 0.395 | 0.577 | 0.605 | 0.973 | 0.995 | 0.751 | |||
| h0a | [-] | 357. | 357. | 365. | 386. | -4.64 | 10.3 | 0.395 | 0.577 | 0.605 | 0.973 | 0.995 | 0.751 |
Download Data |
Period Mean (original grids) [Watt m-2] |
Model Period Mean (intersection) [Watt m-2] |
Benchmark Period Mean (intersection) [Watt m-2] |
Model Period Mean (complement) [Watt m-2] |
Benchmark Period Mean (complement) [Watt m-2] |
Bias [Watt m-2] |
RMSE [Watt m-2] |
Phase Shift [months] |
Bias Score [1] |
RMSE Score [1] |
Seasonal Cycle Score [1] |
Spatial Distribution Score [1] |
Overall Score [1] |
|||
|---|---|---|---|---|---|---|---|---|---|---|---|---|---|---|---|---|
| Benchmark | [-] | 380. | ||||||||||||||
| h0 | [-] | 374. | 374. | 379. | 406. | -2.61 | 14.0 | 0.573 | 0.470 | 0.547 | 0.936 | 1.00 | 0.700 | |||
| h0a | [-] | 374. | 374. | 379. | 406. | -2.61 | 14.0 | 0.573 | 0.470 | 0.547 | 0.936 | 1.00 | 0.700 |
Download Data |
Period Mean (original grids) [Watt m-2] |
Model Period Mean (intersection) [Watt m-2] |
Benchmark Period Mean (intersection) [Watt m-2] |
Model Period Mean (complement) [Watt m-2] |
Benchmark Period Mean (complement) [Watt m-2] |
Bias [Watt m-2] |
RMSE [Watt m-2] |
Phase Shift [months] |
Bias Score [1] |
RMSE Score [1] |
Seasonal Cycle Score [1] |
Spatial Distribution Score [1] |
Overall Score [1] |
|||
|---|---|---|---|---|---|---|---|---|---|---|---|---|---|---|---|---|
| Benchmark | [-] | 468. | ||||||||||||||
| h0 | [-] | 450. | 449. | 468. | 440. | -18.8 | 24.4 | 0.532 | 0.180 | 0.568 | 0.958 | 0.995 | 0.654 | |||
| h0a | [-] | 450. | 449. | 468. | 440. | -18.8 | 24.4 | 0.532 | 0.180 | 0.568 | 0.958 | 0.995 | 0.654 |
Download Data |
Period Mean (original grids) [Watt m-2] |
Model Period Mean (intersection) [Watt m-2] |
Benchmark Period Mean (intersection) [Watt m-2] |
Model Period Mean (complement) [Watt m-2] |
Benchmark Period Mean (complement) [Watt m-2] |
Bias [Watt m-2] |
RMSE [Watt m-2] |
Phase Shift [months] |
Bias Score [1] |
RMSE Score [1] |
Seasonal Cycle Score [1] |
Spatial Distribution Score [1] |
Overall Score [1] |
|||
|---|---|---|---|---|---|---|---|---|---|---|---|---|---|---|---|---|
| Benchmark | [-] | 279. | ||||||||||||||
| h0 | [-] | 278. | 278. | 279. | 287. | -0.912 | 11.1 | 0.121 | 0.622 | 0.489 | 0.992 | 0.996 | 0.718 | |||
| h0a | [-] | 278. | 278. | 279. | 287. | -0.912 | 11.1 | 0.121 | 0.622 | 0.489 | 0.992 | 0.996 | 0.718 |
Download Data |
Period Mean (original grids) [Watt m-2] |
Model Period Mean (intersection) [Watt m-2] |
Benchmark Period Mean (intersection) [Watt m-2] |
Model Period Mean (complement) [Watt m-2] |
Benchmark Period Mean (complement) [Watt m-2] |
Bias [Watt m-2] |
RMSE [Watt m-2] |
Phase Shift [months] |
Bias Score [1] |
RMSE Score [1] |
Seasonal Cycle Score [1] |
Spatial Distribution Score [1] |
Overall Score [1] |
|||
|---|---|---|---|---|---|---|---|---|---|---|---|---|---|---|---|---|
| Benchmark | [-] | 446. | ||||||||||||||
| h0 | [-] | 441. | 441. | 444. | 457. | 1.26 | 11.2 | 0.841 | 0.498 | 0.674 | 0.911 | 0.957 | 0.743 | |||
| h0a | [-] | 441. | 441. | 444. | 457. | 1.26 | 11.2 | 0.841 | 0.498 | 0.674 | 0.911 | 0.957 | 0.743 |
Download Data |
Period Mean (original grids) [Watt m-2] |
Model Period Mean (intersection) [Watt m-2] |
Benchmark Period Mean (intersection) [Watt m-2] |
Model Period Mean (complement) [Watt m-2] |
Benchmark Period Mean (complement) [Watt m-2] |
Bias [Watt m-2] |
RMSE [Watt m-2] |
Phase Shift [months] |
Bias Score [1] |
RMSE Score [1] |
Seasonal Cycle Score [1] |
Spatial Distribution Score [1] |
Overall Score [1] |
|||
|---|---|---|---|---|---|---|---|---|---|---|---|---|---|---|---|---|
| Benchmark | [-] | 387. | ||||||||||||||
| h0 | [-] | 386. | 386. | 385. | 424. | 3.78 | 8.73 | 0.256 | 0.603 | 0.644 | 0.983 | 0.999 | 0.775 | |||
| h0a | [-] | 386. | 386. | 385. | 424. | 3.78 | 8.73 | 0.256 | 0.603 | 0.644 | 0.983 | 0.999 | 0.775 |
Download Data |
Period Mean (original grids) [Watt m-2] |
Model Period Mean (intersection) [Watt m-2] |
Benchmark Period Mean (intersection) [Watt m-2] |
Model Period Mean (complement) [Watt m-2] |
Benchmark Period Mean (complement) [Watt m-2] |
Bias [Watt m-2] |
RMSE [Watt m-2] |
Phase Shift [months] |
Bias Score [1] |
RMSE Score [1] |
Seasonal Cycle Score [1] |
Spatial Distribution Score [1] |
Overall Score [1] |
|||
|---|---|---|---|---|---|---|---|---|---|---|---|---|---|---|---|---|
| Benchmark | [-] | 321. | ||||||||||||||
| h0 | [-] | 321. | 321. | 320. | 347. | 2.00 | 10.9 | 0.109 | 0.612 | 0.496 | 0.993 | 0.998 | 0.719 | |||
| h0a | [-] | 321. | 321. | 320. | 347. | 2.00 | 10.9 | 0.109 | 0.612 | 0.496 | 0.993 | 0.998 | 0.719 |
Download Data |
Period Mean (original grids) [Watt m-2] |
Model Period Mean (intersection) [Watt m-2] |
Benchmark Period Mean (intersection) [Watt m-2] |
Model Period Mean (complement) [Watt m-2] |
Benchmark Period Mean (complement) [Watt m-2] |
Bias [Watt m-2] |
RMSE [Watt m-2] |
Phase Shift [months] |
Bias Score [1] |
RMSE Score [1] |
Seasonal Cycle Score [1] |
Spatial Distribution Score [1] |
Overall Score [1] |
|||
|---|---|---|---|---|---|---|---|---|---|---|---|---|---|---|---|---|
| Benchmark | [-] | 380. | ||||||||||||||
| h0 | [-] | 375. | 376. | 380. | 379. | -3.92 | 15.5 | 0.125 | 0.528 | 0.423 | 0.992 | 0.985 | 0.670 | |||
| h0a | [-] | 375. | 376. | 380. | 379. | -3.92 | 15.5 | 0.125 | 0.528 | 0.423 | 0.992 | 0.985 | 0.670 |
Download Data |
Period Mean (original grids) [Watt m-2] |
Model Period Mean (intersection) [Watt m-2] |
Benchmark Period Mean (intersection) [Watt m-2] |
Model Period Mean (complement) [Watt m-2] |
Benchmark Period Mean (complement) [Watt m-2] |
Bias [Watt m-2] |
RMSE [Watt m-2] |
Phase Shift [months] |
Bias Score [1] |
RMSE Score [1] |
Seasonal Cycle Score [1] |
Spatial Distribution Score [1] |
Overall Score [1] |
|||
|---|---|---|---|---|---|---|---|---|---|---|---|---|---|---|---|---|
| Benchmark | [-] | 447. | ||||||||||||||
| h0 | [-] | 455. | 455. | 446. | 458. | 8.92 | 11.6 | 1.40 | 0.290 | 0.786 | 0.796 | 0.933 | 0.718 | |||
| h0a | [-] | 455. | 455. | 446. | 458. | 8.92 | 11.6 | 1.40 | 0.290 | 0.786 | 0.796 | 0.933 | 0.718 |
Download Data |
Period Mean (original grids) [Watt m-2] |
Model Period Mean (intersection) [Watt m-2] |
Benchmark Period Mean (intersection) [Watt m-2] |
Model Period Mean (complement) [Watt m-2] |
Benchmark Period Mean (complement) [Watt m-2] |
Bias [Watt m-2] |
RMSE [Watt m-2] |
Phase Shift [months] |
Bias Score [1] |
RMSE Score [1] |
Seasonal Cycle Score [1] |
Spatial Distribution Score [1] |
Overall Score [1] |
|||
|---|---|---|---|---|---|---|---|---|---|---|---|---|---|---|---|---|
| Benchmark | [-] | 442. | ||||||||||||||
| h0 | [-] | 442. | 442. | 442. | 431. | -0.566 | 10.1 | 0.973 | 0.534 | 0.644 | 0.870 | 0.996 | 0.737 | |||
| h0a | [-] | 442. | 442. | 442. | 431. | -0.566 | 10.1 | 0.973 | 0.534 | 0.644 | 0.870 | 0.996 | 0.737 |
Download Data |
Period Mean (original grids) [Watt m-2] |
Model Period Mean (intersection) [Watt m-2] |
Benchmark Period Mean (intersection) [Watt m-2] |
Model Period Mean (complement) [Watt m-2] |
Benchmark Period Mean (complement) [Watt m-2] |
Bias [Watt m-2] |
RMSE [Watt m-2] |
Phase Shift [months] |
Bias Score [1] |
RMSE Score [1] |
Seasonal Cycle Score [1] |
Spatial Distribution Score [1] |
Overall Score [1] |
|||
|---|---|---|---|---|---|---|---|---|---|---|---|---|---|---|---|---|
| Benchmark | [-] | 387. | ||||||||||||||
| h0 | [-] | 385. | 384. | 387. | 390. | -0.106 | 15.2 | 0.837 | 0.456 | 0.629 | 0.897 | 0.999 | 0.722 | |||
| h0a | [-] | 385. | 384. | 387. | 390. | -0.106 | 15.2 | 0.837 | 0.456 | 0.629 | 0.897 | 0.999 | 0.722 |
Temporally integrated period mean