LDF#
The output from the stand-alone LDF configuration is in the link below
Note that LDF is currently run by users. Temporarily, we suggest users walk through the following process:
Install LDF and activate cupid-analysis
Use the
CUPiD/helper_scripts/generate_ldf_config_file.pyscript to generate a LDF config file based on a CUPiD configuration file.cd CUPiD/examples/external_diag_packages../../helper_scripts/generate_ldf_config_file.py --cupid-config-loc . --ldf-template ../../externals/LDF/config_clm_unstructured_plots.yaml --out-file LDF_config.yaml
Run LDF with the newly created configuration file.
../../externals/LDF/run_adf_diag LDF_config.yaml
# Parameters
case_name = "ctsm5.4.004_bgc_f09_131_HIST"
base_case_name = "ctsm5.4.CMIP7_ciso_ctsm5.3.075_f09_124_HIST"
case_nickname = "131_HIST"
base_case_nickname = "124_HIST"
CESM_output_dir = "/glade/derecho/scratch/wwieder/archive"
start_date = "2000-01-01"
end_date = "2005-01-01"
climo_start_year = 2000
climo_end_year = 2004
base_start_date = "2000-01-01"
base_end_date = "2005-01-01"
base_climo_start_year = 2000
base_climo_end_year = 2004
obs_data_dir = (
    "/glade/campaign/cesm/development/cross-wg/diagnostic_framework/CUPiD_obs_data"
)
ts_dir = None
lc_kwargs = {"threads_per_worker": 1}
serial = False
ldf_root = "../../examples/land_only/LDF_output/"
key_plots = [
    "GPP_ANN_LatLon_Mean.png",
    "ELAI_ANN_LatLon_Mean.png",
    "RegionalClimo_Amazonia_RegionalClimo_Mean.png",
]
subset_kwargs = {}
product = (
    "/glade/work/wwieder/CUPiD/examples/land_only/computed_notebooks//lnd/LDF.ipynb"
)
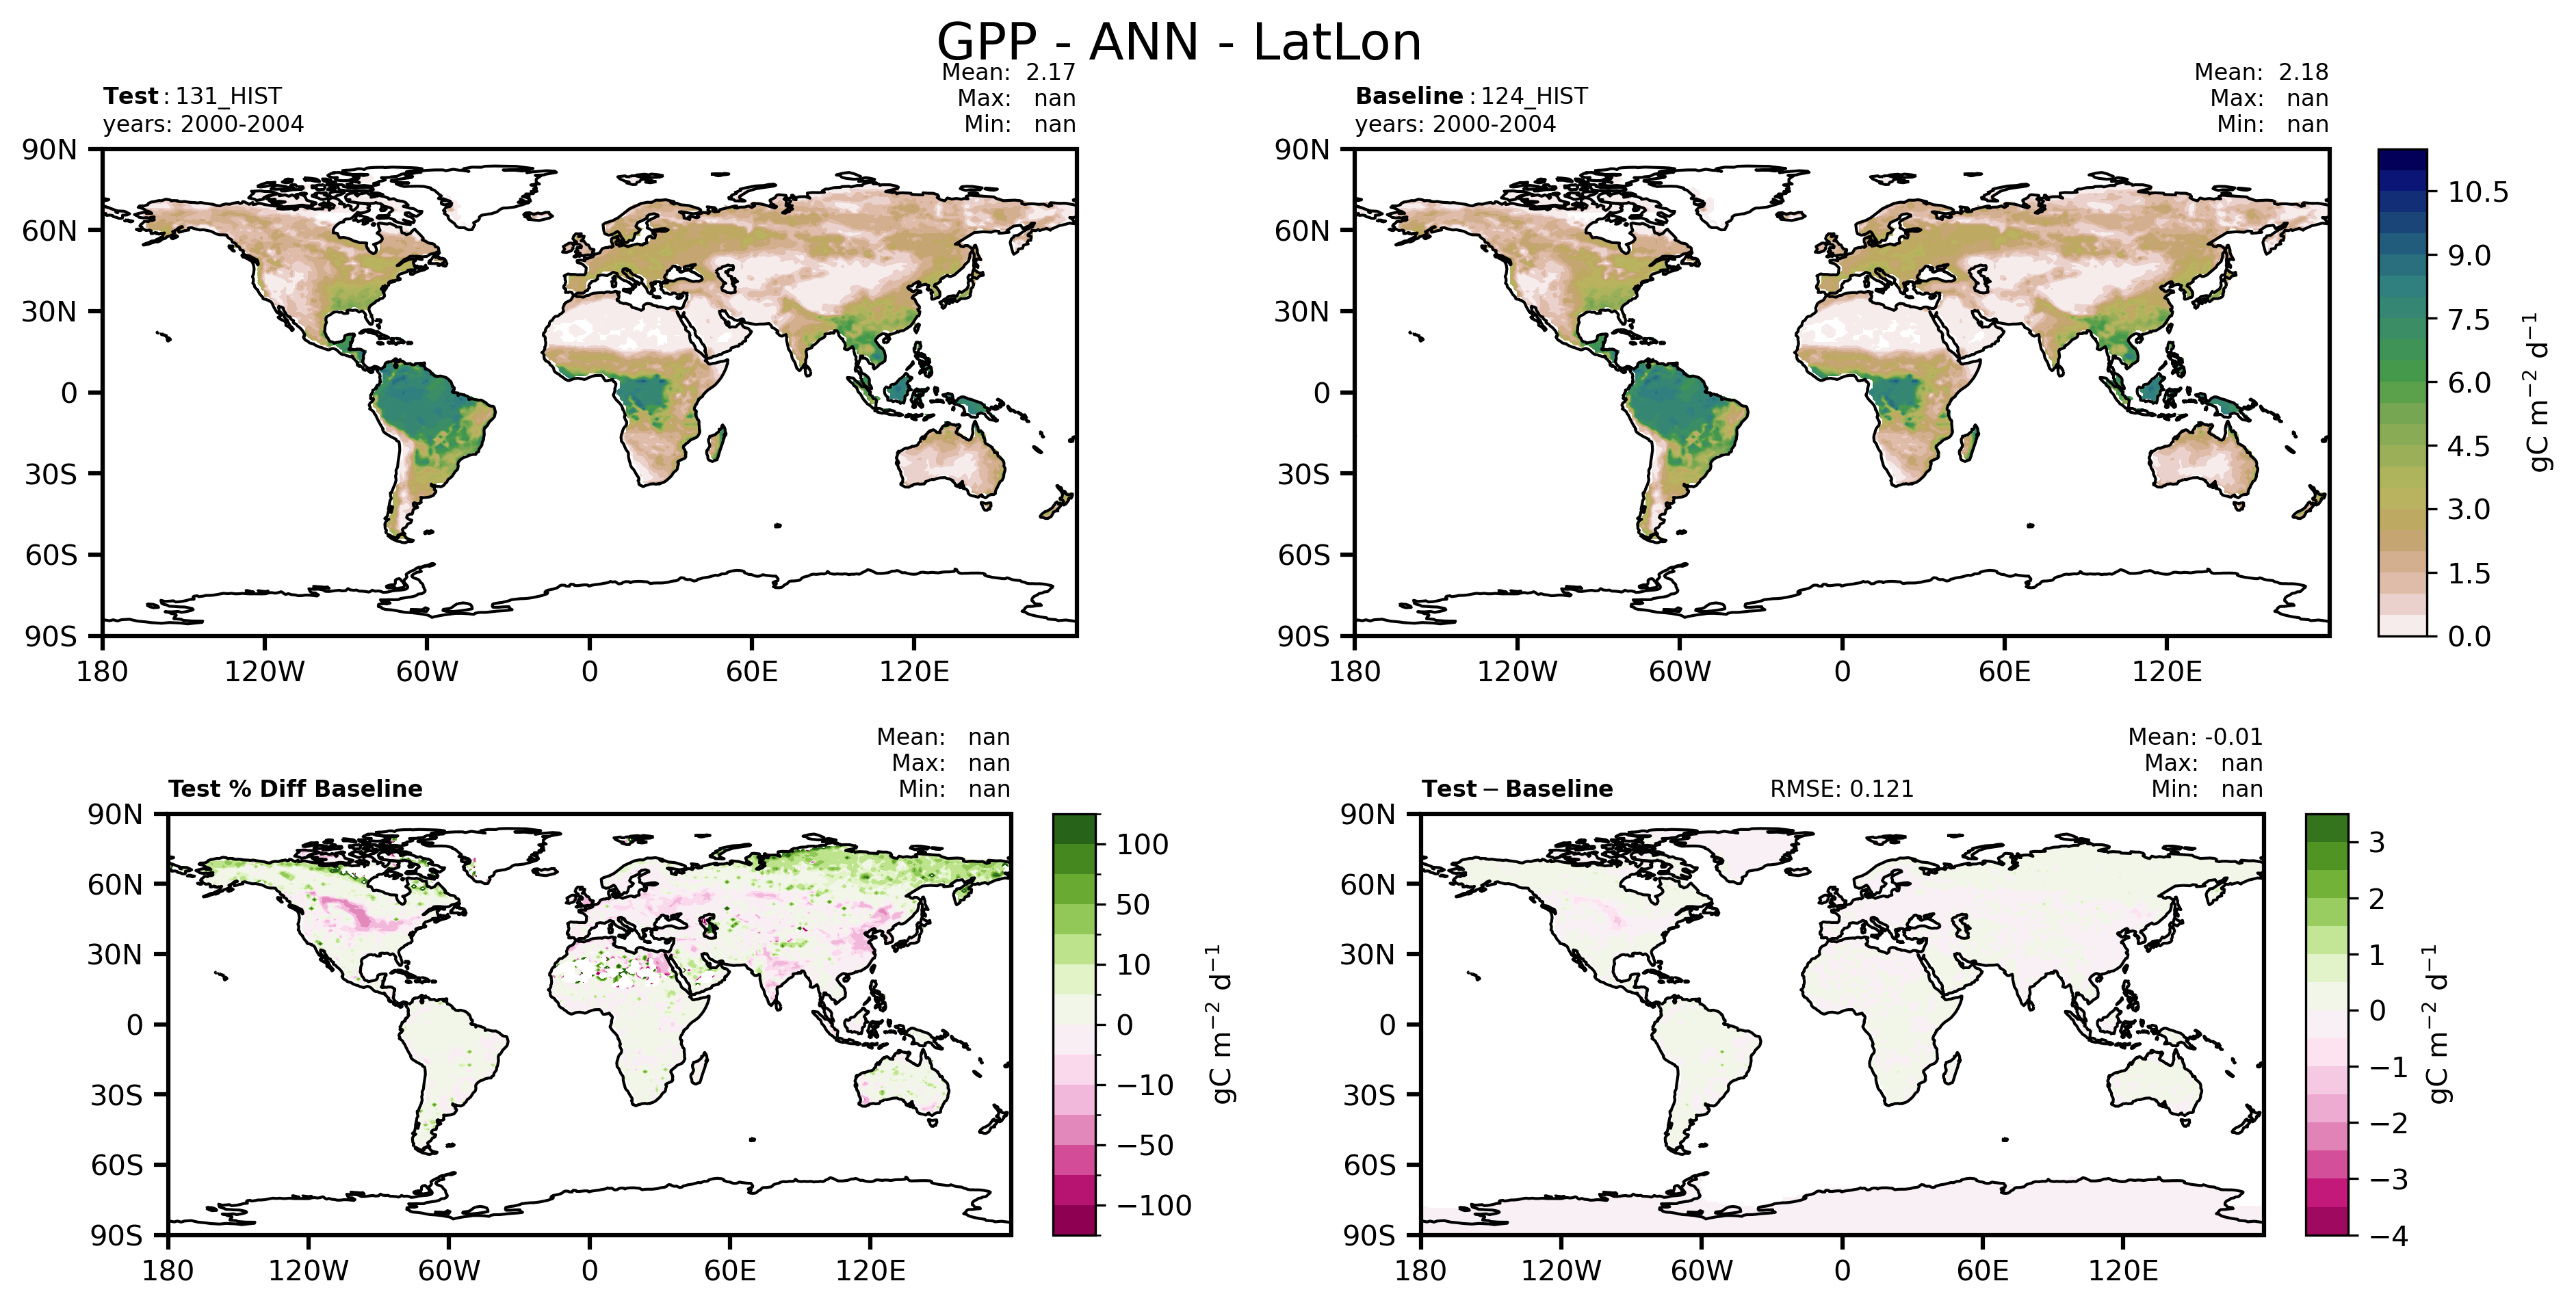
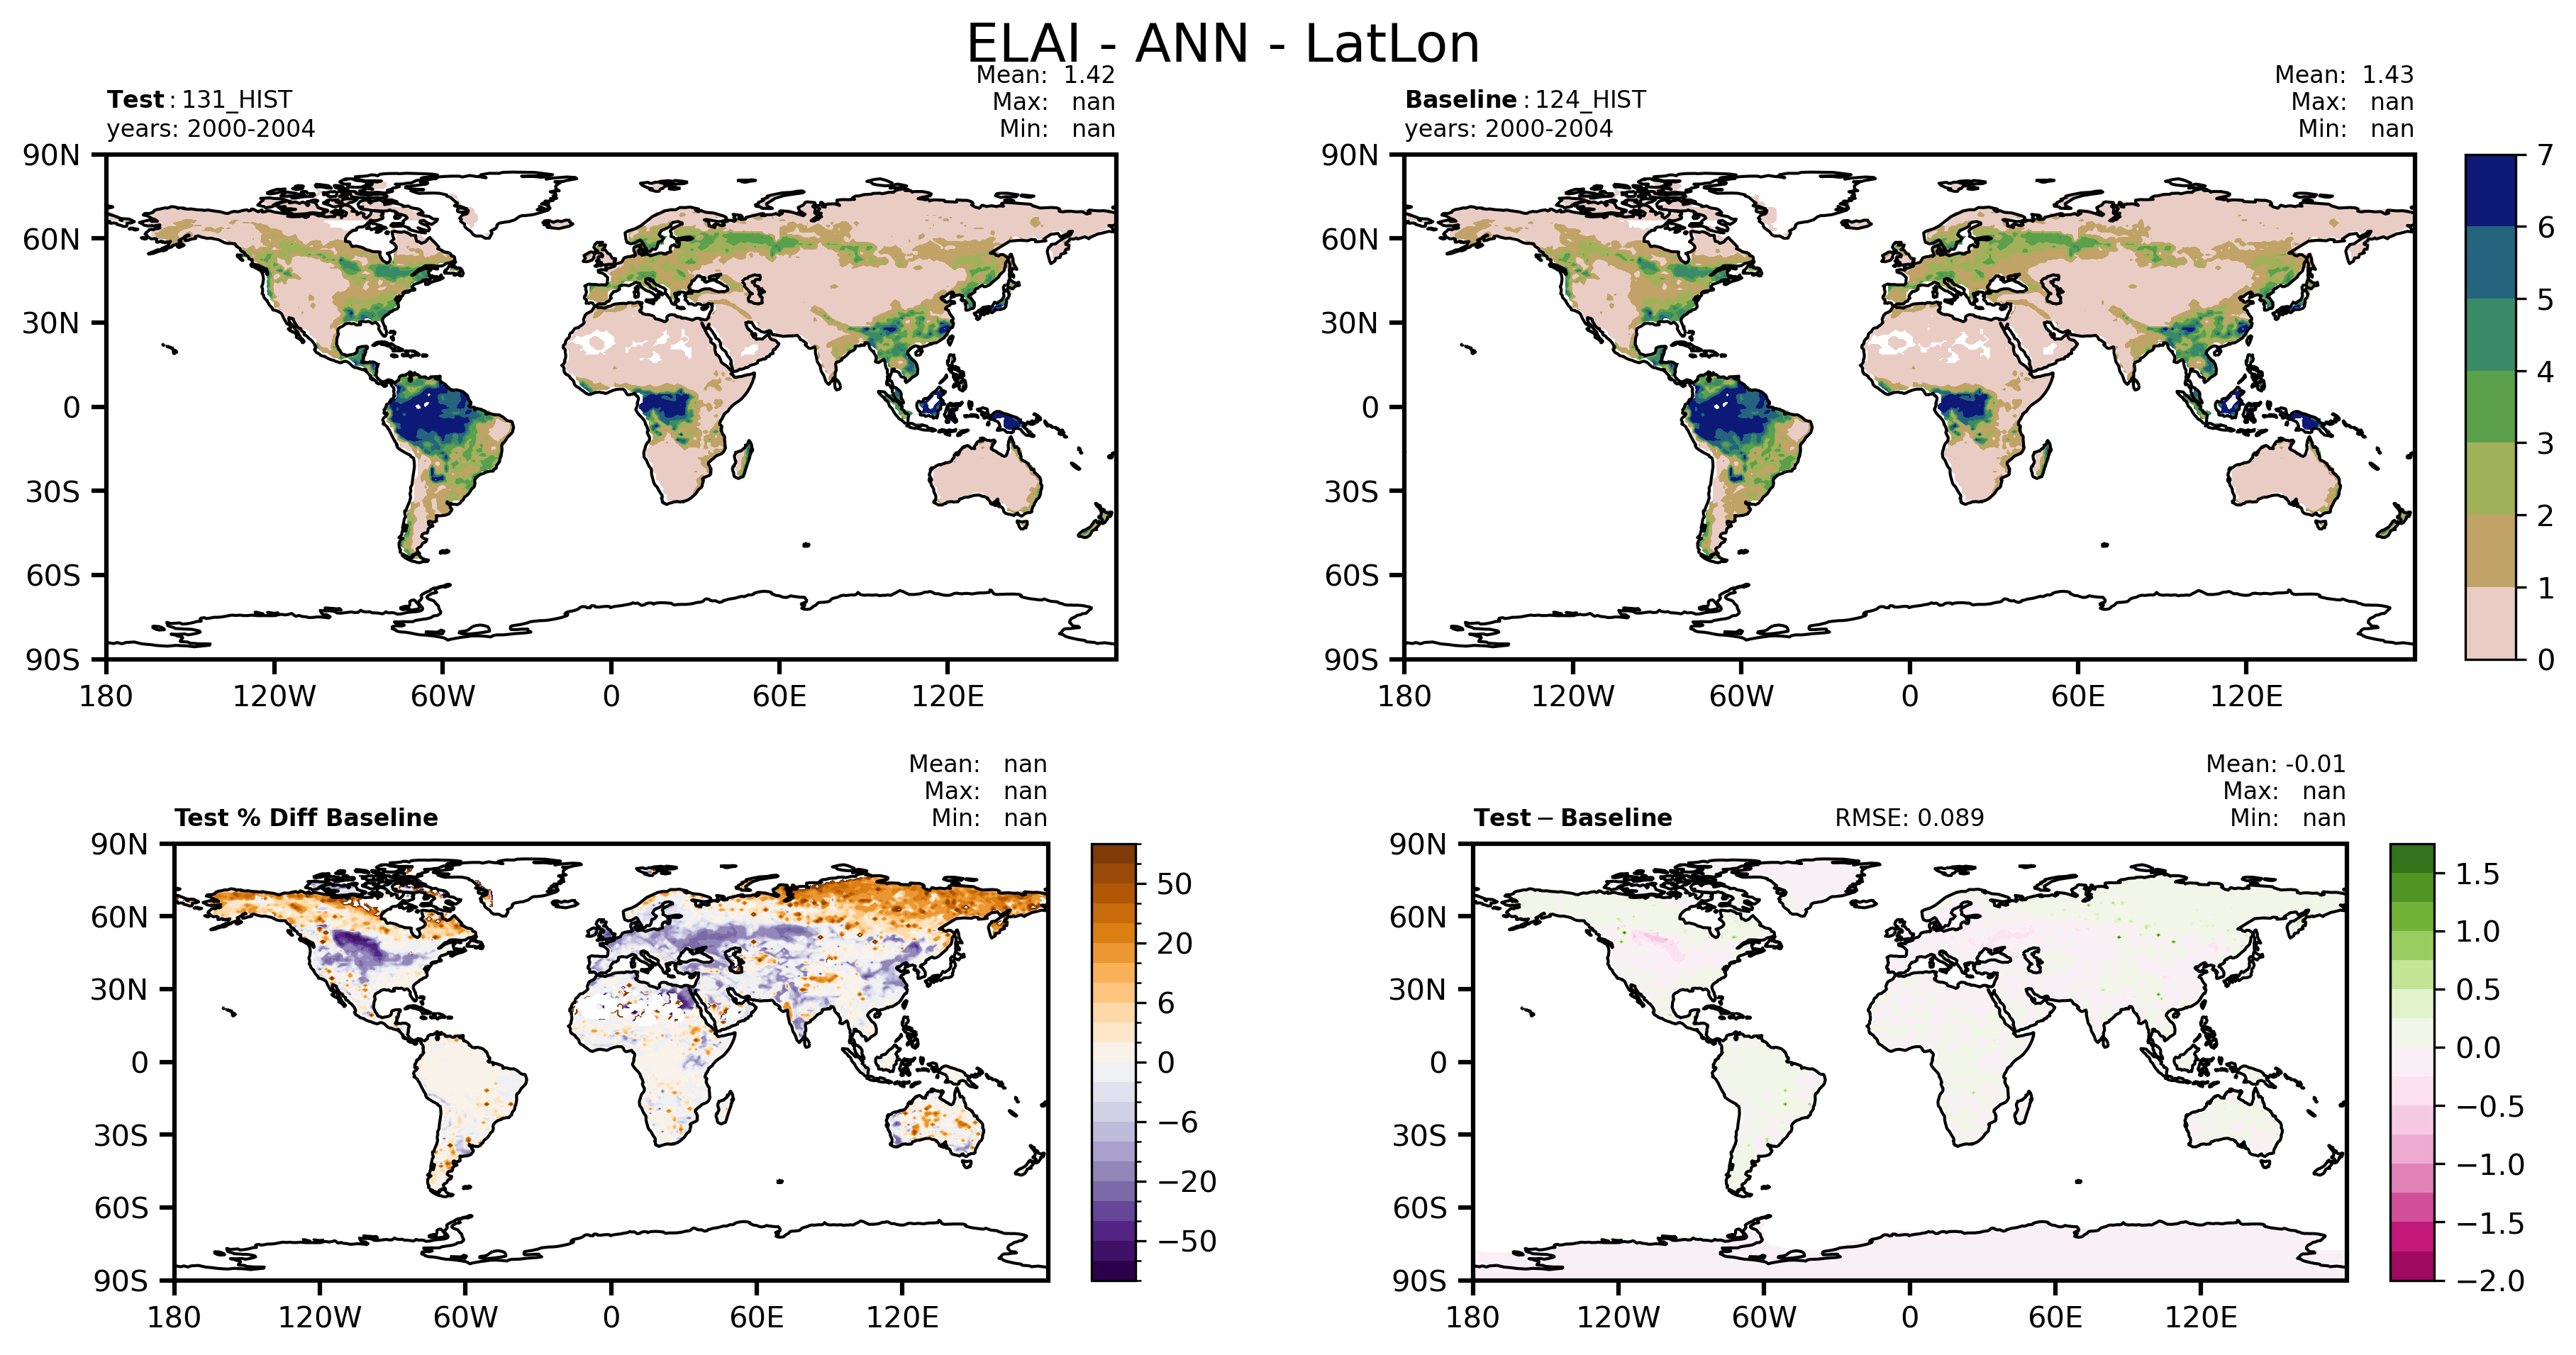
Key Metrics from LDF#
Some important things to look at from LDF include a comparison table and a few maps:
| variable | unit | test | control | diff |
|---|---|---|---|---|
| ELAI | m${-2}$ m${-2}$ | 1.426 | 1.435 | -0.009 |
| ET | W m$^{-2}$ | 34.001 | 34.033 | -0.032 |
| QRUNOFF_TO_COUPLER | mm d$^{-1}$ | 0.821 | 0.819 | 0.002 |
| GPP | PgC y$^{-1}$ | 118.09 | 118.647 | -0.557 |