Mean State
Download Data |
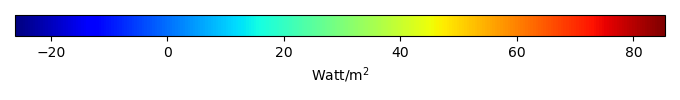
Period Mean (original grids) [Watt/m2] |
Model Period Mean (intersection) [Watt/m2] |
Benchmark Period Mean (intersection) [Watt/m2] |
Model Period Mean (complement) [Watt/m2] |
Benchmark Period Mean (complement) [Watt/m2] |
Bias [Watt/m2] |
RMSE [Watt/m2] |
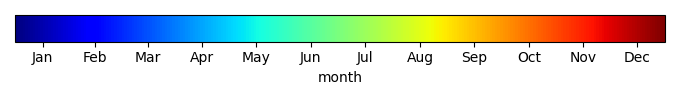
Phase Shift [months] |
Bias Score [1] |
RMSE Score [1] |
Seasonal Cycle Score [1] |
Spatial Distribution Score [1] |
Overall Score [1] |
|||
|---|---|---|---|---|---|---|---|---|---|---|---|---|---|---|---|---|
| Benchmark | [-] | 44.1 | ||||||||||||||
| CFORCEERA5 | [-] | 35.2 | 34.5 | 44.2 | 39.7 | 13.0 | -9.47 | 23.1 | 1.94 | 0.161 | 0.726 | 0.695 | 0.605 | 0.582 | ||
| CRUJRA2024 | [-] | 47.0 | 46.6 | 44.2 | 44.1 | 13.0 | 2.33 | 18.0 | 2.08 | 0.471 | 0.614 | 0.695 | 0.728 | 0.624 | ||
| GSWP3V1 | [-] | 36.5 | 36.1 | 44.2 | 44.4 | 13.0 | -7.64 | 19.2 | 1.58 | 0.301 | 0.690 | 0.757 | 0.755 | 0.639 | ||
| RAWERA5 | [-] | 38.3 | 37.9 | 44.2 | 40.9 | 13.0 | -6.12 | 18.1 | 1.50 | 0.300 | 0.689 | 0.776 | 0.771 | 0.645 |
Download Data |
Period Mean (original grids) [Watt/m2] |
Model Period Mean (intersection) [Watt/m2] |
Benchmark Period Mean (intersection) [Watt/m2] |
Model Period Mean (complement) [Watt/m2] |
Benchmark Period Mean (complement) [Watt/m2] |
Bias [Watt/m2] |
RMSE [Watt/m2] |
Phase Shift [months] |
Bias Score [1] |
RMSE Score [1] |
Seasonal Cycle Score [1] |
Spatial Distribution Score [1] |
Overall Score [1] |
|||
|---|---|---|---|---|---|---|---|---|---|---|---|---|---|---|---|---|
| Benchmark | [-] | 57.5 | ||||||||||||||
| CFORCEERA5 | [-] | 46.6 | 46.9 | 57.5 | 62.9 | 0.00 | -10.4 | 20.9 | 1.20 | 0.246 | 0.567 | 0.865 | 0.973 | 0.643 | ||
| CRUJRA2024 | [-] | 53.3 | 53.5 | 57.5 | 63.8 | 0.00 | -3.91 | 22.1 | 1.36 | 0.363 | 0.434 | 0.842 | 0.968 | 0.608 | ||
| GSWP3V1 | [-] | 49.8 | 50.0 | 57.5 | 59.5 | 0.00 | -7.42 | 18.4 | 0.623 | 0.341 | 0.585 | 0.949 | 0.926 | 0.677 | ||
| RAWERA5 | [-] | 53.9 | 54.3 | 57.5 | 61.6 | 0.00 | -3.02 | 16.5 | 1.06 | 0.511 | 0.563 | 0.887 | 0.980 | 0.701 |
Download Data |
Period Mean (original grids) [Watt/m2] |
Model Period Mean (intersection) [Watt/m2] |
Benchmark Period Mean (intersection) [Watt/m2] |
Model Period Mean (complement) [Watt/m2] |
Benchmark Period Mean (complement) [Watt/m2] |
Bias [Watt/m2] |
RMSE [Watt/m2] |
Phase Shift [months] |
Bias Score [1] |
RMSE Score [1] |
Seasonal Cycle Score [1] |
Spatial Distribution Score [1] |
Overall Score [1] |
|||
|---|---|---|---|---|---|---|---|---|---|---|---|---|---|---|---|---|
| Benchmark | [-] | 52.8 | ||||||||||||||
| CFORCEERA5 | [-] | 54.2 | 54.0 | 53.0 | 61.6 | 8.79 | 1.70 | 18.1 | 0.520 | 0.358 | 0.675 | 0.942 | 0.874 | 0.705 | ||
| CRUJRA2024 | [-] | 59.5 | 59.4 | 53.0 | 65.2 | 8.79 | 6.74 | 17.9 | 0.714 | 0.390 | 0.669 | 0.921 | 0.875 | 0.705 | ||
| GSWP3V1 | [-] | 56.2 | 56.1 | 53.0 | 60.6 | 8.79 | 3.49 | 17.0 | 0.399 | 0.444 | 0.647 | 0.962 | 0.908 | 0.722 | ||
| RAWERA5 | [-] | 57.4 | 57.3 | 53.0 | 61.1 | 8.79 | 4.77 | 16.7 | 0.407 | 0.458 | 0.654 | 0.961 | 0.898 | 0.725 |
Download Data |
Period Mean (original grids) [Watt/m2] |
Model Period Mean (intersection) [Watt/m2] |
Benchmark Period Mean (intersection) [Watt/m2] |
Model Period Mean (complement) [Watt/m2] |
Benchmark Period Mean (complement) [Watt/m2] |
Bias [Watt/m2] |
RMSE [Watt/m2] |
Phase Shift [months] |
Bias Score [1] |
RMSE Score [1] |
Seasonal Cycle Score [1] |
Spatial Distribution Score [1] |
Overall Score [1] |
|||
|---|---|---|---|---|---|---|---|---|---|---|---|---|---|---|---|---|
| Benchmark | [-] | 18.0 | ||||||||||||||
| CFORCEERA5 | [-] | 11.0 | 11.2 | 18.1 | 8.74 | 4.61 | -7.02 | 19.6 | 0.854 | 0.517 | 0.307 | 0.911 | 0.947 | 0.598 | ||
| CRUJRA2024 | [-] | 11.4 | 11.6 | 18.1 | 7.31 | 4.61 | -6.80 | 17.4 | 0.463 | 0.545 | 0.386 | 0.966 | 0.886 | 0.634 | ||
| GSWP3V1 | [-] | 16.9 | 17.1 | 18.1 | 11.3 | 4.61 | -1.37 | 18.4 | 0.685 | 0.645 | 0.318 | 0.933 | 0.948 | 0.632 | ||
| RAWERA5 | [-] | 10.6 | 10.7 | 18.1 | 7.39 | 4.61 | -7.56 | 17.7 | 0.523 | 0.502 | 0.394 | 0.960 | 0.897 | 0.629 |
Download Data |
Period Mean (original grids) [Watt/m2] |
Model Period Mean (intersection) [Watt/m2] |
Benchmark Period Mean (intersection) [Watt/m2] |
Model Period Mean (complement) [Watt/m2] |
Benchmark Period Mean (complement) [Watt/m2] |
Bias [Watt/m2] |
RMSE [Watt/m2] |
Phase Shift [months] |
Bias Score [1] |
RMSE Score [1] |
Seasonal Cycle Score [1] |
Spatial Distribution Score [1] |
Overall Score [1] |
|||
|---|---|---|---|---|---|---|---|---|---|---|---|---|---|---|---|---|
| Benchmark | [-] | 22.1 | ||||||||||||||
| CFORCEERA5 | [-] | 14.3 | 13.6 | 22.3 | 16.6 | 7.64 | -7.45 | 17.8 | 2.07 | 0.342 | 0.732 | 0.673 | 0.555 | 0.607 | ||
| CRUJRA2024 | [-] | 37.1 | 36.4 | 22.3 | 39.1 | 7.64 | 14.9 | 18.5 | 2.44 | 0.385 | 0.718 | 0.611 | 0.760 | 0.638 | ||
| GSWP3V1 | [-] | 13.0 | 11.2 | 22.3 | 21.3 | 7.64 | -7.88 | 18.9 | 1.46 | 0.299 | 0.766 | 0.786 | 0.572 | 0.638 | ||
| RAWERA5 | [-] | 17.8 | 17.6 | 22.3 | 18.0 | 7.64 | -4.15 | 15.5 | 1.53 | 0.442 | 0.741 | 0.771 | 0.611 | 0.661 |
Download Data |
Period Mean (original grids) [Watt/m2] |
Model Period Mean (intersection) [Watt/m2] |
Benchmark Period Mean (intersection) [Watt/m2] |
Model Period Mean (complement) [Watt/m2] |
Benchmark Period Mean (complement) [Watt/m2] |
Bias [Watt/m2] |
RMSE [Watt/m2] |
Phase Shift [months] |
Bias Score [1] |
RMSE Score [1] |
Seasonal Cycle Score [1] |
Spatial Distribution Score [1] |
Overall Score [1] |
|||
|---|---|---|---|---|---|---|---|---|---|---|---|---|---|---|---|---|
| Benchmark | [-] | 27.0 | ||||||||||||||
| CFORCEERA5 | [-] | 13.3 | 13.3 | 27.1 | 22.3 | 9.78 | -13.7 | 22.1 | 1.40 | 0.209 | 0.324 | 0.831 | 0.822 | 0.502 | ||
| CRUJRA2024 | [-] | 19.0 | 19.0 | 27.1 | 22.3 | 9.78 | -8.11 | 15.4 | 0.678 | 0.449 | 0.497 | 0.942 | 0.961 | 0.669 | ||
| GSWP3V1 | [-] | 24.1 | 24.2 | 27.1 | 30.9 | 9.78 | -2.83 | 12.7 | 0.483 | 0.587 | 0.561 | 0.958 | 0.857 | 0.705 | ||
| RAWERA5 | [-] | 13.9 | 13.9 | 27.1 | 24.2 | 9.78 | -13.1 | 18.3 | 0.600 | 0.191 | 0.497 | 0.950 | 0.962 | 0.619 |
Download Data |
Period Mean (original grids) [Watt/m2] |
Model Period Mean (intersection) [Watt/m2] |
Benchmark Period Mean (intersection) [Watt/m2] |
Model Period Mean (complement) [Watt/m2] |
Benchmark Period Mean (complement) [Watt/m2] |
Bias [Watt/m2] |
RMSE [Watt/m2] |
Phase Shift [months] |
Bias Score [1] |
RMSE Score [1] |
Seasonal Cycle Score [1] |
Spatial Distribution Score [1] |
Overall Score [1] |
|||
|---|---|---|---|---|---|---|---|---|---|---|---|---|---|---|---|---|
| Benchmark | [-] | 28.4 | ||||||||||||||
| CFORCEERA5 | [-] | 30.1 | 29.8 | 28.4 | 32.5 | 8.71 | 1.33 | 20.2 | 1.40 | 0.285 | 0.404 | 0.819 | 0.886 | 0.560 | ||
| CRUJRA2024 | [-] | 34.2 | 34.0 | 28.4 | 34.8 | 8.71 | 5.56 | 16.6 | 0.798 | 0.450 | 0.522 | 0.919 | 0.885 | 0.660 | ||
| GSWP3V1 | [-] | 34.7 | 34.7 | 28.4 | 32.8 | 8.71 | 6.31 | 17.4 | 0.867 | 0.411 | 0.507 | 0.896 | 0.940 | 0.652 | ||
| RAWERA5 | [-] | 31.8 | 31.5 | 28.4 | 34.0 | 8.71 | 3.03 | 17.0 | 0.926 | 0.391 | 0.495 | 0.894 | 0.933 | 0.642 |
Download Data |
Period Mean (original grids) [Watt/m2] |
Model Period Mean (intersection) [Watt/m2] |
Benchmark Period Mean (intersection) [Watt/m2] |
Model Period Mean (complement) [Watt/m2] |
Benchmark Period Mean (complement) [Watt/m2] |
Bias [Watt/m2] |
RMSE [Watt/m2] |
Phase Shift [months] |
Bias Score [1] |
RMSE Score [1] |
Seasonal Cycle Score [1] |
Spatial Distribution Score [1] |
Overall Score [1] |
|||
|---|---|---|---|---|---|---|---|---|---|---|---|---|---|---|---|---|
| Benchmark | [-] | 40.3 | ||||||||||||||
| CFORCEERA5 | [-] | 33.5 | 33.3 | 40.5 | 36.6 | 9.53 | -7.47 | 20.8 | 0.757 | 0.294 | 0.564 | 0.917 | 0.948 | 0.657 | ||
| CRUJRA2024 | [-] | 46.7 | 46.7 | 40.5 | 44.6 | 9.53 | 5.54 | 16.5 | 0.449 | 0.560 | 0.564 | 0.960 | 0.974 | 0.724 | ||
| GSWP3V1 | [-] | 34.4 | 34.2 | 40.5 | 36.2 | 9.53 | -6.53 | 18.6 | 0.423 | 0.359 | 0.619 | 0.964 | 0.942 | 0.700 | ||
| RAWERA5 | [-] | 39.4 | 39.4 | 40.5 | 39.5 | 9.53 | -1.70 | 16.6 | 0.413 | 0.486 | 0.594 | 0.961 | 0.966 | 0.720 |
Download Data |
Period Mean (original grids) [Watt/m2] |
Model Period Mean (intersection) [Watt/m2] |
Benchmark Period Mean (intersection) [Watt/m2] |
Model Period Mean (complement) [Watt/m2] |
Benchmark Period Mean (complement) [Watt/m2] |
Bias [Watt/m2] |
RMSE [Watt/m2] |
Phase Shift [months] |
Bias Score [1] |
RMSE Score [1] |
Seasonal Cycle Score [1] |
Spatial Distribution Score [1] |
Overall Score [1] |
|||
|---|---|---|---|---|---|---|---|---|---|---|---|---|---|---|---|---|
| Benchmark | [-] | 15.2 | ||||||||||||||
| CFORCEERA5 | [-] | 0.420 | 0.553 | 15.2 | 0.513 | 2.14 | -14.7 | 24.0 | 1.02 | 0.201 | 0.257 | 0.903 | 0.629 | 0.449 | ||
| CRUJRA2024 | [-] | 2.00 | 2.37 | 15.2 | -4.21 | 2.14 | -13.2 | 20.1 | 0.865 | 0.247 | 0.396 | 0.929 | 0.733 | 0.540 | ||
| GSWP3V1 | [-] | 7.40 | 7.73 | 15.2 | 2.44 | 2.14 | -7.73 | 19.4 | 1.17 | 0.501 | 0.308 | 0.870 | 0.914 | 0.580 | ||
| RAWERA5 | [-] | 2.93 | 3.17 | 15.2 | -1.68 | 2.14 | -12.3 | 20.4 | 1.19 | 0.278 | 0.353 | 0.865 | 0.781 | 0.526 |
Download Data |
Period Mean (original grids) [Watt/m2] |
Model Period Mean (intersection) [Watt/m2] |
Benchmark Period Mean (intersection) [Watt/m2] |
Model Period Mean (complement) [Watt/m2] |
Benchmark Period Mean (complement) [Watt/m2] |
Bias [Watt/m2] |
RMSE [Watt/m2] |
Phase Shift [months] |
Bias Score [1] |
RMSE Score [1] |
Seasonal Cycle Score [1] |
Spatial Distribution Score [1] |
Overall Score [1] |
|||
|---|---|---|---|---|---|---|---|---|---|---|---|---|---|---|---|---|
| Benchmark | [-] | 56.5 | ||||||||||||||
| CFORCEERA5 | [-] | 66.0 | 66.6 | 56.7 | 52.7 | 11.4 | 9.61 | 15.1 | 0.531 | 0.452 | 0.645 | 0.959 | 0.954 | 0.731 | ||
| CRUJRA2024 | [-] | 70.5 | 71.1 | 56.7 | 56.9 | 11.4 | 13.7 | 17.3 | 0.698 | 0.314 | 0.671 | 0.949 | 0.885 | 0.698 | ||
| GSWP3V1 | [-] | 62.1 | 62.7 | 56.7 | 50.9 | 11.4 | 5.62 | 13.1 | 0.425 | 0.512 | 0.685 | 0.970 | 0.917 | 0.754 | ||
| RAWERA5 | [-] | 64.8 | 65.7 | 56.7 | 47.5 | 11.4 | 8.36 | 15.3 | 0.485 | 0.489 | 0.572 | 0.966 | 0.958 | 0.711 |
Download Data |
Period Mean (original grids) [Watt/m2] |
Model Period Mean (intersection) [Watt/m2] |
Benchmark Period Mean (intersection) [Watt/m2] |
Model Period Mean (complement) [Watt/m2] |
Benchmark Period Mean (complement) [Watt/m2] |
Bias [Watt/m2] |
RMSE [Watt/m2] |
Phase Shift [months] |
Bias Score [1] |
RMSE Score [1] |
Seasonal Cycle Score [1] |
Spatial Distribution Score [1] |
Overall Score [1] |
|||
|---|---|---|---|---|---|---|---|---|---|---|---|---|---|---|---|---|
| Benchmark | [-] | 20.2 | ||||||||||||||
| CFORCEERA5 | [-] | 13.4 | 13.0 | 20.3 | 22.2 | 5.38 | -6.55 | 17.4 | 0.838 | 0.331 | 0.491 | 0.913 | 0.779 | 0.601 | ||
| CRUJRA2024 | [-] | 24.6 | 24.6 | 20.3 | 25.6 | 5.38 | 4.03 | 13.7 | 0.766 | 0.570 | 0.528 | 0.925 | 0.907 | 0.691 | ||
| GSWP3V1 | [-] | 18.2 | 17.8 | 20.3 | 27.9 | 5.38 | -1.52 | 14.9 | 0.942 | 0.450 | 0.531 | 0.898 | 0.803 | 0.642 | ||
| RAWERA5 | [-] | 16.2 | 16.0 | 20.3 | 22.4 | 5.38 | -4.09 | 15.3 | 0.984 | 0.443 | 0.535 | 0.883 | 0.813 | 0.642 |
Download Data |
Period Mean (original grids) [Watt/m2] |
Model Period Mean (intersection) [Watt/m2] |
Benchmark Period Mean (intersection) [Watt/m2] |
Model Period Mean (complement) [Watt/m2] |
Benchmark Period Mean (complement) [Watt/m2] |
Bias [Watt/m2] |
RMSE [Watt/m2] |
Phase Shift [months] |
Bias Score [1] |
RMSE Score [1] |
Seasonal Cycle Score [1] |
Spatial Distribution Score [1] |
Overall Score [1] |
|||
|---|---|---|---|---|---|---|---|---|---|---|---|---|---|---|---|---|
| Benchmark | [-] | 34.5 | ||||||||||||||
| CFORCEERA5 | [-] | 27.3 | 31.7 | 34.6 | 8.49 | 8.05 | -2.88 | 20.8 | 1.15 | 0.298 | 0.504 | 0.854 | 0.866 | 0.605 | ||
| CRUJRA2024 | [-] | 32.5 | 38.1 | 34.6 | 8.62 | 8.05 | 3.34 | 18.0 | 0.964 | 0.428 | 0.546 | 0.890 | 0.900 | 0.662 | ||
| GSWP3V1 | [-] | 29.8 | 35.0 | 34.6 | 7.78 | 8.05 | 0.355 | 18.3 | 0.843 | 0.425 | 0.545 | 0.903 | 0.919 | 0.667 | ||
| RAWERA5 | [-] | 29.2 | 34.5 | 34.6 | 6.50 | 8.05 | -0.229 | 18.2 | 0.833 | 0.393 | 0.546 | 0.906 | 0.887 | 0.656 |
Download Data |
Period Mean (original grids) [Watt/m2] |
Model Period Mean (intersection) [Watt/m2] |
Benchmark Period Mean (intersection) [Watt/m2] |
Model Period Mean (complement) [Watt/m2] |
Benchmark Period Mean (complement) [Watt/m2] |
Bias [Watt/m2] |
RMSE [Watt/m2] |
Phase Shift [months] |
Bias Score [1] |
RMSE Score [1] |
Seasonal Cycle Score [1] |
Spatial Distribution Score [1] |
Overall Score [1] |
|||
|---|---|---|---|---|---|---|---|---|---|---|---|---|---|---|---|---|
| Benchmark | [-] | 22.7 | ||||||||||||||
| CFORCEERA5 | [-] | 40.3 | 45.4 | 22.8 | 35.6 | 7.82 | 23.4 | 31.6 | 1.25 | 0.165 | 0.502 | 0.835 | 0.767 | 0.554 | ||
| CRUJRA2024 | [-] | 43.6 | 47.1 | 22.8 | 40.5 | 7.82 | 25.0 | 32.1 | 1.27 | 0.145 | 0.469 | 0.838 | 0.679 | 0.520 | ||
| GSWP3V1 | [-] | 40.5 | 44.3 | 22.8 | 36.9 | 7.82 | 22.3 | 31.5 | 1.20 | 0.152 | 0.435 | 0.845 | 0.747 | 0.523 | ||
| RAWERA5 | [-] | 44.9 | 48.4 | 22.8 | 41.8 | 7.82 | 26.0 | 33.1 | 1.32 | 0.173 | 0.466 | 0.828 | 0.617 | 0.510 |
Download Data |
Period Mean (original grids) [Watt/m2] |
Model Period Mean (intersection) [Watt/m2] |
Benchmark Period Mean (intersection) [Watt/m2] |
Model Period Mean (complement) [Watt/m2] |
Benchmark Period Mean (complement) [Watt/m2] |
Bias [Watt/m2] |
RMSE [Watt/m2] |
Phase Shift [months] |
Bias Score [1] |
RMSE Score [1] |
Seasonal Cycle Score [1] |
Spatial Distribution Score [1] |
Overall Score [1] |
|||
|---|---|---|---|---|---|---|---|---|---|---|---|---|---|---|---|---|
| Benchmark | [-] | 17.0 | ||||||||||||||
| CFORCEERA5 | [-] | 6.30 | 6.40 | 17.0 | 5.03 | 4.07 | -10.6 | 22.4 | 1.31 | 0.334 | 0.265 | 0.851 | 0.807 | 0.504 | ||
| CRUJRA2024 | [-] | 6.97 | 7.41 | 17.0 | -1.94 | 4.07 | -10.2 | 21.3 | 0.959 | 0.378 | 0.285 | 0.907 | 0.825 | 0.536 | ||
| GSWP3V1 | [-] | 11.6 | 12.0 | 17.0 | 4.52 | 4.07 | -5.50 | 19.9 | 1.11 | 0.546 | 0.274 | 0.888 | 0.934 | 0.583 | ||
| RAWERA5 | [-] | 6.23 | 6.44 | 17.0 | 2.21 | 4.07 | -10.7 | 21.9 | 1.17 | 0.338 | 0.275 | 0.876 | 0.858 | 0.524 |
Download Data |
Period Mean (original grids) [Watt/m2] |
Model Period Mean (intersection) [Watt/m2] |
Benchmark Period Mean (intersection) [Watt/m2] |
Model Period Mean (complement) [Watt/m2] |
Benchmark Period Mean (complement) [Watt/m2] |
Bias [Watt/m2] |
RMSE [Watt/m2] |
Phase Shift [months] |
Bias Score [1] |
RMSE Score [1] |
Seasonal Cycle Score [1] |
Spatial Distribution Score [1] |
Overall Score [1] |
|||
|---|---|---|---|---|---|---|---|---|---|---|---|---|---|---|---|---|
| Benchmark | [-] | 47.7 | ||||||||||||||
| CFORCEERA5 | [-] | 51.1 | 50.5 | 48.1 | 58.4 | 8.57 | 3.14 | 21.2 | 0.561 | 0.360 | 0.567 | 0.948 | 0.954 | 0.679 | ||
| CRUJRA2024 | [-] | 51.1 | 50.7 | 48.1 | 54.2 | 8.57 | 2.53 | 20.0 | 0.631 | 0.336 | 0.610 | 0.939 | 0.869 | 0.673 | ||
| GSWP3V1 | [-] | 46.5 | 46.3 | 48.1 | 50.2 | 8.57 | -1.78 | 21.9 | 0.511 | 0.349 | 0.545 | 0.949 | 0.954 | 0.668 | ||
| RAWERA5 | [-] | 54.0 | 53.7 | 48.1 | 57.1 | 8.57 | 5.82 | 20.1 | 0.417 | 0.399 | 0.576 | 0.961 | 0.962 | 0.695 |
Download Data |
Period Mean (original grids) [Watt/m2] |
Model Period Mean (intersection) [Watt/m2] |
Benchmark Period Mean (intersection) [Watt/m2] |
Model Period Mean (complement) [Watt/m2] |
Benchmark Period Mean (complement) [Watt/m2] |
Bias [Watt/m2] |
RMSE [Watt/m2] |
Phase Shift [months] |
Bias Score [1] |
RMSE Score [1] |
Seasonal Cycle Score [1] |
Spatial Distribution Score [1] |
Overall Score [1] |
|||
|---|---|---|---|---|---|---|---|---|---|---|---|---|---|---|---|---|
| Benchmark | [-] | 28.6 | ||||||||||||||
| CFORCEERA5 | [-] | 21.0 | 20.5 | 28.7 | 31.5 | 8.83 | -7.66 | 17.0 | 2.10 | 0.317 | 0.421 | 0.669 | 0.909 | 0.548 | ||
| CRUJRA2024 | [-] | 32.3 | 32.3 | 28.7 | 32.6 | 8.83 | 3.79 | 10.6 | 0.717 | 0.575 | 0.678 | 0.922 | 0.956 | 0.762 | ||
| GSWP3V1 | [-] | 26.4 | 26.2 | 28.7 | 31.5 | 8.83 | -2.32 | 14.6 | 1.12 | 0.595 | 0.433 | 0.861 | 0.953 | 0.655 | ||
| RAWERA5 | [-] | 26.5 | 26.2 | 28.7 | 32.6 | 8.83 | -2.18 | 10.9 | 0.956 | 0.592 | 0.622 | 0.885 | 0.976 | 0.739 |
Download Data |
Period Mean (original grids) [Watt/m2] |
Model Period Mean (intersection) [Watt/m2] |
Benchmark Period Mean (intersection) [Watt/m2] |
Model Period Mean (complement) [Watt/m2] |
Benchmark Period Mean (complement) [Watt/m2] |
Bias [Watt/m2] |
RMSE [Watt/m2] |
Phase Shift [months] |
Bias Score [1] |
RMSE Score [1] |
Seasonal Cycle Score [1] |
Spatial Distribution Score [1] |
Overall Score [1] |
|||
|---|---|---|---|---|---|---|---|---|---|---|---|---|---|---|---|---|
| Benchmark | [-] | 26.7 | ||||||||||||||
| CFORCEERA5 | [-] | 18.8 | 18.8 | 26.7 | 19.4 | 4.68 | -8.25 | 18.5 | 1.12 | 0.371 | 0.365 | 0.870 | 0.950 | 0.584 | ||
| CRUJRA2024 | [-] | 24.5 | 24.6 | 26.7 | 21.2 | 4.68 | -2.38 | 16.6 | 0.627 | 0.572 | 0.382 | 0.947 | 0.969 | 0.650 | ||
| GSWP3V1 | [-] | 25.1 | 25.1 | 26.7 | 24.7 | 4.68 | -1.81 | 15.3 | 0.600 | 0.631 | 0.409 | 0.945 | 0.961 | 0.671 | ||
| RAWERA5 | [-] | 20.1 | 20.0 | 26.7 | 21.3 | 4.68 | -6.94 | 15.8 | 0.588 | 0.416 | 0.484 | 0.949 | 0.946 | 0.656 |
Download Data |
Period Mean (original grids) [Watt/m2] |
Model Period Mean (intersection) [Watt/m2] |
Benchmark Period Mean (intersection) [Watt/m2] |
Model Period Mean (complement) [Watt/m2] |
Benchmark Period Mean (complement) [Watt/m2] |
Bias [Watt/m2] |
RMSE [Watt/m2] |
Phase Shift [months] |
Bias Score [1] |
RMSE Score [1] |
Seasonal Cycle Score [1] |
Spatial Distribution Score [1] |
Overall Score [1] |
|||
|---|---|---|---|---|---|---|---|---|---|---|---|---|---|---|---|---|
| Benchmark | [-] | 49.7 | ||||||||||||||
| CFORCEERA5 | [-] | 40.9 | 40.7 | 49.7 | 61.1 | 13.0 | -8.99 | 15.9 | 0.831 | 0.369 | 0.497 | 0.921 | 0.934 | 0.644 | ||
| CRUJRA2024 | [-] | 41.4 | 41.5 | 49.7 | 53.4 | 13.0 | -8.28 | 14.8 | 0.599 | 0.410 | 0.598 | 0.935 | 0.861 | 0.680 | ||
| GSWP3V1 | [-] | 46.0 | 45.7 | 49.7 | 65.6 | 13.0 | -4.09 | 14.5 | 0.889 | 0.484 | 0.540 | 0.907 | 0.919 | 0.678 | ||
| RAWERA5 | [-] | 45.5 | 45.3 | 49.7 | 67.2 | 13.0 | -4.34 | 12.1 | 0.850 | 0.522 | 0.613 | 0.915 | 0.951 | 0.723 |
Download Data |
Period Mean (original grids) [Watt/m2] |
Model Period Mean (intersection) [Watt/m2] |
Benchmark Period Mean (intersection) [Watt/m2] |
Model Period Mean (complement) [Watt/m2] |
Benchmark Period Mean (complement) [Watt/m2] |
Bias [Watt/m2] |
RMSE [Watt/m2] |
Phase Shift [months] |
Bias Score [1] |
RMSE Score [1] |
Seasonal Cycle Score [1] |
Spatial Distribution Score [1] |
Overall Score [1] |
|||
|---|---|---|---|---|---|---|---|---|---|---|---|---|---|---|---|---|
| Benchmark | [-] | 30.2 | ||||||||||||||
| CFORCEERA5 | [-] | 15.5 | 15.4 | 30.2 | 25.4 | 12.7 | -14.2 | 20.9 | 1.88 | 0.202 | 0.708 | 0.704 | 0.446 | 0.554 | ||
| CRUJRA2024 | [-] | 29.2 | 29.2 | 30.2 | 35.0 | 12.7 | -0.690 | 12.1 | 1.78 | 0.593 | 0.739 | 0.740 | 0.668 | 0.696 | ||
| GSWP3V1 | [-] | 15.3 | 15.2 | 30.2 | 33.2 | 12.7 | -14.1 | 20.8 | 1.53 | 0.225 | 0.738 | 0.782 | 0.405 | 0.578 | ||
| RAWERA5 | [-] | 20.5 | 20.5 | 30.2 | 23.4 | 12.7 | -9.23 | 16.6 | 0.963 | 0.373 | 0.738 | 0.871 | 0.549 | 0.654 |
Download Data |
Period Mean (original grids) [Watt/m2] |
Model Period Mean (intersection) [Watt/m2] |
Benchmark Period Mean (intersection) [Watt/m2] |
Model Period Mean (complement) [Watt/m2] |
Benchmark Period Mean (complement) [Watt/m2] |
Bias [Watt/m2] |
RMSE [Watt/m2] |
Phase Shift [months] |
Bias Score [1] |
RMSE Score [1] |
Seasonal Cycle Score [1] |
Spatial Distribution Score [1] |
Overall Score [1] |
|||
|---|---|---|---|---|---|---|---|---|---|---|---|---|---|---|---|---|
| Benchmark | [-] | 40.3 | ||||||||||||||
| CFORCEERA5 | [-] | 37.6 | 37.8 | 40.3 | 39.4 | 9.32 | -2.37 | 19.4 | 0.660 | 0.342 | 0.644 | 0.932 | 0.474 | 0.607 | ||
| CRUJRA2024 | [-] | 46.1 | 46.3 | 40.3 | 40.5 | 9.32 | 5.82 | 13.4 | 1.07 | 0.523 | 0.686 | 0.874 | 0.815 | 0.717 | ||
| GSWP3V1 | [-] | 43.0 | 43.4 | 40.3 | 38.3 | 9.32 | 3.01 | 14.5 | 0.810 | 0.534 | 0.656 | 0.910 | 0.686 | 0.688 | ||
| RAWERA5 | [-] | 40.8 | 41.1 | 40.3 | 40.6 | 9.32 | 0.842 | 15.6 | 0.545 | 0.462 | 0.683 | 0.952 | 0.614 | 0.679 |
Download Data |
Period Mean (original grids) [Watt/m2] |
Model Period Mean (intersection) [Watt/m2] |
Benchmark Period Mean (intersection) [Watt/m2] |
Model Period Mean (complement) [Watt/m2] |
Benchmark Period Mean (complement) [Watt/m2] |
Bias [Watt/m2] |
RMSE [Watt/m2] |
Phase Shift [months] |
Bias Score [1] |
RMSE Score [1] |
Seasonal Cycle Score [1] |
Spatial Distribution Score [1] |
Overall Score [1] |
|||
|---|---|---|---|---|---|---|---|---|---|---|---|---|---|---|---|---|
| Benchmark | [-] | 41.5 | ||||||||||||||
| CFORCEERA5 | [-] | 57.2 | 56.4 | 41.7 | 65.9 | 7.73 | 14.6 | 30.6 | 0.446 | 0.245 | 0.406 | 0.957 | 0.882 | 0.579 | ||
| CRUJRA2024 | [-] | 60.0 | 59.3 | 41.7 | 70.2 | 7.73 | 18.3 | 29.8 | 0.836 | 0.234 | 0.402 | 0.923 | 0.910 | 0.574 | ||
| GSWP3V1 | [-] | 63.3 | 62.5 | 41.7 | 67.4 | 7.73 | 20.1 | 32.1 | 0.543 | 0.221 | 0.425 | 0.953 | 0.867 | 0.578 | ||
| RAWERA5 | [-] | 61.1 | 60.2 | 41.7 | 70.7 | 7.73 | 18.3 | 31.0 | 0.434 | 0.221 | 0.364 | 0.960 | 0.917 | 0.565 |
Temporally integrated period mean