Mean State
Download Data |
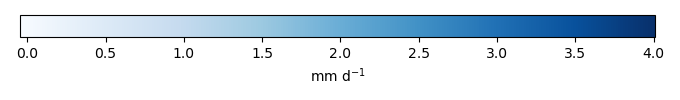
Period Mean (original grids) [mm d-1] |
Model Period Mean (intersection) [mm d-1] |
Benchmark Period Mean (intersection) [mm d-1] |
Model Period Mean (complement) [mm d-1] |
Benchmark Period Mean (complement) [mm d-1] |
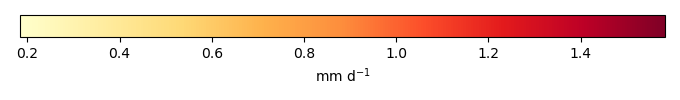
Bias [mm d-1] |
RMSE [mm d-1] |
Phase Shift [months] |
Bias Score [1] |
RMSE Score [1] |
Seasonal Cycle Score [1] |
Spatial Distribution Score [1] |
Overall Score [1] |
|||
|---|---|---|---|---|---|---|---|---|---|---|---|---|---|---|---|---|
| Benchmark | [-] | 2.48 | ||||||||||||||
| Control | [-] | 2.55 | 2.60 | 2.48 | 1.72 | 0.262 | 0.0996 | 0.642 | 3.02 | 0.601 | 0.654 | 0.492 | 0.983 | 0.677 | ||
| Dew | [-] | 2.55 | 2.60 | 2.48 | 1.72 | 0.262 | 0.0997 | 0.642 | 3.02 | 0.601 | 0.654 | 0.492 | 0.983 | 0.677 |
Download Data |
Period Mean (original grids) [mm d-1] |
Model Period Mean (intersection) [mm d-1] |
Benchmark Period Mean (intersection) [mm d-1] |
Model Period Mean (complement) [mm d-1] |
Benchmark Period Mean (complement) [mm d-1] |
Bias [mm d-1] |
RMSE [mm d-1] |
Phase Shift [months] |
Bias Score [1] |
RMSE Score [1] |
Seasonal Cycle Score [1] |
Spatial Distribution Score [1] |
Overall Score [1] |
|||
|---|---|---|---|---|---|---|---|---|---|---|---|---|---|---|---|---|
| Benchmark | [-] | 1.21 | ||||||||||||||
| Control | [-] | 1.93 | 1.95 | 1.21 | 0.727 | 2.75 | 0.737 | 1.00 | 0.826 | 0.238 | 0.585 | 0.905 | 0.916 | 0.646 | ||
| Dew | [-] | 1.93 | 1.95 | 1.21 | 0.727 | 2.75 | 0.737 | 1.00 | 0.826 | 0.238 | 0.585 | 0.905 | 0.916 | 0.646 |
Download Data |
Period Mean (original grids) [mm d-1] |
Model Period Mean (intersection) [mm d-1] |
Benchmark Period Mean (intersection) [mm d-1] |
Model Period Mean (complement) [mm d-1] |
Benchmark Period Mean (complement) [mm d-1] |
Bias [mm d-1] |
RMSE [mm d-1] |
Phase Shift [months] |
Bias Score [1] |
RMSE Score [1] |
Seasonal Cycle Score [1] |
Spatial Distribution Score [1] |
Overall Score [1] |
|||
|---|---|---|---|---|---|---|---|---|---|---|---|---|---|---|---|---|
| Benchmark | [-] | 1.66 | ||||||||||||||
| Control | [-] | 1.87 | 1.86 | 1.66 | 1.85 | 2.12 | 0.213 | 0.659 | 1.18 | 0.537 | 0.622 | 0.860 | 0.959 | 0.720 | ||
| Dew | [-] | 1.87 | 1.86 | 1.66 | 1.85 | 2.12 | 0.213 | 0.659 | 1.18 | 0.537 | 0.622 | 0.860 | 0.959 | 0.720 |
Download Data |
Period Mean (original grids) [mm d-1] |
Model Period Mean (intersection) [mm d-1] |
Benchmark Period Mean (intersection) [mm d-1] |
Model Period Mean (complement) [mm d-1] |
Benchmark Period Mean (complement) [mm d-1] |
Bias [mm d-1] |
RMSE [mm d-1] |
Phase Shift [months] |
Bias Score [1] |
RMSE Score [1] |
Seasonal Cycle Score [1] |
Spatial Distribution Score [1] |
Overall Score [1] |
|||
|---|---|---|---|---|---|---|---|---|---|---|---|---|---|---|---|---|
| Benchmark | [-] | 0.854 | ||||||||||||||
| Control | [-] | 0.444 | 0.445 | 0.854 | 0.421 | 0.929 | -0.408 | 0.510 | 0.321 | 0.0283 | 0.383 | 0.978 | 0.803 | 0.515 | ||
| Dew | [-] | 0.444 | 0.445 | 0.854 | 0.422 | 0.929 | -0.408 | 0.510 | 0.319 | 0.0283 | 0.382 | 0.978 | 0.803 | 0.515 |
Download Data |
Period Mean (original grids) [mm d-1] |
Model Period Mean (intersection) [mm d-1] |
Benchmark Period Mean (intersection) [mm d-1] |
Model Period Mean (complement) [mm d-1] |
Benchmark Period Mean (complement) [mm d-1] |
Bias [mm d-1] |
RMSE [mm d-1] |
Phase Shift [months] |
Bias Score [1] |
RMSE Score [1] |
Seasonal Cycle Score [1] |
Spatial Distribution Score [1] |
Overall Score [1] |
|||
|---|---|---|---|---|---|---|---|---|---|---|---|---|---|---|---|---|
| Benchmark | [-] | 3.76 | ||||||||||||||
| Control | [-] | 3.79 | 3.79 | 3.76 | 3.82 | 4.01 | 0.0359 | 0.478 | 2.93 | 0.629 | 0.717 | 0.527 | 0.861 | 0.690 | ||
| Dew | [-] | 3.79 | 3.79 | 3.76 | 3.82 | 4.01 | 0.0359 | 0.478 | 2.93 | 0.629 | 0.717 | 0.527 | 0.861 | 0.690 |
Download Data |
Period Mean (original grids) [mm d-1] |
Model Period Mean (intersection) [mm d-1] |
Benchmark Period Mean (intersection) [mm d-1] |
Model Period Mean (complement) [mm d-1] |
Benchmark Period Mean (complement) [mm d-1] |
Bias [mm d-1] |
RMSE [mm d-1] |
Phase Shift [months] |
Bias Score [1] |
RMSE Score [1] |
Seasonal Cycle Score [1] |
Spatial Distribution Score [1] |
Overall Score [1] |
|||
|---|---|---|---|---|---|---|---|---|---|---|---|---|---|---|---|---|
| Benchmark | [-] | 1.12 | ||||||||||||||
| Control | [-] | 0.806 | 0.802 | 1.11 | 0.848 | 1.33 | -0.313 | 0.527 | 0.717 | 0.201 | 0.303 | 0.947 | 0.932 | 0.537 | ||
| Dew | [-] | 0.806 | 0.802 | 1.11 | 0.848 | 1.33 | -0.313 | 0.527 | 0.716 | 0.201 | 0.303 | 0.947 | 0.932 | 0.537 |
Download Data |
Period Mean (original grids) [mm d-1] |
Model Period Mean (intersection) [mm d-1] |
Benchmark Period Mean (intersection) [mm d-1] |
Model Period Mean (complement) [mm d-1] |
Benchmark Period Mean (complement) [mm d-1] |
Bias [mm d-1] |
RMSE [mm d-1] |
Phase Shift [months] |
Bias Score [1] |
RMSE Score [1] |
Seasonal Cycle Score [1] |
Spatial Distribution Score [1] |
Overall Score [1] |
|||
|---|---|---|---|---|---|---|---|---|---|---|---|---|---|---|---|---|
| Benchmark | [-] | 1.17 | ||||||||||||||
| Control | [-] | 0.953 | 1.04 | 1.17 | 0.570 | 2.42 | -0.115 | 0.641 | 1.26 | 0.545 | 0.373 | 0.816 | 0.913 | 0.604 | ||
| Dew | [-] | 0.953 | 1.04 | 1.17 | 0.570 | 2.42 | -0.115 | 0.641 | 1.26 | 0.545 | 0.373 | 0.816 | 0.913 | 0.604 |
Download Data |
Period Mean (original grids) [mm d-1] |
Model Period Mean (intersection) [mm d-1] |
Benchmark Period Mean (intersection) [mm d-1] |
Model Period Mean (complement) [mm d-1] |
Benchmark Period Mean (complement) [mm d-1] |
Bias [mm d-1] |
RMSE [mm d-1] |
Phase Shift [months] |
Bias Score [1] |
RMSE Score [1] |
Seasonal Cycle Score [1] |
Spatial Distribution Score [1] |
Overall Score [1] |
|||
|---|---|---|---|---|---|---|---|---|---|---|---|---|---|---|---|---|
| Benchmark | [-] | 2.11 | ||||||||||||||
| Control | [-] | 2.07 | 2.15 | 2.10 | 1.52 | 3.41 | 0.102 | 0.701 | 1.56 | 0.508 | 0.606 | 0.783 | 0.921 | 0.685 | ||
| Dew | [-] | 2.07 | 2.15 | 2.10 | 1.52 | 3.41 | 0.102 | 0.701 | 1.56 | 0.508 | 0.606 | 0.783 | 0.921 | 0.685 |
Download Data |
Period Mean (original grids) [mm d-1] |
Model Period Mean (intersection) [mm d-1] |
Benchmark Period Mean (intersection) [mm d-1] |
Model Period Mean (complement) [mm d-1] |
Benchmark Period Mean (complement) [mm d-1] |
Bias [mm d-1] |
RMSE [mm d-1] |
Phase Shift [months] |
Bias Score [1] |
RMSE Score [1] |
Seasonal Cycle Score [1] |
Spatial Distribution Score [1] |
Overall Score [1] |
|||
|---|---|---|---|---|---|---|---|---|---|---|---|---|---|---|---|---|
| Benchmark | [-] | 0.786 | ||||||||||||||
| Control | [-] | 0.502 | 0.522 | 0.786 | 0.328 | 0.867 | -0.264 | 0.423 | 0.575 | 0.205 | 0.368 | 0.962 | 0.974 | 0.575 | ||
| Dew | [-] | 0.503 | 0.522 | 0.786 | 0.330 | 0.867 | -0.264 | 0.422 | 0.571 | 0.207 | 0.368 | 0.962 | 0.974 | 0.576 |
Download Data |
Period Mean (original grids) [mm d-1] |
Model Period Mean (intersection) [mm d-1] |
Benchmark Period Mean (intersection) [mm d-1] |
Model Period Mean (complement) [mm d-1] |
Benchmark Period Mean (complement) [mm d-1] |
Bias [mm d-1] |
RMSE [mm d-1] |
Phase Shift [months] |
Bias Score [1] |
RMSE Score [1] |
Seasonal Cycle Score [1] |
Spatial Distribution Score [1] |
Overall Score [1] |
|||
|---|---|---|---|---|---|---|---|---|---|---|---|---|---|---|---|---|
| Benchmark | [-] | 0.785 | ||||||||||||||
| Control | [-] | 1.17 | 1.14 | 0.783 | 1.81 | 1.85 | 0.399 | 0.588 | 1.82 | 0.449 | 0.701 | 0.707 | 0.947 | 0.701 | ||
| Dew | [-] | 1.17 | 1.14 | 0.783 | 1.81 | 1.85 | 0.399 | 0.588 | 1.82 | 0.449 | 0.701 | 0.707 | 0.947 | 0.701 |
Download Data |
Period Mean (original grids) [mm d-1] |
Model Period Mean (intersection) [mm d-1] |
Benchmark Period Mean (intersection) [mm d-1] |
Model Period Mean (complement) [mm d-1] |
Benchmark Period Mean (complement) [mm d-1] |
Bias [mm d-1] |
RMSE [mm d-1] |
Phase Shift [months] |
Bias Score [1] |
RMSE Score [1] |
Seasonal Cycle Score [1] |
Spatial Distribution Score [1] |
Overall Score [1] |
|||
|---|---|---|---|---|---|---|---|---|---|---|---|---|---|---|---|---|
| Benchmark | [-] | 1.32 | ||||||||||||||
| Control | [-] | 1.25 | 1.25 | 1.32 | 1.29 | 1.41 | -0.0662 | 0.414 | 0.306 | 0.617 | 0.585 | 0.979 | 0.975 | 0.748 | ||
| Dew | [-] | 1.25 | 1.25 | 1.32 | 1.29 | 1.41 | -0.0662 | 0.414 | 0.306 | 0.617 | 0.585 | 0.979 | 0.975 | 0.748 |
Download Data |
Period Mean (original grids) [mm d-1] |
Model Period Mean (intersection) [mm d-1] |
Benchmark Period Mean (intersection) [mm d-1] |
Model Period Mean (complement) [mm d-1] |
Benchmark Period Mean (complement) [mm d-1] |
Bias [mm d-1] |
RMSE [mm d-1] |
Phase Shift [months] |
Bias Score [1] |
RMSE Score [1] |
Seasonal Cycle Score [1] |
Spatial Distribution Score [1] |
Overall Score [1] |
|||
|---|---|---|---|---|---|---|---|---|---|---|---|---|---|---|---|---|
| Benchmark | [-] | 1.56 | ||||||||||||||
| Control | [-] | 1.23 | 1.54 | 1.56 | 0.339 | 2.46 | 0.00534 | 0.633 | 1.30 | 0.441 | 0.514 | 0.824 | 0.976 | 0.654 | ||
| Dew | [-] | 1.23 | 1.54 | 1.56 | 0.340 | 2.46 | 0.00540 | 0.633 | 1.30 | 0.441 | 0.514 | 0.824 | 0.976 | 0.654 |
Download Data |
Period Mean (original grids) [mm d-1] |
Model Period Mean (intersection) [mm d-1] |
Benchmark Period Mean (intersection) [mm d-1] |
Model Period Mean (complement) [mm d-1] |
Benchmark Period Mean (complement) [mm d-1] |
Bias [mm d-1] |
RMSE [mm d-1] |
Phase Shift [months] |
Bias Score [1] |
RMSE Score [1] |
Seasonal Cycle Score [1] |
Spatial Distribution Score [1] |
Overall Score [1] |
|||
|---|---|---|---|---|---|---|---|---|---|---|---|---|---|---|---|---|
| Benchmark | [-] | 0.604 | ||||||||||||||
| Control | [-] | 0.322 | 0.816 | 0.603 | 0.202 | 0.816 | 0.225 | 0.645 | 2.04 | 0.570 | 0.447 | 0.685 | 0.958 | 0.621 | ||
| Dew | [-] | 0.322 | 0.816 | 0.603 | 0.203 | 0.816 | 0.225 | 0.645 | 2.04 | 0.570 | 0.447 | 0.685 | 0.958 | 0.621 |
Download Data |
Period Mean (original grids) [mm d-1] |
Model Period Mean (intersection) [mm d-1] |
Benchmark Period Mean (intersection) [mm d-1] |
Model Period Mean (complement) [mm d-1] |
Benchmark Period Mean (complement) [mm d-1] |
Bias [mm d-1] |
RMSE [mm d-1] |
Phase Shift [months] |
Bias Score [1] |
RMSE Score [1] |
Seasonal Cycle Score [1] |
Spatial Distribution Score [1] |
Overall Score [1] |
|||
|---|---|---|---|---|---|---|---|---|---|---|---|---|---|---|---|---|
| Benchmark | [-] | 0.875 | ||||||||||||||
| Control | [-] | 0.553 | 0.626 | 0.875 | 0.345 | 1.05 | -0.247 | 0.408 | 0.702 | 0.295 | 0.441 | 0.952 | 0.934 | 0.613 | ||
| Dew | [-] | 0.554 | 0.626 | 0.875 | 0.346 | 1.05 | -0.246 | 0.407 | 0.701 | 0.296 | 0.441 | 0.952 | 0.934 | 0.613 |
Download Data |
Period Mean (original grids) [mm d-1] |
Model Period Mean (intersection) [mm d-1] |
Benchmark Period Mean (intersection) [mm d-1] |
Model Period Mean (complement) [mm d-1] |
Benchmark Period Mean (complement) [mm d-1] |
Bias [mm d-1] |
RMSE [mm d-1] |
Phase Shift [months] |
Bias Score [1] |
RMSE Score [1] |
Seasonal Cycle Score [1] |
Spatial Distribution Score [1] |
Overall Score [1] |
|||
|---|---|---|---|---|---|---|---|---|---|---|---|---|---|---|---|---|
| Benchmark | [-] | 2.13 | ||||||||||||||
| Control | [-] | 2.14 | 2.10 | 2.13 | 2.45 | 3.11 | 0.0539 | 0.614 | 1.57 | 0.600 | 0.609 | 0.791 | 0.988 | 0.719 | ||
| Dew | [-] | 2.14 | 2.10 | 2.13 | 2.45 | 3.11 | 0.0539 | 0.614 | 1.57 | 0.600 | 0.609 | 0.791 | 0.988 | 0.719 |
Download Data |
Period Mean (original grids) [mm d-1] |
Model Period Mean (intersection) [mm d-1] |
Benchmark Period Mean (intersection) [mm d-1] |
Model Period Mean (complement) [mm d-1] |
Benchmark Period Mean (complement) [mm d-1] |
Bias [mm d-1] |
RMSE [mm d-1] |
Phase Shift [months] |
Bias Score [1] |
RMSE Score [1] |
Seasonal Cycle Score [1] |
Spatial Distribution Score [1] |
Overall Score [1] |
|||
|---|---|---|---|---|---|---|---|---|---|---|---|---|---|---|---|---|
| Benchmark | [-] | 1.88 | ||||||||||||||
| Control | [-] | 1.79 | 1.79 | 1.88 | 1.81 | 2.22 | -0.0757 | 0.549 | 0.643 | 0.515 | 0.444 | 0.953 | 0.889 | 0.649 | ||
| Dew | [-] | 1.79 | 1.79 | 1.88 | 1.81 | 2.22 | -0.0756 | 0.548 | 0.643 | 0.515 | 0.444 | 0.953 | 0.889 | 0.649 |
Download Data |
Period Mean (original grids) [mm d-1] |
Model Period Mean (intersection) [mm d-1] |
Benchmark Period Mean (intersection) [mm d-1] |
Model Period Mean (complement) [mm d-1] |
Benchmark Period Mean (complement) [mm d-1] |
Bias [mm d-1] |
RMSE [mm d-1] |
Phase Shift [months] |
Bias Score [1] |
RMSE Score [1] |
Seasonal Cycle Score [1] |
Spatial Distribution Score [1] |
Overall Score [1] |
|||
|---|---|---|---|---|---|---|---|---|---|---|---|---|---|---|---|---|
| Benchmark | [-] | 1.13 | ||||||||||||||
| Control | [-] | 1.04 | 1.03 | 1.13 | 1.32 | 1.46 | -0.0976 | 0.417 | 0.646 | 0.563 | 0.437 | 0.950 | 0.987 | 0.675 | ||
| Dew | [-] | 1.04 | 1.03 | 1.13 | 1.32 | 1.46 | -0.0976 | 0.417 | 0.649 | 0.563 | 0.437 | 0.950 | 0.987 | 0.675 |
Download Data |
Period Mean (original grids) [mm d-1] |
Model Period Mean (intersection) [mm d-1] |
Benchmark Period Mean (intersection) [mm d-1] |
Model Period Mean (complement) [mm d-1] |
Benchmark Period Mean (complement) [mm d-1] |
Bias [mm d-1] |
RMSE [mm d-1] |
Phase Shift [months] |
Bias Score [1] |
RMSE Score [1] |
Seasonal Cycle Score [1] |
Spatial Distribution Score [1] |
Overall Score [1] |
|||
|---|---|---|---|---|---|---|---|---|---|---|---|---|---|---|---|---|
| Benchmark | [-] | 0.788 | ||||||||||||||
| Control | [-] | 0.928 | 0.940 | 0.787 | 1.06 | 1.95 | 0.160 | 0.663 | 1.75 | 0.611 | 0.365 | 0.724 | 0.968 | 0.607 | ||
| Dew | [-] | 0.928 | 0.940 | 0.787 | 1.06 | 1.95 | 0.160 | 0.663 | 1.75 | 0.611 | 0.365 | 0.724 | 0.968 | 0.607 |
Download Data |
Period Mean (original grids) [mm d-1] |
Model Period Mean (intersection) [mm d-1] |
Benchmark Period Mean (intersection) [mm d-1] |
Model Period Mean (complement) [mm d-1] |
Benchmark Period Mean (complement) [mm d-1] |
Bias [mm d-1] |
RMSE [mm d-1] |
Phase Shift [months] |
Bias Score [1] |
RMSE Score [1] |
Seasonal Cycle Score [1] |
Spatial Distribution Score [1] |
Overall Score [1] |
|||
|---|---|---|---|---|---|---|---|---|---|---|---|---|---|---|---|---|
| Benchmark | [-] | 3.62 | ||||||||||||||
| Control | [-] | 3.13 | 3.14 | 3.62 | 3.04 | 3.91 | -0.489 | 0.776 | 1.91 | 0.364 | 0.673 | 0.731 | 0.989 | 0.686 | ||
| Dew | [-] | 3.13 | 3.14 | 3.62 | 3.04 | 3.91 | -0.489 | 0.776 | 1.91 | 0.364 | 0.673 | 0.731 | 0.989 | 0.686 |
Download Data |
Period Mean (original grids) [mm d-1] |
Model Period Mean (intersection) [mm d-1] |
Benchmark Period Mean (intersection) [mm d-1] |
Model Period Mean (complement) [mm d-1] |
Benchmark Period Mean (complement) [mm d-1] |
Bias [mm d-1] |
RMSE [mm d-1] |
Phase Shift [months] |
Bias Score [1] |
RMSE Score [1] |
Seasonal Cycle Score [1] |
Spatial Distribution Score [1] |
Overall Score [1] |
|||
|---|---|---|---|---|---|---|---|---|---|---|---|---|---|---|---|---|
| Benchmark | [-] | 1.97 | ||||||||||||||
| Control | [-] | 2.22 | 2.20 | 1.97 | 2.36 | 1.89 | 0.228 | 0.923 | 1.24 | 0.338 | 0.511 | 0.851 | 0.837 | 0.610 | ||
| Dew | [-] | 2.22 | 2.20 | 1.97 | 2.36 | 1.89 | 0.228 | 0.923 | 1.24 | 0.338 | 0.511 | 0.851 | 0.837 | 0.610 |
Download Data |
Period Mean (original grids) [mm d-1] |
Model Period Mean (intersection) [mm d-1] |
Benchmark Period Mean (intersection) [mm d-1] |
Model Period Mean (complement) [mm d-1] |
Benchmark Period Mean (complement) [mm d-1] |
Bias [mm d-1] |
RMSE [mm d-1] |
Phase Shift [months] |
Bias Score [1] |
RMSE Score [1] |
Seasonal Cycle Score [1] |
Spatial Distribution Score [1] |
Overall Score [1] |
|||
|---|---|---|---|---|---|---|---|---|---|---|---|---|---|---|---|---|
| Benchmark | [-] | 1.18 | ||||||||||||||
| Control | [-] | 0.868 | 0.971 | 1.18 | 0.454 | 0.995 | -0.203 | 0.605 | 1.95 | 0.459 | 0.572 | 0.708 | 0.922 | 0.647 | ||
| Dew | [-] | 0.869 | 0.971 | 1.18 | 0.454 | 0.995 | -0.203 | 0.605 | 1.95 | 0.459 | 0.572 | 0.708 | 0.922 | 0.647 |
Temporally integrated period mean