Mean State
Download Data |
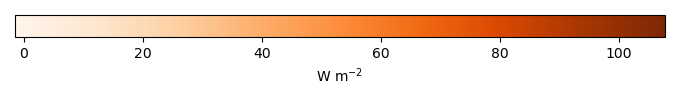
Period Mean (original grids) [W m-2] |
Model Period Mean (intersection) [W m-2] |
Benchmark Period Mean (intersection) [W m-2] |
Model Period Mean (complement) [W m-2] |
Benchmark Period Mean (complement) [W m-2] |
Bias [W m-2] |
RMSE [W m-2] |
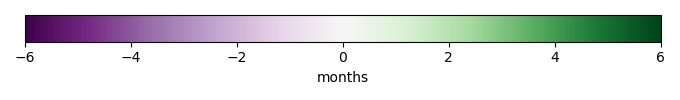
Phase Shift [months] |
Bias Score [1] |
RMSE Score [1] |
Seasonal Cycle Score [1] |
Spatial Distribution Score [1] |
Overall Score [1] |
|||
|---|---|---|---|---|---|---|---|---|---|---|---|---|---|---|---|---|
| Benchmark | [-] | 67.7 | ||||||||||||||
| Control | [-] | 74.5 | 75.4 | 67.7 | 70.0 | 3.49 | 7.31 | 15.8 | 1.75 | 0.599 | 0.629 | 0.727 | 0.996 | 0.716 | ||
| Dew | [-] | 74.5 | 75.4 | 67.7 | 70.0 | 3.49 | 7.31 | 15.8 | 1.75 | 0.599 | 0.629 | 0.727 | 0.996 | 0.716 |
Download Data |
Period Mean (original grids) [W m-2] |
Model Period Mean (intersection) [W m-2] |
Benchmark Period Mean (intersection) [W m-2] |
Model Period Mean (complement) [W m-2] |
Benchmark Period Mean (complement) [W m-2] |
Bias [W m-2] |
RMSE [W m-2] |
Phase Shift [months] |
Bias Score [1] |
RMSE Score [1] |
Seasonal Cycle Score [1] |
Spatial Distribution Score [1] |
Overall Score [1] |
|||
|---|---|---|---|---|---|---|---|---|---|---|---|---|---|---|---|---|
| Benchmark | [-] | 48.1 | ||||||||||||||
| Control | [-] | 56.4 | 55.6 | 48.1 | 60.0 | 7.61 | 16.4 | 1.17 | 0.580 | 0.530 | 0.850 | 0.994 | 0.697 | |||
| Dew | [-] | 56.4 | 55.6 | 48.1 | 60.0 | 7.61 | 16.4 | 1.17 | 0.580 | 0.530 | 0.850 | 0.994 | 0.697 |
Download Data |
Period Mean (original grids) [W m-2] |
Model Period Mean (intersection) [W m-2] |
Benchmark Period Mean (intersection) [W m-2] |
Model Period Mean (complement) [W m-2] |
Benchmark Period Mean (complement) [W m-2] |
Bias [W m-2] |
RMSE [W m-2] |
Phase Shift [months] |
Bias Score [1] |
RMSE Score [1] |
Seasonal Cycle Score [1] |
Spatial Distribution Score [1] |
Overall Score [1] |
|||
|---|---|---|---|---|---|---|---|---|---|---|---|---|---|---|---|---|
| Benchmark | [-] | 48.5 | ||||||||||||||
| Control | [-] | 54.5 | 53.4 | 48.5 | 65.4 | 28.8 | 4.91 | 12.4 | 0.982 | 0.684 | 0.681 | 0.866 | 0.988 | 0.780 | ||
| Dew | [-] | 54.5 | 53.4 | 48.5 | 65.4 | 28.8 | 4.91 | 12.4 | 0.980 | 0.684 | 0.681 | 0.867 | 0.988 | 0.780 |
Download Data |
Period Mean (original grids) [W m-2] |
Model Period Mean (intersection) [W m-2] |
Benchmark Period Mean (intersection) [W m-2] |
Model Period Mean (complement) [W m-2] |
Benchmark Period Mean (complement) [W m-2] |
Bias [W m-2] |
RMSE [W m-2] |
Phase Shift [months] |
Bias Score [1] |
RMSE Score [1] |
Seasonal Cycle Score [1] |
Spatial Distribution Score [1] |
Overall Score [1] |
|||
|---|---|---|---|---|---|---|---|---|---|---|---|---|---|---|---|---|
| Benchmark | [-] | 11.6 | ||||||||||||||
| Control | [-] | 13.0 | 13.1 | 11.6 | 12.5 | 19.4 | 1.53 | 8.26 | 0.499 | 0.669 | 0.479 | 0.967 | 0.963 | 0.712 | ||
| Dew | [-] | 13.0 | 13.1 | 11.6 | 12.6 | 19.4 | 1.54 | 8.26 | 0.501 | 0.669 | 0.479 | 0.966 | 0.963 | 0.711 |
Download Data |
Period Mean (original grids) [W m-2] |
Model Period Mean (intersection) [W m-2] |
Benchmark Period Mean (intersection) [W m-2] |
Model Period Mean (complement) [W m-2] |
Benchmark Period Mean (complement) [W m-2] |
Bias [W m-2] |
RMSE [W m-2] |
Phase Shift [months] |
Bias Score [1] |
RMSE Score [1] |
Seasonal Cycle Score [1] |
Spatial Distribution Score [1] |
Overall Score [1] |
|||
|---|---|---|---|---|---|---|---|---|---|---|---|---|---|---|---|---|
| Benchmark | [-] | 98.8 | ||||||||||||||
| Control | [-] | 110. | 110. | 98.8 | 110. | 107. | 11.4 | 18.7 | 1.93 | 0.489 | 0.746 | 0.705 | 0.992 | 0.736 | ||
| Dew | [-] | 110. | 110. | 98.8 | 110. | 107. | 11.4 | 18.7 | 1.93 | 0.489 | 0.746 | 0.705 | 0.992 | 0.736 |
Download Data |
Period Mean (original grids) [W m-2] |
Model Period Mean (intersection) [W m-2] |
Benchmark Period Mean (intersection) [W m-2] |
Model Period Mean (complement) [W m-2] |
Benchmark Period Mean (complement) [W m-2] |
Bias [W m-2] |
RMSE [W m-2] |
Phase Shift [months] |
Bias Score [1] |
RMSE Score [1] |
Seasonal Cycle Score [1] |
Spatial Distribution Score [1] |
Overall Score [1] |
|||
|---|---|---|---|---|---|---|---|---|---|---|---|---|---|---|---|---|
| Benchmark | [-] | 23.0 | ||||||||||||||
| Control | [-] | 23.5 | 23.4 | 23.0 | 23.9 | 35.1 | 0.372 | 12.6 | 0.628 | 0.705 | 0.332 | 0.955 | 0.992 | 0.663 | ||
| Dew | [-] | 23.5 | 23.4 | 23.0 | 23.9 | 35.1 | 0.374 | 12.6 | 0.627 | 0.705 | 0.332 | 0.955 | 0.992 | 0.663 |
Download Data |
Period Mean (original grids) [W m-2] |
Model Period Mean (intersection) [W m-2] |
Benchmark Period Mean (intersection) [W m-2] |
Model Period Mean (complement) [W m-2] |
Benchmark Period Mean (complement) [W m-2] |
Bias [W m-2] |
RMSE [W m-2] |
Phase Shift [months] |
Bias Score [1] |
RMSE Score [1] |
Seasonal Cycle Score [1] |
Spatial Distribution Score [1] |
Overall Score [1] |
|||
|---|---|---|---|---|---|---|---|---|---|---|---|---|---|---|---|---|
| Benchmark | [-] | 25.0 | ||||||||||||||
| Control | [-] | 27.8 | 26.6 | 25.0 | 42.4 | 41.7 | 1.81 | 10.4 | 0.696 | 0.713 | 0.606 | 0.930 | 0.982 | 0.767 | ||
| Dew | [-] | 27.8 | 26.6 | 25.0 | 42.4 | 41.7 | 1.81 | 10.4 | 0.696 | 0.713 | 0.606 | 0.930 | 0.982 | 0.767 |
Download Data |
Period Mean (original grids) [W m-2] |
Model Period Mean (intersection) [W m-2] |
Benchmark Period Mean (intersection) [W m-2] |
Model Period Mean (complement) [W m-2] |
Benchmark Period Mean (complement) [W m-2] |
Bias [W m-2] |
RMSE [W m-2] |
Phase Shift [months] |
Bias Score [1] |
RMSE Score [1] |
Seasonal Cycle Score [1] |
Spatial Distribution Score [1] |
Overall Score [1] |
|||
|---|---|---|---|---|---|---|---|---|---|---|---|---|---|---|---|---|
| Benchmark | [-] | 53.0 | ||||||||||||||
| Control | [-] | 60.4 | 57.0 | 53.0 | 83.4 | 4.42 | 15.8 | 1.29 | 0.673 | 0.561 | 0.821 | 0.990 | 0.721 | |||
| Dew | [-] | 60.4 | 57.0 | 53.0 | 83.4 | 4.42 | 15.8 | 1.29 | 0.673 | 0.561 | 0.821 | 0.990 | 0.721 |
Download Data |
Period Mean (original grids) [W m-2] |
Model Period Mean (intersection) [W m-2] |
Benchmark Period Mean (intersection) [W m-2] |
Model Period Mean (complement) [W m-2] |
Benchmark Period Mean (complement) [W m-2] |
Bias [W m-2] |
RMSE [W m-2] |
Phase Shift [months] |
Bias Score [1] |
RMSE Score [1] |
Seasonal Cycle Score [1] |
Spatial Distribution Score [1] |
Overall Score [1] |
|||
|---|---|---|---|---|---|---|---|---|---|---|---|---|---|---|---|---|
| Benchmark | [-] | 12.8 | ||||||||||||||
| Control | [-] | 14.6 | 15.0 | 12.8 | 13.1 | 2.09 | 11.1 | 0.529 | 0.607 | 0.337 | 0.963 | 0.976 | 0.644 | |||
| Dew | [-] | 14.6 | 15.0 | 12.8 | 13.2 | 2.11 | 11.1 | 0.529 | 0.605 | 0.338 | 0.963 | 0.976 | 0.644 |
Download Data |
Period Mean (original grids) [W m-2] |
Model Period Mean (intersection) [W m-2] |
Benchmark Period Mean (intersection) [W m-2] |
Model Period Mean (complement) [W m-2] |
Benchmark Period Mean (complement) [W m-2] |
Bias [W m-2] |
RMSE [W m-2] |
Phase Shift [months] |
Bias Score [1] |
RMSE Score [1] |
Seasonal Cycle Score [1] |
Spatial Distribution Score [1] |
Overall Score [1] |
|||
|---|---|---|---|---|---|---|---|---|---|---|---|---|---|---|---|---|
| Benchmark | [-] | 26.3 | ||||||||||||||
| Control | [-] | 32.9 | 30.5 | 26.3 | 52.4 | 33.5 | 4.79 | 10.4 | 0.929 | 0.690 | 0.682 | 0.904 | 0.980 | 0.787 | ||
| Dew | [-] | 32.9 | 30.5 | 26.3 | 52.4 | 33.5 | 4.79 | 10.4 | 0.929 | 0.690 | 0.681 | 0.904 | 0.980 | 0.787 |
Download Data |
Period Mean (original grids) [W m-2] |
Model Period Mean (intersection) [W m-2] |
Benchmark Period Mean (intersection) [W m-2] |
Model Period Mean (complement) [W m-2] |
Benchmark Period Mean (complement) [W m-2] |
Bias [W m-2] |
RMSE [W m-2] |
Phase Shift [months] |
Bias Score [1] |
RMSE Score [1] |
Seasonal Cycle Score [1] |
Spatial Distribution Score [1] |
Overall Score [1] |
|||
|---|---|---|---|---|---|---|---|---|---|---|---|---|---|---|---|---|
| Benchmark | [-] | 33.2 | ||||||||||||||
| Control | [-] | 36.9 | 37.1 | 33.2 | 36.2 | 38.3 | 4.07 | 12.7 | 0.600 | 0.699 | 0.509 | 0.950 | 0.984 | 0.730 | ||
| Dew | [-] | 36.9 | 37.1 | 33.2 | 36.2 | 38.3 | 4.07 | 12.7 | 0.600 | 0.699 | 0.509 | 0.950 | 0.984 | 0.730 |
Download Data |
Period Mean (original grids) [W m-2] |
Model Period Mean (intersection) [W m-2] |
Benchmark Period Mean (intersection) [W m-2] |
Model Period Mean (complement) [W m-2] |
Benchmark Period Mean (complement) [W m-2] |
Bias [W m-2] |
RMSE [W m-2] |
Phase Shift [months] |
Bias Score [1] |
RMSE Score [1] |
Seasonal Cycle Score [1] |
Spatial Distribution Score [1] |
Overall Score [1] |
|||
|---|---|---|---|---|---|---|---|---|---|---|---|---|---|---|---|---|
| Benchmark | [-] | 36.4 | ||||||||||||||
| Control | [-] | 35.7 | 39.1 | 36.4 | 22.1 | 35.4 | 2.94 | 12.0 | 1.06 | 0.676 | 0.594 | 0.868 | 0.991 | 0.745 | ||
| Dew | [-] | 35.7 | 39.1 | 36.4 | 22.2 | 35.4 | 2.94 | 12.0 | 1.06 | 0.676 | 0.594 | 0.868 | 0.991 | 0.745 |
Download Data |
Period Mean (original grids) [W m-2] |
Model Period Mean (intersection) [W m-2] |
Benchmark Period Mean (intersection) [W m-2] |
Model Period Mean (complement) [W m-2] |
Benchmark Period Mean (complement) [W m-2] |
Bias [W m-2] |
RMSE [W m-2] |
Phase Shift [months] |
Bias Score [1] |
RMSE Score [1] |
Seasonal Cycle Score [1] |
Spatial Distribution Score [1] |
Overall Score [1] |
|||
|---|---|---|---|---|---|---|---|---|---|---|---|---|---|---|---|---|
| Benchmark | [-] | 5.96 | ||||||||||||||
| Control | [-] | 9.29 | 8.86 | 5.96 | 19.2 | 8.46 | 3.07 | 6.25 | 1.53 | 0.799 | 0.786 | 0.776 | 0.886 | 0.807 | ||
| Dew | [-] | 9.29 | 8.86 | 5.96 | 19.2 | 8.46 | 3.07 | 6.25 | 1.53 | 0.799 | 0.786 | 0.777 | 0.886 | 0.807 |
Download Data |
Period Mean (original grids) [W m-2] |
Model Period Mean (intersection) [W m-2] |
Benchmark Period Mean (intersection) [W m-2] |
Model Period Mean (complement) [W m-2] |
Benchmark Period Mean (complement) [W m-2] |
Bias [W m-2] |
RMSE [W m-2] |
Phase Shift [months] |
Bias Score [1] |
RMSE Score [1] |
Seasonal Cycle Score [1] |
Spatial Distribution Score [1] |
Overall Score [1] |
|||
|---|---|---|---|---|---|---|---|---|---|---|---|---|---|---|---|---|
| Benchmark | [-] | 12.8 | ||||||||||||||
| Control | [-] | 16.2 | 17.1 | 12.8 | 14.0 | 4.29 | 12.0 | 0.686 | 0.433 | 0.370 | 0.950 | 0.962 | 0.617 | |||
| Dew | [-] | 16.3 | 17.1 | 12.8 | 14.0 | 4.31 | 12.0 | 0.685 | 0.432 | 0.370 | 0.950 | 0.962 | 0.617 |
Download Data |
Period Mean (original grids) [W m-2] |
Model Period Mean (intersection) [W m-2] |
Benchmark Period Mean (intersection) [W m-2] |
Model Period Mean (complement) [W m-2] |
Benchmark Period Mean (complement) [W m-2] |
Bias [W m-2] |
RMSE [W m-2] |
Phase Shift [months] |
Bias Score [1] |
RMSE Score [1] |
Seasonal Cycle Score [1] |
Spatial Distribution Score [1] |
Overall Score [1] |
|||
|---|---|---|---|---|---|---|---|---|---|---|---|---|---|---|---|---|
| Benchmark | [-] | 50.5 | ||||||||||||||
| Control | [-] | 63.0 | 57.6 | 50.5 | 79.4 | 32.3 | 8.04 | 17.5 | 1.06 | 0.571 | 0.579 | 0.877 | 0.914 | 0.704 | ||
| Dew | [-] | 63.0 | 57.6 | 50.5 | 79.4 | 32.3 | 8.04 | 17.5 | 1.06 | 0.571 | 0.578 | 0.877 | 0.914 | 0.704 |
Download Data |
Period Mean (original grids) [W m-2] |
Model Period Mean (intersection) [W m-2] |
Benchmark Period Mean (intersection) [W m-2] |
Model Period Mean (complement) [W m-2] |
Benchmark Period Mean (complement) [W m-2] |
Bias [W m-2] |
RMSE [W m-2] |
Phase Shift [months] |
Bias Score [1] |
RMSE Score [1] |
Seasonal Cycle Score [1] |
Spatial Distribution Score [1] |
Overall Score [1] |
|||
|---|---|---|---|---|---|---|---|---|---|---|---|---|---|---|---|---|
| Benchmark | [-] | 54.7 | ||||||||||||||
| Control | [-] | 52.1 | 52.1 | 54.7 | 52.8 | -2.40 | 12.4 | 0.632 | 0.719 | 0.548 | 0.947 | 0.878 | 0.728 | |||
| Dew | [-] | 52.1 | 52.1 | 54.7 | 52.8 | -2.40 | 12.4 | 0.632 | 0.719 | 0.548 | 0.947 | 0.878 | 0.728 |
Download Data |
Period Mean (original grids) [W m-2] |
Model Period Mean (intersection) [W m-2] |
Benchmark Period Mean (intersection) [W m-2] |
Model Period Mean (complement) [W m-2] |
Benchmark Period Mean (complement) [W m-2] |
Bias [W m-2] |
RMSE [W m-2] |
Phase Shift [months] |
Bias Score [1] |
RMSE Score [1] |
Seasonal Cycle Score [1] |
Spatial Distribution Score [1] |
Overall Score [1] |
|||
|---|---|---|---|---|---|---|---|---|---|---|---|---|---|---|---|---|
| Benchmark | [-] | 25.7 | ||||||||||||||
| Control | [-] | 30.4 | 29.5 | 25.7 | 35.1 | 3.77 | 11.9 | 0.688 | 0.663 | 0.467 | 0.946 | 0.972 | 0.703 | |||
| Dew | [-] | 30.4 | 29.5 | 25.7 | 35.1 | 3.77 | 11.9 | 0.688 | 0.663 | 0.467 | 0.946 | 0.972 | 0.703 |
Download Data |
Period Mean (original grids) [W m-2] |
Model Period Mean (intersection) [W m-2] |
Benchmark Period Mean (intersection) [W m-2] |
Model Period Mean (complement) [W m-2] |
Benchmark Period Mean (complement) [W m-2] |
Bias [W m-2] |
RMSE [W m-2] |
Phase Shift [months] |
Bias Score [1] |
RMSE Score [1] |
Seasonal Cycle Score [1] |
Spatial Distribution Score [1] |
Overall Score [1] |
|||
|---|---|---|---|---|---|---|---|---|---|---|---|---|---|---|---|---|
| Benchmark | [-] | 26.3 | ||||||||||||||
| Control | [-] | 26.6 | 26.9 | 26.2 | 34.0 | 30.4 | 0.683 | 10.4 | 0.907 | 0.761 | 0.602 | 0.913 | 0.990 | 0.774 | ||
| Dew | [-] | 26.6 | 26.9 | 26.2 | 34.0 | 30.4 | 0.683 | 10.4 | 0.907 | 0.761 | 0.602 | 0.913 | 0.990 | 0.774 |
Download Data |
Period Mean (original grids) [W m-2] |
Model Period Mean (intersection) [W m-2] |
Benchmark Period Mean (intersection) [W m-2] |
Model Period Mean (complement) [W m-2] |
Benchmark Period Mean (complement) [W m-2] |
Bias [W m-2] |
RMSE [W m-2] |
Phase Shift [months] |
Bias Score [1] |
RMSE Score [1] |
Seasonal Cycle Score [1] |
Spatial Distribution Score [1] |
Overall Score [1] |
|||
|---|---|---|---|---|---|---|---|---|---|---|---|---|---|---|---|---|
| Benchmark | [-] | 91.0 | ||||||||||||||
| Control | [-] | 91.5 | 91.6 | 91.1 | 91.9 | 81.6 | 0.512 | 18.0 | 1.84 | 0.557 | 0.644 | 0.729 | 0.863 | 0.687 | ||
| Dew | [-] | 91.5 | 91.6 | 91.1 | 91.9 | 81.6 | 0.512 | 18.0 | 1.84 | 0.557 | 0.644 | 0.729 | 0.863 | 0.687 |
Download Data |
Period Mean (original grids) [W m-2] |
Model Period Mean (intersection) [W m-2] |
Benchmark Period Mean (intersection) [W m-2] |
Model Period Mean (complement) [W m-2] |
Benchmark Period Mean (complement) [W m-2] |
Bias [W m-2] |
RMSE [W m-2] |
Phase Shift [months] |
Bias Score [1] |
RMSE Score [1] |
Seasonal Cycle Score [1] |
Spatial Distribution Score [1] |
Overall Score [1] |
|||
|---|---|---|---|---|---|---|---|---|---|---|---|---|---|---|---|---|
| Benchmark | [-] | 66.6 | ||||||||||||||
| Control | [-] | 64.6 | 64.1 | 66.6 | 65.9 | 72.0 | -2.41 | 12.8 | 1.34 | 0.752 | 0.655 | 0.830 | 0.997 | 0.778 | ||
| Dew | [-] | 64.6 | 64.1 | 66.6 | 65.9 | 72.0 | -2.41 | 12.8 | 1.34 | 0.752 | 0.655 | 0.830 | 0.997 | 0.778 |
Download Data |
Period Mean (original grids) [W m-2] |
Model Period Mean (intersection) [W m-2] |
Benchmark Period Mean (intersection) [W m-2] |
Model Period Mean (complement) [W m-2] |
Benchmark Period Mean (complement) [W m-2] |
Bias [W m-2] |
RMSE [W m-2] |
Phase Shift [months] |
Bias Score [1] |
RMSE Score [1] |
Seasonal Cycle Score [1] |
Spatial Distribution Score [1] |
Overall Score [1] |
|||
|---|---|---|---|---|---|---|---|---|---|---|---|---|---|---|---|---|
| Benchmark | [-] | 22.4 | ||||||||||||||
| Control | [-] | 24.7 | 24.7 | 22.4 | 23.8 | 10.7 | 2.08 | 11.4 | 1.20 | 0.601 | 0.656 | 0.851 | 0.942 | 0.741 | ||
| Dew | [-] | 24.7 | 24.7 | 22.4 | 23.8 | 10.7 | 2.08 | 11.4 | 1.20 | 0.601 | 0.656 | 0.852 | 0.942 | 0.741 |
Temporally integrated period mean