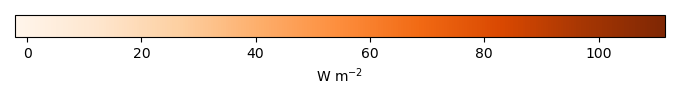
Mean State
Download Data |
Period Mean (original grids) [W m-2] |
Model Period Mean (intersection) [W m-2] |
Benchmark Period Mean (intersection) [W m-2] |
Model Period Mean (complement) [W m-2] |
Benchmark Period Mean (complement) [W m-2] |
Bias [W m-2] |
RMSE [W m-2] |
Phase Shift [months] |
Bias Score [1] |
RMSE Score [1] |
Seasonal Cycle Score [1] |
Spatial Distribution Score [1] |
Overall Score [1] |
|||
|---|---|---|---|---|---|---|---|---|---|---|---|---|---|---|---|---|
| Benchmark | [-] | 65.9 | ||||||||||||||
| Control | [-] | 74.0 | 74.9 | 65.9 | 60.8 | 69.2 | 8.12 | 15.9 | 2.21 | 0.536 | 0.669 | 0.648 | 0.957 | 0.696 | ||
| Dew | [-] | 74.0 | 74.9 | 65.9 | 60.8 | 69.2 | 8.12 | 15.9 | 2.21 | 0.536 | 0.669 | 0.648 | 0.957 | 0.696 |
Download Data |
Period Mean (original grids) [W m-2] |
Model Period Mean (intersection) [W m-2] |
Benchmark Period Mean (intersection) [W m-2] |
Model Period Mean (complement) [W m-2] |
Benchmark Period Mean (complement) [W m-2] |
Bias [W m-2] |
RMSE [W m-2] |
Phase Shift [months] |
Bias Score [1] |
RMSE Score [1] |
Seasonal Cycle Score [1] |
Spatial Distribution Score [1] |
Overall Score [1] |
|||
|---|---|---|---|---|---|---|---|---|---|---|---|---|---|---|---|---|
| Benchmark | [-] | 47.3 | ||||||||||||||
| Control | [-] | 56.2 | 55.5 | 47.3 | 56.9 | 48.8 | 9.48 | 14.9 | 0.839 | 0.498 | 0.627 | 0.879 | 0.988 | 0.724 | ||
| Dew | [-] | 56.2 | 55.5 | 47.3 | 56.9 | 48.8 | 9.48 | 14.9 | 0.839 | 0.498 | 0.627 | 0.879 | 0.988 | 0.724 |
Download Data |
Period Mean (original grids) [W m-2] |
Model Period Mean (intersection) [W m-2] |
Benchmark Period Mean (intersection) [W m-2] |
Model Period Mean (complement) [W m-2] |
Benchmark Period Mean (complement) [W m-2] |
Bias [W m-2] |
RMSE [W m-2] |
Phase Shift [months] |
Bias Score [1] |
RMSE Score [1] |
Seasonal Cycle Score [1] |
Spatial Distribution Score [1] |
Overall Score [1] |
|||
|---|---|---|---|---|---|---|---|---|---|---|---|---|---|---|---|---|
| Benchmark | [-] | 52.2 | ||||||||||||||
| Control | [-] | 52.8 | 52.1 | 52.2 | 65.0 | 43.4 | -0.0134 | 12.7 | 0.975 | 0.574 | 0.728 | 0.878 | 0.863 | 0.754 | ||
| Dew | [-] | 52.8 | 52.1 | 52.2 | 65.0 | 43.4 | -0.0133 | 12.7 | 0.975 | 0.574 | 0.728 | 0.878 | 0.863 | 0.754 |
Download Data |
Period Mean (original grids) [W m-2] |
Model Period Mean (intersection) [W m-2] |
Benchmark Period Mean (intersection) [W m-2] |
Model Period Mean (complement) [W m-2] |
Benchmark Period Mean (complement) [W m-2] |
Bias [W m-2] |
RMSE [W m-2] |
Phase Shift [months] |
Bias Score [1] |
RMSE Score [1] |
Seasonal Cycle Score [1] |
Spatial Distribution Score [1] |
Overall Score [1] |
|||
|---|---|---|---|---|---|---|---|---|---|---|---|---|---|---|---|---|
| Benchmark | [-] | 16.2 | ||||||||||||||
| Control | [-] | 12.9 | 12.9 | 16.3 | 13.1 | 13.6 | -3.27 | 9.43 | 0.423 | 0.513 | 0.443 | 0.971 | 0.806 | 0.635 | ||
| Dew | [-] | 12.9 | 12.9 | 16.3 | 13.1 | 13.6 | -3.26 | 9.42 | 0.423 | 0.513 | 0.443 | 0.971 | 0.805 | 0.635 |
Download Data |
Period Mean (original grids) [W m-2] |
Model Period Mean (intersection) [W m-2] |
Benchmark Period Mean (intersection) [W m-2] |
Model Period Mean (complement) [W m-2] |
Benchmark Period Mean (complement) [W m-2] |
Bias [W m-2] |
RMSE [W m-2] |
Phase Shift [months] |
Bias Score [1] |
RMSE Score [1] |
Seasonal Cycle Score [1] |
Spatial Distribution Score [1] |
Overall Score [1] |
|||
|---|---|---|---|---|---|---|---|---|---|---|---|---|---|---|---|---|
| Benchmark | [-] | 86.9 | ||||||||||||||
| Control | [-] | 110. | 110. | 86.9 | 111. | 81.9 | 23.3 | 26.1 | 2.27 | 0.317 | 0.774 | 0.632 | 0.988 | 0.697 | ||
| Dew | [-] | 110. | 110. | 86.9 | 111. | 81.9 | 23.3 | 26.1 | 2.27 | 0.317 | 0.774 | 0.632 | 0.988 | 0.697 |
Download Data |
Period Mean (original grids) [W m-2] |
Model Period Mean (intersection) [W m-2] |
Benchmark Period Mean (intersection) [W m-2] |
Model Period Mean (complement) [W m-2] |
Benchmark Period Mean (complement) [W m-2] |
Bias [W m-2] |
RMSE [W m-2] |
Phase Shift [months] |
Bias Score [1] |
RMSE Score [1] |
Seasonal Cycle Score [1] |
Spatial Distribution Score [1] |
Overall Score [1] |
|||
|---|---|---|---|---|---|---|---|---|---|---|---|---|---|---|---|---|
| Benchmark | [-] | 28.6 | ||||||||||||||
| Control | [-] | 23.4 | 23.3 | 28.6 | 24.2 | 26.7 | -5.22 | 11.4 | 0.639 | 0.517 | 0.430 | 0.950 | 0.995 | 0.664 | ||
| Dew | [-] | 23.4 | 23.3 | 28.6 | 24.2 | 26.7 | -5.22 | 11.4 | 0.639 | 0.517 | 0.430 | 0.950 | 0.995 | 0.664 |
Download Data |
Period Mean (original grids) [W m-2] |
Model Period Mean (intersection) [W m-2] |
Benchmark Period Mean (intersection) [W m-2] |
Model Period Mean (complement) [W m-2] |
Benchmark Period Mean (complement) [W m-2] |
Bias [W m-2] |
RMSE [W m-2] |
Phase Shift [months] |
Bias Score [1] |
RMSE Score [1] |
Seasonal Cycle Score [1] |
Spatial Distribution Score [1] |
Overall Score [1] |
|||
|---|---|---|---|---|---|---|---|---|---|---|---|---|---|---|---|---|
| Benchmark | [-] | 30.9 | ||||||||||||||
| Control | [-] | 27.3 | 26.5 | 30.9 | 50.8 | 49.7 | -3.99 | 10.1 | 0.645 | 0.598 | 0.682 | 0.931 | 0.973 | 0.773 | ||
| Dew | [-] | 27.3 | 26.5 | 30.9 | 50.8 | 49.7 | -3.99 | 10.1 | 0.645 | 0.598 | 0.682 | 0.931 | 0.973 | 0.773 |
Download Data |
Period Mean (original grids) [W m-2] |
Model Period Mean (intersection) [W m-2] |
Benchmark Period Mean (intersection) [W m-2] |
Model Period Mean (complement) [W m-2] |
Benchmark Period Mean (complement) [W m-2] |
Bias [W m-2] |
RMSE [W m-2] |
Phase Shift [months] |
Bias Score [1] |
RMSE Score [1] |
Seasonal Cycle Score [1] |
Spatial Distribution Score [1] |
Overall Score [1] |
|||
|---|---|---|---|---|---|---|---|---|---|---|---|---|---|---|---|---|
| Benchmark | [-] | 56.7 | ||||||||||||||
| Control | [-] | 60.2 | 58.6 | 56.6 | 87.6 | 82.5 | 3.43 | 13.9 | 0.998 | 0.611 | 0.678 | 0.872 | 0.960 | 0.760 | ||
| Dew | [-] | 60.2 | 58.6 | 56.6 | 87.6 | 82.5 | 3.43 | 13.8 | 0.998 | 0.611 | 0.678 | 0.872 | 0.960 | 0.760 |
Download Data |
Period Mean (original grids) [W m-2] |
Model Period Mean (intersection) [W m-2] |
Benchmark Period Mean (intersection) [W m-2] |
Model Period Mean (complement) [W m-2] |
Benchmark Period Mean (complement) [W m-2] |
Bias [W m-2] |
RMSE [W m-2] |
Phase Shift [months] |
Bias Score [1] |
RMSE Score [1] |
Seasonal Cycle Score [1] |
Spatial Distribution Score [1] |
Overall Score [1] |
|||
|---|---|---|---|---|---|---|---|---|---|---|---|---|---|---|---|---|
| Benchmark | [-] | 16.2 | ||||||||||||||
| Control | [-] | 14.5 | 14.7 | 16.2 | 13.4 | 14.2 | -1.72 | 8.72 | 0.357 | 0.705 | 0.449 | 0.976 | 0.977 | 0.711 | ||
| Dew | [-] | 14.5 | 14.7 | 16.2 | 13.5 | 14.2 | -1.69 | 8.70 | 0.357 | 0.706 | 0.450 | 0.976 | 0.977 | 0.712 |
Download Data |
Period Mean (original grids) [W m-2] |
Model Period Mean (intersection) [W m-2] |
Benchmark Period Mean (intersection) [W m-2] |
Model Period Mean (complement) [W m-2] |
Benchmark Period Mean (complement) [W m-2] |
Bias [W m-2] |
RMSE [W m-2] |
Phase Shift [months] |
Bias Score [1] |
RMSE Score [1] |
Seasonal Cycle Score [1] |
Spatial Distribution Score [1] |
Overall Score [1] |
|||
|---|---|---|---|---|---|---|---|---|---|---|---|---|---|---|---|---|
| Benchmark | [-] | 29.5 | ||||||||||||||
| Control | [-] | 33.9 | 32.5 | 29.5 | 54.0 | 31.4 | 3.98 | 9.27 | 0.888 | 0.682 | 0.753 | 0.913 | 0.948 | 0.810 | ||
| Dew | [-] | 33.9 | 32.5 | 29.5 | 54.0 | 31.4 | 3.98 | 9.27 | 0.888 | 0.682 | 0.753 | 0.913 | 0.948 | 0.810 |
Download Data |
Period Mean (original grids) [W m-2] |
Model Period Mean (intersection) [W m-2] |
Benchmark Period Mean (intersection) [W m-2] |
Model Period Mean (complement) [W m-2] |
Benchmark Period Mean (complement) [W m-2] |
Bias [W m-2] |
RMSE [W m-2] |
Phase Shift [months] |
Bias Score [1] |
RMSE Score [1] |
Seasonal Cycle Score [1] |
Spatial Distribution Score [1] |
Overall Score [1] |
|||
|---|---|---|---|---|---|---|---|---|---|---|---|---|---|---|---|---|
| Benchmark | [-] | 39.3 | ||||||||||||||
| Control | [-] | 35.8 | 35.7 | 39.3 | 37.3 | 37.8 | -3.35 | 8.91 | 0.308 | 0.662 | 0.713 | 0.979 | 0.993 | 0.812 | ||
| Dew | [-] | 35.8 | 35.7 | 39.3 | 37.3 | 37.8 | -3.35 | 8.91 | 0.309 | 0.662 | 0.713 | 0.979 | 0.993 | 0.812 |
Download Data |
Period Mean (original grids) [W m-2] |
Model Period Mean (intersection) [W m-2] |
Benchmark Period Mean (intersection) [W m-2] |
Model Period Mean (complement) [W m-2] |
Benchmark Period Mean (complement) [W m-2] |
Bias [W m-2] |
RMSE [W m-2] |
Phase Shift [months] |
Bias Score [1] |
RMSE Score [1] |
Seasonal Cycle Score [1] |
Spatial Distribution Score [1] |
Overall Score [1] |
|||
|---|---|---|---|---|---|---|---|---|---|---|---|---|---|---|---|---|
| Benchmark | [-] | 39.7 | ||||||||||||||
| Control | [-] | 35.4 | 39.0 | 39.7 | 15.0 | 44.1 | -0.184 | 11.3 | 0.992 | 0.605 | 0.671 | 0.875 | 0.972 | 0.759 | ||
| Dew | [-] | 35.4 | 39.0 | 39.7 | 15.1 | 44.1 | -0.181 | 11.3 | 0.992 | 0.605 | 0.671 | 0.875 | 0.972 | 0.759 |
Download Data |
Period Mean (original grids) [W m-2] |
Model Period Mean (intersection) [W m-2] |
Benchmark Period Mean (intersection) [W m-2] |
Model Period Mean (complement) [W m-2] |
Benchmark Period Mean (complement) [W m-2] |
Bias [W m-2] |
RMSE [W m-2] |
Phase Shift [months] |
Bias Score [1] |
RMSE Score [1] |
Seasonal Cycle Score [1] |
Spatial Distribution Score [1] |
Overall Score [1] |
|||
|---|---|---|---|---|---|---|---|---|---|---|---|---|---|---|---|---|
| Benchmark | [-] | 10.2 | ||||||||||||||
| Control | [-] | 9.52 | 9.28 | 10.2 | 21.5 | 20.0 | -0.634 | 6.94 | 1.94 | 0.740 | 0.779 | 0.701 | 0.949 | 0.790 | ||
| Dew | [-] | 9.53 | 9.29 | 10.2 | 21.5 | 20.0 | -0.632 | 6.94 | 1.94 | 0.740 | 0.779 | 0.701 | 0.949 | 0.790 |
Download Data |
Period Mean (original grids) [W m-2] |
Model Period Mean (intersection) [W m-2] |
Benchmark Period Mean (intersection) [W m-2] |
Model Period Mean (complement) [W m-2] |
Benchmark Period Mean (complement) [W m-2] |
Bias [W m-2] |
RMSE [W m-2] |
Phase Shift [months] |
Bias Score [1] |
RMSE Score [1] |
Seasonal Cycle Score [1] |
Spatial Distribution Score [1] |
Overall Score [1] |
|||
|---|---|---|---|---|---|---|---|---|---|---|---|---|---|---|---|---|
| Benchmark | [-] | 17.6 | ||||||||||||||
| Control | [-] | 16.1 | 16.5 | 17.6 | 13.4 | 12.7 | -1.30 | 7.94 | 0.462 | 0.606 | 0.546 | 0.968 | 0.941 | 0.721 | ||
| Dew | [-] | 16.1 | 16.5 | 17.6 | 13.4 | 12.7 | -1.29 | 7.93 | 0.463 | 0.607 | 0.547 | 0.968 | 0.941 | 0.722 |
Download Data |
Period Mean (original grids) [W m-2] |
Model Period Mean (intersection) [W m-2] |
Benchmark Period Mean (intersection) [W m-2] |
Model Period Mean (complement) [W m-2] |
Benchmark Period Mean (complement) [W m-2] |
Bias [W m-2] |
RMSE [W m-2] |
Phase Shift [months] |
Bias Score [1] |
RMSE Score [1] |
Seasonal Cycle Score [1] |
Spatial Distribution Score [1] |
Overall Score [1] |
|||
|---|---|---|---|---|---|---|---|---|---|---|---|---|---|---|---|---|
| Benchmark | [-] | 57.1 | ||||||||||||||
| Control | [-] | 61.7 | 59.7 | 57.0 | 75.2 | 69.4 | 4.04 | 17.0 | 0.945 | 0.497 | 0.661 | 0.896 | 0.872 | 0.717 | ||
| Dew | [-] | 61.7 | 59.7 | 57.0 | 75.2 | 69.4 | 4.04 | 17.0 | 0.944 | 0.497 | 0.661 | 0.896 | 0.872 | 0.717 |
Download Data |
Period Mean (original grids) [W m-2] |
Model Period Mean (intersection) [W m-2] |
Benchmark Period Mean (intersection) [W m-2] |
Model Period Mean (complement) [W m-2] |
Benchmark Period Mean (complement) [W m-2] |
Bias [W m-2] |
RMSE [W m-2] |
Phase Shift [months] |
Bias Score [1] |
RMSE Score [1] |
Seasonal Cycle Score [1] |
Spatial Distribution Score [1] |
Overall Score [1] |
|||
|---|---|---|---|---|---|---|---|---|---|---|---|---|---|---|---|---|
| Benchmark | [-] | 59.7 | ||||||||||||||
| Control | [-] | 52.5 | 52.5 | 59.7 | 53.8 | 54.8 | -6.91 | 10.9 | 0.337 | 0.537 | 0.710 | 0.977 | 0.967 | 0.780 | ||
| Dew | [-] | 52.5 | 52.5 | 59.7 | 53.8 | 54.8 | -6.91 | 10.9 | 0.337 | 0.537 | 0.710 | 0.977 | 0.967 | 0.780 |
Download Data |
Period Mean (original grids) [W m-2] |
Model Period Mean (intersection) [W m-2] |
Benchmark Period Mean (intersection) [W m-2] |
Model Period Mean (complement) [W m-2] |
Benchmark Period Mean (complement) [W m-2] |
Bias [W m-2] |
RMSE [W m-2] |
Phase Shift [months] |
Bias Score [1] |
RMSE Score [1] |
Seasonal Cycle Score [1] |
Spatial Distribution Score [1] |
Overall Score [1] |
|||
|---|---|---|---|---|---|---|---|---|---|---|---|---|---|---|---|---|
| Benchmark | [-] | 32.3 | ||||||||||||||
| Control | [-] | 30.5 | 30.1 | 32.3 | 38.8 | 33.5 | -1.99 | 8.91 | 0.689 | 0.719 | 0.610 | 0.946 | 0.994 | 0.776 | ||
| Dew | [-] | 30.5 | 30.1 | 32.3 | 38.8 | 33.5 | -1.99 | 8.91 | 0.686 | 0.719 | 0.610 | 0.946 | 0.994 | 0.776 |
Download Data |
Period Mean (original grids) [W m-2] |
Model Period Mean (intersection) [W m-2] |
Benchmark Period Mean (intersection) [W m-2] |
Model Period Mean (complement) [W m-2] |
Benchmark Period Mean (complement) [W m-2] |
Bias [W m-2] |
RMSE [W m-2] |
Phase Shift [months] |
Bias Score [1] |
RMSE Score [1] |
Seasonal Cycle Score [1] |
Spatial Distribution Score [1] |
Overall Score [1] |
|||
|---|---|---|---|---|---|---|---|---|---|---|---|---|---|---|---|---|
| Benchmark | [-] | 31.4 | ||||||||||||||
| Control | [-] | 27.6 | 27.9 | 31.4 | 41.5 | 36.1 | -3.32 | 9.07 | 0.634 | 0.682 | 0.697 | 0.940 | 0.991 | 0.801 | ||
| Dew | [-] | 27.6 | 27.9 | 31.4 | 41.5 | 36.1 | -3.32 | 9.07 | 0.634 | 0.682 | 0.697 | 0.940 | 0.991 | 0.801 |
Download Data |
Period Mean (original grids) [W m-2] |
Model Period Mean (intersection) [W m-2] |
Benchmark Period Mean (intersection) [W m-2] |
Model Period Mean (complement) [W m-2] |
Benchmark Period Mean (complement) [W m-2] |
Bias [W m-2] |
RMSE [W m-2] |
Phase Shift [months] |
Bias Score [1] |
RMSE Score [1] |
Seasonal Cycle Score [1] |
Spatial Distribution Score [1] |
Overall Score [1] |
|||
|---|---|---|---|---|---|---|---|---|---|---|---|---|---|---|---|---|
| Benchmark | [-] | 86.4 | ||||||||||||||
| Control | [-] | 90.1 | 90.2 | 86.4 | 86.9 | 94.5 | 3.86 | 14.1 | 1.16 | 0.584 | 0.782 | 0.853 | 0.599 | 0.720 | ||
| Dew | [-] | 90.1 | 90.2 | 86.4 | 86.9 | 94.5 | 3.86 | 14.1 | 1.15 | 0.584 | 0.782 | 0.853 | 0.599 | 0.720 |
Download Data |
Period Mean (original grids) [W m-2] |
Model Period Mean (intersection) [W m-2] |
Benchmark Period Mean (intersection) [W m-2] |
Model Period Mean (complement) [W m-2] |
Benchmark Period Mean (complement) [W m-2] |
Bias [W m-2] |
RMSE [W m-2] |
Phase Shift [months] |
Bias Score [1] |
RMSE Score [1] |
Seasonal Cycle Score [1] |
Spatial Distribution Score [1] |
Overall Score [1] |
|||
|---|---|---|---|---|---|---|---|---|---|---|---|---|---|---|---|---|
| Benchmark | [-] | 68.6 | ||||||||||||||
| Control | [-] | 63.5 | 63.0 | 68.6 | 67.9 | 59.4 | -5.72 | 13.3 | 1.21 | 0.642 | 0.699 | 0.856 | 0.913 | 0.762 | ||
| Dew | [-] | 63.5 | 63.0 | 68.6 | 67.9 | 59.4 | -5.72 | 13.3 | 1.21 | 0.642 | 0.699 | 0.856 | 0.913 | 0.762 |
Download Data |
Period Mean (original grids) [W m-2] |
Model Period Mean (intersection) [W m-2] |
Benchmark Period Mean (intersection) [W m-2] |
Model Period Mean (complement) [W m-2] |
Benchmark Period Mean (complement) [W m-2] |
Bias [W m-2] |
RMSE [W m-2] |
Phase Shift [months] |
Bias Score [1] |
RMSE Score [1] |
Seasonal Cycle Score [1] |
Spatial Distribution Score [1] |
Overall Score [1] |
|||
|---|---|---|---|---|---|---|---|---|---|---|---|---|---|---|---|---|
| Benchmark | [-] | 31.5 | ||||||||||||||
| Control | [-] | 24.6 | 24.7 | 31.5 | 21.7 | 22.2 | -6.45 | 15.0 | 1.11 | 0.354 | 0.664 | 0.867 | 0.752 | 0.660 | ||
| Dew | [-] | 24.6 | 24.7 | 31.5 | 21.7 | 22.2 | -6.45 | 15.0 | 1.11 | 0.354 | 0.664 | 0.867 | 0.752 | 0.660 |
Temporally integrated period mean