Mean State
Download Data |
Period Mean (original grids) [1] |
Model Period Mean (intersection) [1] |
Benchmark Period Mean (intersection) [1] |
Model Period Mean (complement) [1] |
Benchmark Period Mean (complement) [1] |
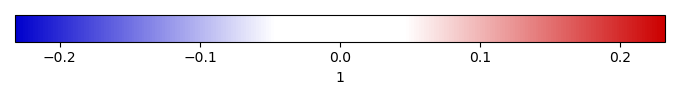
Bias [1] |
RMSE [1] |
Phase Shift [months] |
Bias Score [1] |
RMSE Score [1] |
Seasonal Cycle Score [1] |
Spatial Distribution Score [1] |
Overall Score [1] |
|||
|---|---|---|---|---|---|---|---|---|---|---|---|---|---|---|---|---|
| Benchmark | [-] | 0.135 | ||||||||||||||
| Control | [-] | 0.183 | 0.181 | 0.139 | 0.0548 | 0.0427 | 0.0473 | 3.14 | 0.132 | 0.419 | 0.476 | 0.959 | 0.481 | |||
| Dew | [-] | 0.183 | 0.181 | 0.139 | 0.0548 | 0.0428 | 0.0474 | 3.14 | 0.131 | 0.418 | 0.476 | 0.962 | 0.481 |
Download Data |
Period Mean (original grids) [1] |
Model Period Mean (intersection) [1] |
Benchmark Period Mean (intersection) [1] |
Model Period Mean (complement) [1] |
Benchmark Period Mean (complement) [1] |
Bias [1] |
RMSE [1] |
Phase Shift [months] |
Bias Score [1] |
RMSE Score [1] |
Seasonal Cycle Score [1] |
Spatial Distribution Score [1] |
Overall Score [1] |
|||
|---|---|---|---|---|---|---|---|---|---|---|---|---|---|---|---|---|
| Benchmark | [-] | 0.178 | ||||||||||||||
| Control | [-] | 0.192 | 0.194 | 0.179 | 0.0582 | 0.0110 | 0.0324 | 2.80 | 0.355 | 0.341 | 0.537 | 0.976 | 0.510 | |||
| Dew | [-] | 0.192 | 0.194 | 0.179 | 0.0582 | 0.0111 | 0.0324 | 2.80 | 0.355 | 0.340 | 0.537 | 0.976 | 0.510 |
Download Data |
Period Mean (original grids) [1] |
Model Period Mean (intersection) [1] |
Benchmark Period Mean (intersection) [1] |
Model Period Mean (complement) [1] |
Benchmark Period Mean (complement) [1] |
Bias [1] |
RMSE [1] |
Phase Shift [months] |
Bias Score [1] |
RMSE Score [1] |
Seasonal Cycle Score [1] |
Spatial Distribution Score [1] |
Overall Score [1] |
|||
|---|---|---|---|---|---|---|---|---|---|---|---|---|---|---|---|---|
| Benchmark | [-] | 0.140 | ||||||||||||||
| Control | [-] | 0.165 | 0.165 | 0.144 | 0.0631 | 0.0199 | 0.0308 | 2.77 | 0.320 | 0.429 | 0.544 | 0.934 | 0.531 | |||
| Dew | [-] | 0.165 | 0.165 | 0.144 | 0.0631 | 0.0200 | 0.0308 | 2.77 | 0.319 | 0.429 | 0.545 | 0.935 | 0.532 |
Download Data |
Period Mean (original grids) [1] |
Model Period Mean (intersection) [1] |
Benchmark Period Mean (intersection) [1] |
Model Period Mean (complement) [1] |
Benchmark Period Mean (complement) [1] |
Bias [1] |
RMSE [1] |
Phase Shift [months] |
Bias Score [1] |
RMSE Score [1] |
Seasonal Cycle Score [1] |
Spatial Distribution Score [1] |
Overall Score [1] |
|||
|---|---|---|---|---|---|---|---|---|---|---|---|---|---|---|---|---|
| Benchmark | [-] | 0.360 | ||||||||||||||
| Control | [-] | 0.339 | 0.339 | 0.362 | 0.342 | -0.0240 | 0.0852 | 0.606 | 0.816 | 0.757 | 0.935 | 0.859 | 0.825 | |||
| Dew | [-] | 0.339 | 0.339 | 0.362 | 0.342 | -0.0241 | 0.0852 | 0.605 | 0.816 | 0.757 | 0.936 | 0.858 | 0.825 |
Download Data |
Period Mean (original grids) [1] |
Model Period Mean (intersection) [1] |
Benchmark Period Mean (intersection) [1] |
Model Period Mean (complement) [1] |
Benchmark Period Mean (complement) [1] |
Bias [1] |
RMSE [1] |
Phase Shift [months] |
Bias Score [1] |
RMSE Score [1] |
Seasonal Cycle Score [1] |
Spatial Distribution Score [1] |
Overall Score [1] |
|||
|---|---|---|---|---|---|---|---|---|---|---|---|---|---|---|---|---|
| Benchmark | [-] | 0.0875 | ||||||||||||||
| Control | [-] | 0.175 | 0.175 | 0.0933 | 0.0586 | 0.0815 | 0.0821 | 3.40 | 0.0194 | 0.503 | 0.426 | 0.150 | 0.320 | |||
| Dew | [-] | 0.175 | 0.175 | 0.0933 | 0.0586 | 0.0815 | 0.0821 | 3.40 | 0.0194 | 0.503 | 0.426 | 0.150 | 0.320 |
Download Data |
Period Mean (original grids) [1] |
Model Period Mean (intersection) [1] |
Benchmark Period Mean (intersection) [1] |
Model Period Mean (complement) [1] |
Benchmark Period Mean (complement) [1] |
Bias [1] |
RMSE [1] |
Phase Shift [months] |
Bias Score [1] |
RMSE Score [1] |
Seasonal Cycle Score [1] |
Spatial Distribution Score [1] |
Overall Score [1] |
|||
|---|---|---|---|---|---|---|---|---|---|---|---|---|---|---|---|---|
| Benchmark | [-] | 0.207 | ||||||||||||||
| Control | [-] | 0.208 | 0.207 | 0.207 | 0.168 | 1.66e-05 | 0.0595 | 1.01 | 0.855 | 0.711 | 0.894 | 0.841 | 0.802 | |||
| Dew | [-] | 0.208 | 0.207 | 0.207 | 0.168 | 1.03e-05 | 0.0595 | 1.01 | 0.855 | 0.711 | 0.894 | 0.841 | 0.802 |
Download Data |
Period Mean (original grids) [1] |
Model Period Mean (intersection) [1] |
Benchmark Period Mean (intersection) [1] |
Model Period Mean (complement) [1] |
Benchmark Period Mean (complement) [1] |
Bias [1] |
RMSE [1] |
Phase Shift [months] |
Bias Score [1] |
RMSE Score [1] |
Seasonal Cycle Score [1] |
Spatial Distribution Score [1] |
Overall Score [1] |
|||
|---|---|---|---|---|---|---|---|---|---|---|---|---|---|---|---|---|
| Benchmark | [-] | 0.193 | ||||||||||||||
| Control | [-] | 0.205 | 0.206 | 0.196 | 0.0604 | 0.00877 | 0.0573 | 1.18 | 0.580 | 0.581 | 0.834 | 0.853 | 0.686 | |||
| Dew | [-] | 0.205 | 0.206 | 0.196 | 0.0604 | 0.00882 | 0.0573 | 1.18 | 0.580 | 0.581 | 0.833 | 0.853 | 0.686 |
Download Data |
Period Mean (original grids) [1] |
Model Period Mean (intersection) [1] |
Benchmark Period Mean (intersection) [1] |
Model Period Mean (complement) [1] |
Benchmark Period Mean (complement) [1] |
Bias [1] |
RMSE [1] |
Phase Shift [months] |
Bias Score [1] |
RMSE Score [1] |
Seasonal Cycle Score [1] |
Spatial Distribution Score [1] |
Overall Score [1] |
|||
|---|---|---|---|---|---|---|---|---|---|---|---|---|---|---|---|---|
| Benchmark | [-] | 0.131 | ||||||||||||||
| Control | [-] | 0.179 | 0.179 | 0.135 | 0.0576 | 0.0431 | 0.0545 | 3.34 | 0.140 | 0.402 | 0.439 | 0.780 | 0.432 | |||
| Dew | [-] | 0.179 | 0.179 | 0.135 | 0.0576 | 0.0432 | 0.0545 | 3.34 | 0.140 | 0.401 | 0.441 | 0.781 | 0.433 |
Download Data |
Period Mean (original grids) [1] |
Model Period Mean (intersection) [1] |
Benchmark Period Mean (intersection) [1] |
Model Period Mean (complement) [1] |
Benchmark Period Mean (complement) [1] |
Bias [1] |
RMSE [1] |
Phase Shift [months] |
Bias Score [1] |
RMSE Score [1] |
Seasonal Cycle Score [1] |
Spatial Distribution Score [1] |
Overall Score [1] |
|||
|---|---|---|---|---|---|---|---|---|---|---|---|---|---|---|---|---|
| Benchmark | [-] | 0.365 | ||||||||||||||
| Control | [-] | 0.366 | 0.363 | 0.364 | 0.376 | -0.00107 | 0.0813 | 0.637 | 0.849 | 0.755 | 0.943 | 0.991 | 0.859 | |||
| Dew | [-] | 0.365 | 0.363 | 0.364 | 0.376 | -0.00127 | 0.0813 | 0.637 | 0.849 | 0.755 | 0.943 | 0.991 | 0.859 |
Download Data |
Period Mean (original grids) [1] |
Model Period Mean (intersection) [1] |
Benchmark Period Mean (intersection) [1] |
Model Period Mean (complement) [1] |
Benchmark Period Mean (complement) [1] |
Bias [1] |
RMSE [1] |
Phase Shift [months] |
Bias Score [1] |
RMSE Score [1] |
Seasonal Cycle Score [1] |
Spatial Distribution Score [1] |
Overall Score [1] |
|||
|---|---|---|---|---|---|---|---|---|---|---|---|---|---|---|---|---|
| Benchmark | [-] | 0.150 | ||||||||||||||
| Control | [-] | 0.179 | 0.179 | 0.156 | 0.0596 | 0.0242 | 0.0312 | 2.12 | 0.307 | 0.558 | 0.674 | 0.822 | 0.584 | |||
| Dew | [-] | 0.179 | 0.179 | 0.156 | 0.0596 | 0.0243 | 0.0313 | 2.11 | 0.307 | 0.558 | 0.676 | 0.824 | 0.584 |
Download Data |
Period Mean (original grids) [1] |
Model Period Mean (intersection) [1] |
Benchmark Period Mean (intersection) [1] |
Model Period Mean (complement) [1] |
Benchmark Period Mean (complement) [1] |
Bias [1] |
RMSE [1] |
Phase Shift [months] |
Bias Score [1] |
RMSE Score [1] |
Seasonal Cycle Score [1] |
Spatial Distribution Score [1] |
Overall Score [1] |
|||
|---|---|---|---|---|---|---|---|---|---|---|---|---|---|---|---|---|
| Benchmark | [-] | 0.141 | ||||||||||||||
| Control | [-] | 0.181 | 0.182 | 0.146 | 0.0658 | 0.0361 | 0.0592 | 1.14 | 0.469 | 0.551 | 0.842 | 0.893 | 0.661 | |||
| Dew | [-] | 0.181 | 0.182 | 0.146 | 0.0658 | 0.0361 | 0.0592 | 1.14 | 0.469 | 0.551 | 0.842 | 0.893 | 0.661 |
Download Data |
Period Mean (original grids) [1] |
Model Period Mean (intersection) [1] |
Benchmark Period Mean (intersection) [1] |
Model Period Mean (complement) [1] |
Benchmark Period Mean (complement) [1] |
Bias [1] |
RMSE [1] |
Phase Shift [months] |
Bias Score [1] |
RMSE Score [1] |
Seasonal Cycle Score [1] |
Spatial Distribution Score [1] |
Overall Score [1] |
|||
|---|---|---|---|---|---|---|---|---|---|---|---|---|---|---|---|---|
| Benchmark | [-] | 0.252 | ||||||||||||||
| Control | [-] | 0.278 | 0.278 | 0.257 | 0.130 | 0.0202 | 0.0528 | 2.05 | 0.428 | 0.523 | 0.677 | 0.996 | 0.629 | |||
| Dew | [-] | 0.278 | 0.278 | 0.257 | 0.130 | 0.0203 | 0.0529 | 2.05 | 0.428 | 0.523 | 0.677 | 0.996 | 0.629 |
Download Data |
Period Mean (original grids) [1] |
Model Period Mean (intersection) [1] |
Benchmark Period Mean (intersection) [1] |
Model Period Mean (complement) [1] |
Benchmark Period Mean (complement) [1] |
Bias [1] |
RMSE [1] |
Phase Shift [months] |
Bias Score [1] |
RMSE Score [1] |
Seasonal Cycle Score [1] |
Spatial Distribution Score [1] |
Overall Score [1] |
|||
|---|---|---|---|---|---|---|---|---|---|---|---|---|---|---|---|---|
| Benchmark | [-] | 0.285 | ||||||||||||||
| Control | [-] | 0.313 | 0.313 | 0.292 | 0.0635 | 0.0194 | 0.0456 | 2.43 | 0.232 | 0.426 | 0.619 | 0.974 | 0.535 | |||
| Dew | [-] | 0.314 | 0.314 | 0.292 | 0.0635 | 0.0207 | 0.0461 | 2.40 | 0.230 | 0.422 | 0.625 | 0.975 | 0.535 |
Download Data |
Period Mean (original grids) [1] |
Model Period Mean (intersection) [1] |
Benchmark Period Mean (intersection) [1] |
Model Period Mean (complement) [1] |
Benchmark Period Mean (complement) [1] |
Bias [1] |
RMSE [1] |
Phase Shift [months] |
Bias Score [1] |
RMSE Score [1] |
Seasonal Cycle Score [1] |
Spatial Distribution Score [1] |
Overall Score [1] |
|||
|---|---|---|---|---|---|---|---|---|---|---|---|---|---|---|---|---|
| Benchmark | [-] | 0.387 | ||||||||||||||
| Control | [-] | 0.374 | 0.374 | 0.387 | 0.387 | -0.0123 | 0.0923 | 0.764 | 0.822 | 0.739 | 0.917 | 0.994 | 0.842 | |||
| Dew | [-] | 0.374 | 0.373 | 0.387 | 0.387 | -0.0125 | 0.0923 | 0.765 | 0.822 | 0.739 | 0.917 | 0.994 | 0.842 |
Download Data |
Period Mean (original grids) [1] |
Model Period Mean (intersection) [1] |
Benchmark Period Mean (intersection) [1] |
Model Period Mean (complement) [1] |
Benchmark Period Mean (complement) [1] |
Bias [1] |
RMSE [1] |
Phase Shift [months] |
Bias Score [1] |
RMSE Score [1] |
Seasonal Cycle Score [1] |
Spatial Distribution Score [1] |
Overall Score [1] |
|||
|---|---|---|---|---|---|---|---|---|---|---|---|---|---|---|---|---|
| Benchmark | [-] | 0.111 | ||||||||||||||
| Control | [-] | 0.168 | 0.168 | 0.120 | 0.0552 | 0.0462 | 0.0528 | 3.13 | 0.142 | 0.462 | 0.477 | 0.579 | 0.424 | |||
| Dew | [-] | 0.168 | 0.168 | 0.120 | 0.0552 | 0.0463 | 0.0528 | 3.13 | 0.142 | 0.461 | 0.476 | 0.582 | 0.424 |
Download Data |
Period Mean (original grids) [1] |
Model Period Mean (intersection) [1] |
Benchmark Period Mean (intersection) [1] |
Model Period Mean (complement) [1] |
Benchmark Period Mean (complement) [1] |
Bias [1] |
RMSE [1] |
Phase Shift [months] |
Bias Score [1] |
RMSE Score [1] |
Seasonal Cycle Score [1] |
Spatial Distribution Score [1] |
Overall Score [1] |
|||
|---|---|---|---|---|---|---|---|---|---|---|---|---|---|---|---|---|
| Benchmark | [-] | 0.148 | ||||||||||||||
| Control | [-] | 0.180 | 0.180 | 0.152 | 0.0578 | 0.0283 | 0.0463 | 2.06 | 0.420 | 0.533 | 0.679 | 0.822 | 0.597 | |||
| Dew | [-] | 0.180 | 0.180 | 0.152 | 0.0578 | 0.0283 | 0.0463 | 2.06 | 0.420 | 0.533 | 0.680 | 0.822 | 0.597 |
Download Data |
Period Mean (original grids) [1] |
Model Period Mean (intersection) [1] |
Benchmark Period Mean (intersection) [1] |
Model Period Mean (complement) [1] |
Benchmark Period Mean (complement) [1] |
Bias [1] |
RMSE [1] |
Phase Shift [months] |
Bias Score [1] |
RMSE Score [1] |
Seasonal Cycle Score [1] |
Spatial Distribution Score [1] |
Overall Score [1] |
|||
|---|---|---|---|---|---|---|---|---|---|---|---|---|---|---|---|---|
| Benchmark | [-] | 0.182 | ||||||||||||||
| Control | [-] | 0.204 | 0.205 | 0.184 | 0.0849 | 0.0220 | 0.0780 | 1.28 | 0.725 | 0.632 | 0.858 | 0.902 | 0.750 | |||
| Dew | [-] | 0.204 | 0.205 | 0.184 | 0.0849 | 0.0220 | 0.0780 | 1.28 | 0.725 | 0.632 | 0.858 | 0.902 | 0.750 |
Download Data |
Period Mean (original grids) [1] |
Model Period Mean (intersection) [1] |
Benchmark Period Mean (intersection) [1] |
Model Period Mean (complement) [1] |
Benchmark Period Mean (complement) [1] |
Bias [1] |
RMSE [1] |
Phase Shift [months] |
Bias Score [1] |
RMSE Score [1] |
Seasonal Cycle Score [1] |
Spatial Distribution Score [1] |
Overall Score [1] |
|||
|---|---|---|---|---|---|---|---|---|---|---|---|---|---|---|---|---|
| Benchmark | [-] | 0.190 | ||||||||||||||
| Control | [-] | 0.188 | 0.188 | 0.193 | 0.0726 | -0.00449 | 0.0419 | 1.05 | 0.647 | 0.578 | 0.856 | 0.929 | 0.718 | |||
| Dew | [-] | 0.188 | 0.188 | 0.193 | 0.0726 | -0.00446 | 0.0419 | 1.05 | 0.647 | 0.578 | 0.857 | 0.929 | 0.718 |
Download Data |
Period Mean (original grids) [1] |
Model Period Mean (intersection) [1] |
Benchmark Period Mean (intersection) [1] |
Model Period Mean (complement) [1] |
Benchmark Period Mean (complement) [1] |
Bias [1] |
RMSE [1] |
Phase Shift [months] |
Bias Score [1] |
RMSE Score [1] |
Seasonal Cycle Score [1] |
Spatial Distribution Score [1] |
Overall Score [1] |
|||
|---|---|---|---|---|---|---|---|---|---|---|---|---|---|---|---|---|
| Benchmark | [-] | 0.131 | ||||||||||||||
| Control | [-] | 0.171 | 0.171 | 0.132 | 0.0497 | 0.0388 | 0.0404 | 3.70 | 0.130 | 0.521 | 0.367 | 0.573 | 0.422 | |||
| Dew | [-] | 0.171 | 0.171 | 0.132 | 0.0497 | 0.0388 | 0.0404 | 3.70 | 0.130 | 0.521 | 0.367 | 0.573 | 0.422 |
Download Data |
Period Mean (original grids) [1] |
Model Period Mean (intersection) [1] |
Benchmark Period Mean (intersection) [1] |
Model Period Mean (complement) [1] |
Benchmark Period Mean (complement) [1] |
Bias [1] |
RMSE [1] |
Phase Shift [months] |
Bias Score [1] |
RMSE Score [1] |
Seasonal Cycle Score [1] |
Spatial Distribution Score [1] |
Overall Score [1] |
|||
|---|---|---|---|---|---|---|---|---|---|---|---|---|---|---|---|---|
| Benchmark | [-] | 0.142 | ||||||||||||||
| Control | [-] | 0.157 | 0.157 | 0.145 | 0.0570 | 0.0116 | 0.0230 | 3.07 | 0.417 | 0.417 | 0.491 | 0.425 | 0.433 | |||
| Dew | [-] | 0.157 | 0.157 | 0.145 | 0.0570 | 0.0116 | 0.0230 | 3.07 | 0.417 | 0.417 | 0.491 | 0.425 | 0.433 |
Download Data |
Period Mean (original grids) [1] |
Model Period Mean (intersection) [1] |
Benchmark Period Mean (intersection) [1] |
Model Period Mean (complement) [1] |
Benchmark Period Mean (complement) [1] |
Bias [1] |
RMSE [1] |
Phase Shift [months] |
Bias Score [1] |
RMSE Score [1] |
Seasonal Cycle Score [1] |
Spatial Distribution Score [1] |
Overall Score [1] |
|||
|---|---|---|---|---|---|---|---|---|---|---|---|---|---|---|---|---|
| Benchmark | [-] | 0.138 | ||||||||||||||
| Control | [-] | 0.165 | 0.165 | 0.143 | 0.0727 | 0.0215 | 0.0455 | 2.45 | 0.344 | 0.486 | 0.613 | 0.883 | 0.562 | |||
| Dew | [-] | 0.165 | 0.165 | 0.143 | 0.0727 | 0.0217 | 0.0456 | 2.45 | 0.344 | 0.486 | 0.612 | 0.886 | 0.563 |
Temporally integrated period mean