
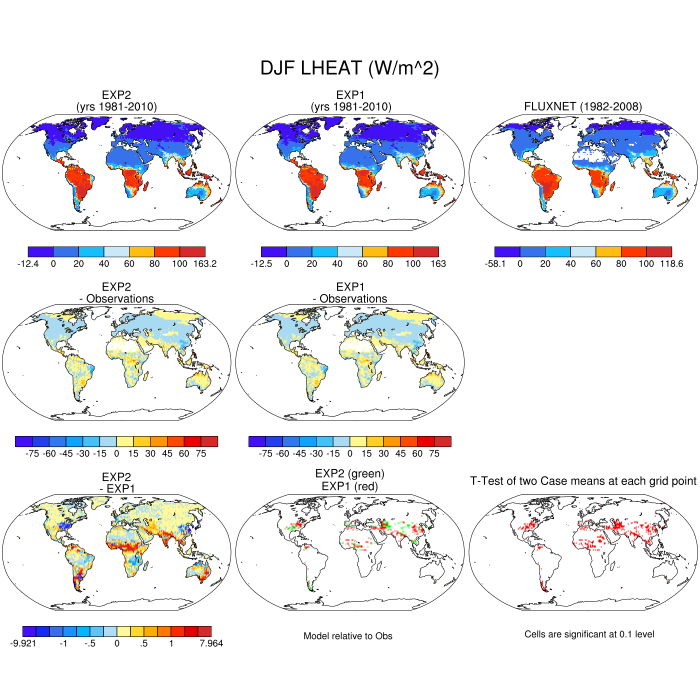
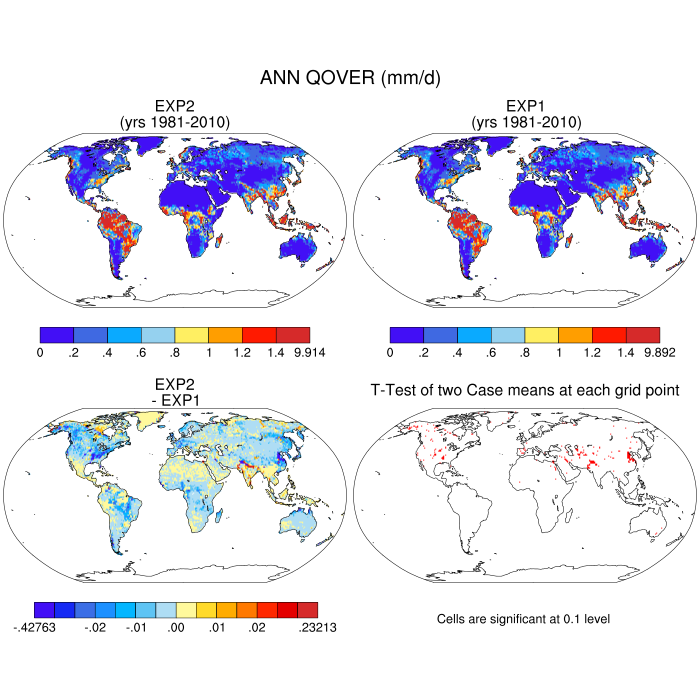
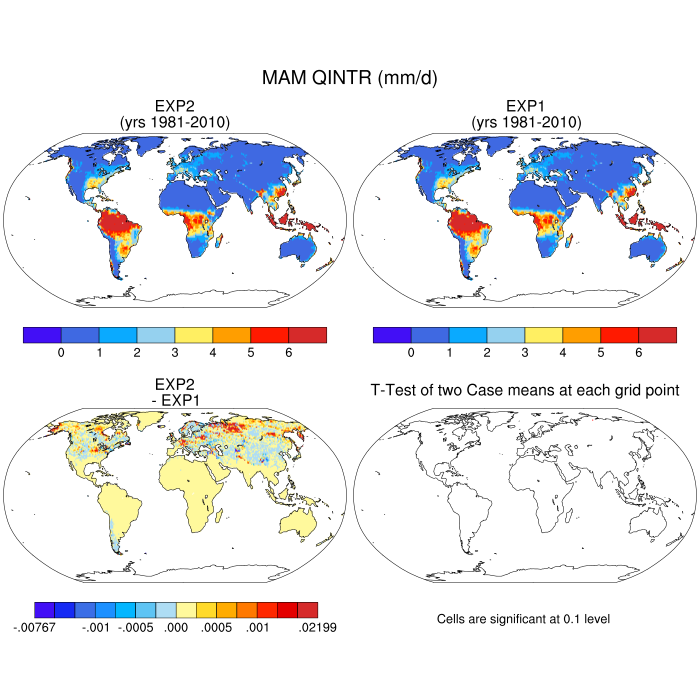
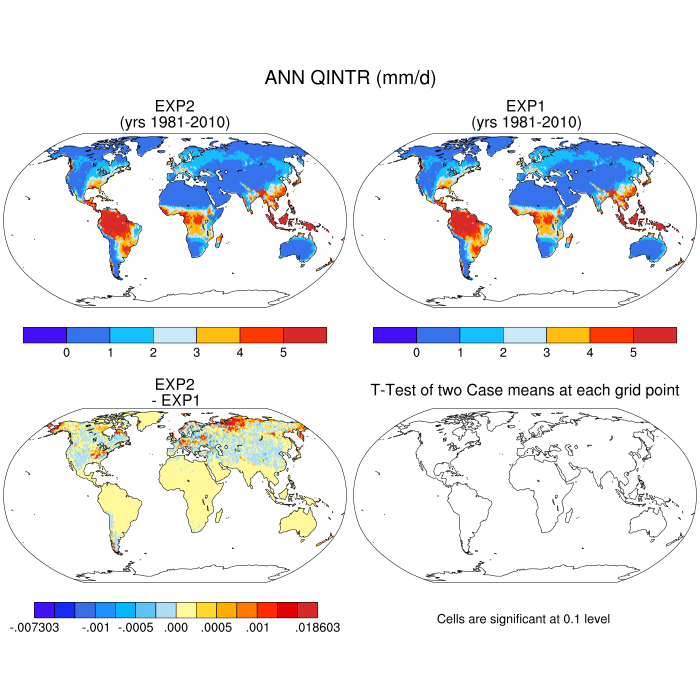
I2000CLM50_exp2
and
I2000CLM50_exp1
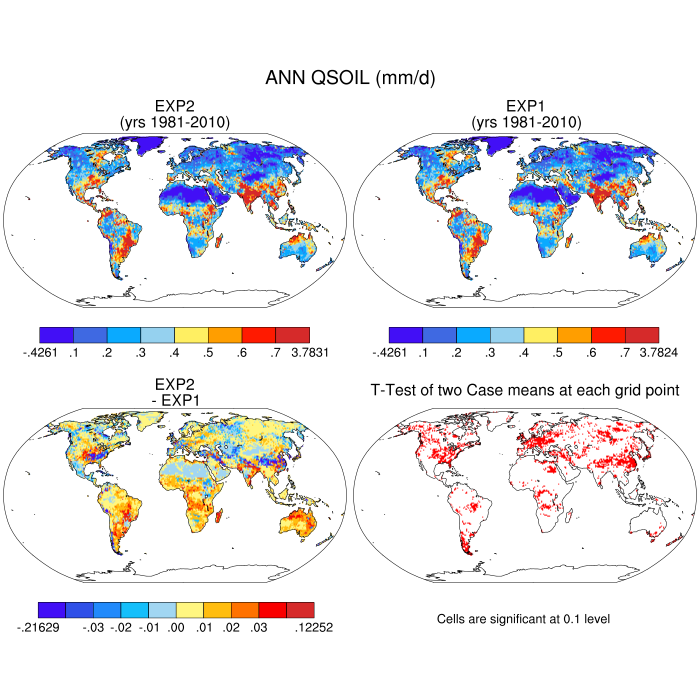
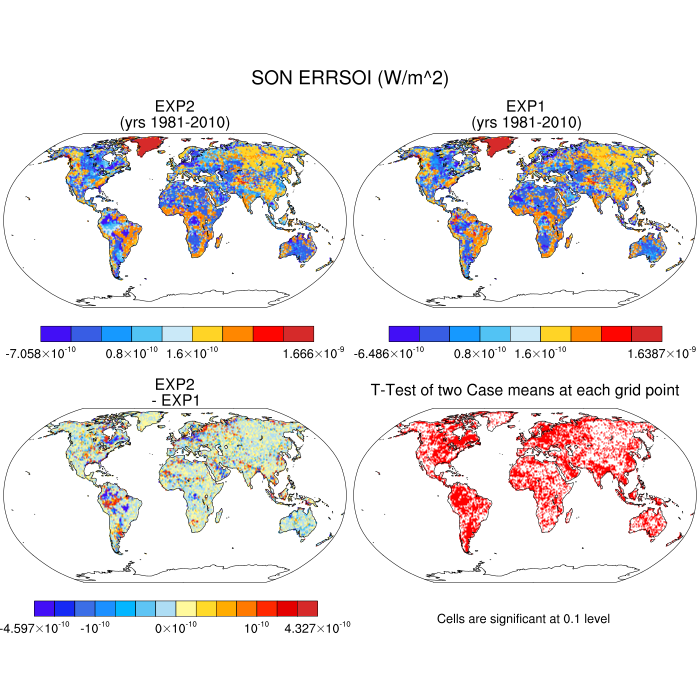
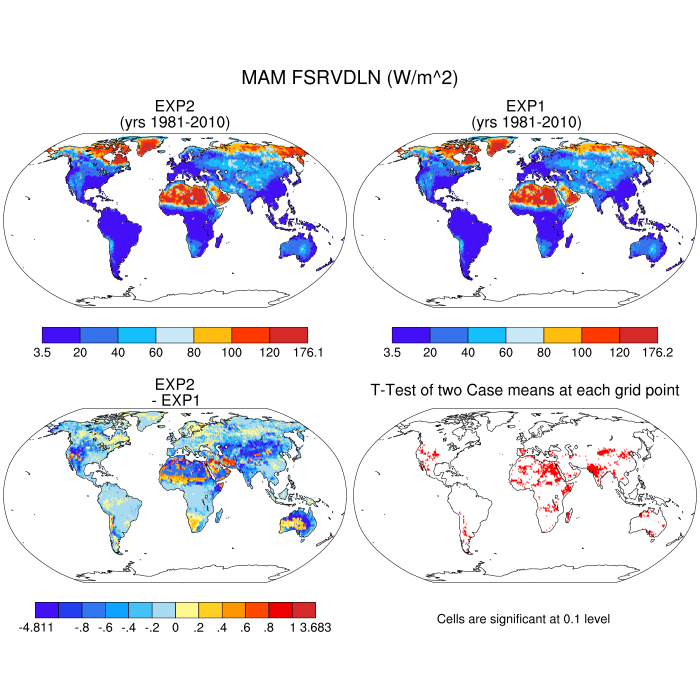
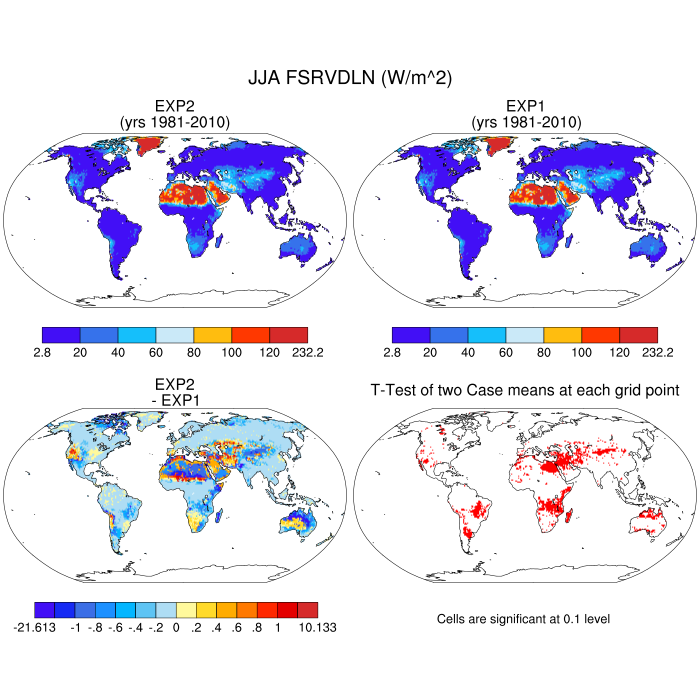
Set 2 Description: Horizontal contour plots of DJF, MAM, JJA, SON, and ANN means
Lookup Table: Set 2 Variable Definition
| Willmott-Matsuura | DJF | MAM | JJA | SON | ANN | |
|---|---|---|---|---|---|---|
| TSA | 2m air temperature | plot | plot | plot | plot | plot |
| PREC | ppt: rain+snow | plot | plot | plot | plot | plot |
| GRDC | ||||||
| TOTRUNOFF | Total Liquid Runoff | plot | plot | plot | plot | plot |
| USAF/ETAC - FOSTERDAVY | ||||||
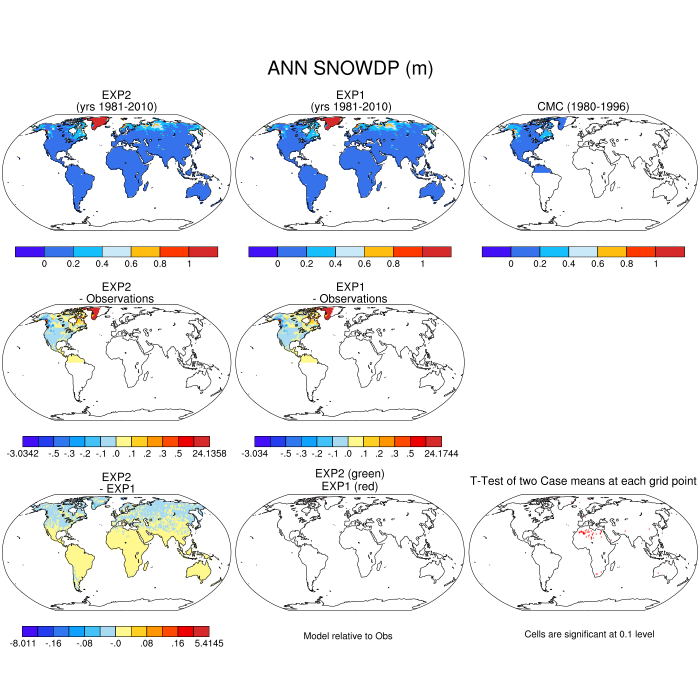
| SNOWDP | snow height | plot | plot | plot | plot | plot |
| CMC | ||||||
| SNOWDP | snow height | plot | plot | plot | plot | plot |
| H2OSNO | total snow water equiv (SNOWICE + SNOWLIQ) | plot | plot | plot | plot | plot |
| NOAA-AVHRR | ||||||
| FSNO | fraction of ground covered by snow | plot | plot | plot | plot | plot |
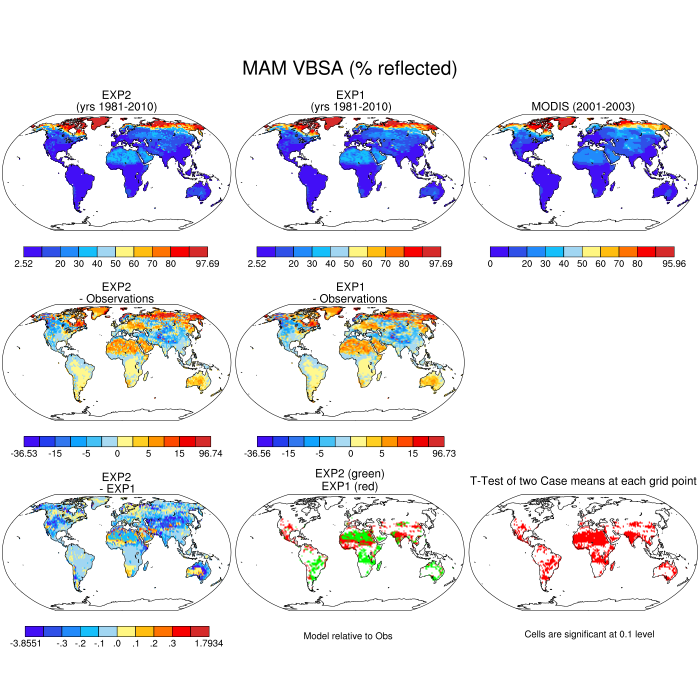
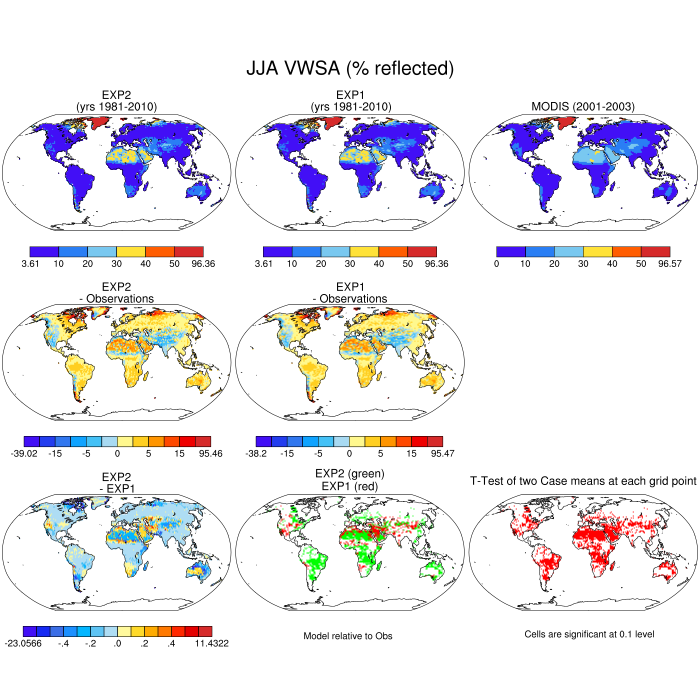
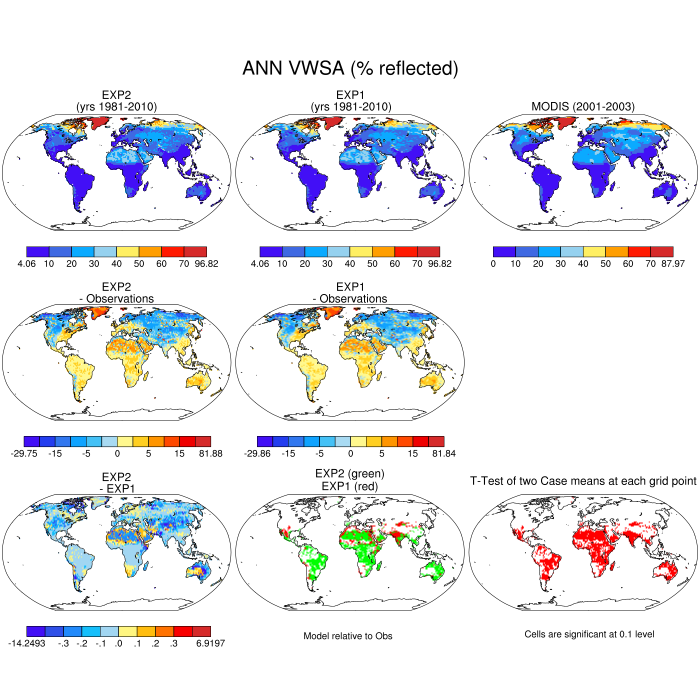
| MODIS | ||||||
| VBSA | visible black-sky albedo | plot | plot | plot | plot | plot |
| NBSA | near-IR black-sky albedo | plot | plot | plot | plot | plot |
| VWSA | visible white-sky albedo | plot | plot | plot | plot | plot |
| NWSA | near-IR white-sky albedo | plot | plot | plot | plot | plot |
| ASA | all-sky albedo:FSR/FSDS | plot | plot | plot | plot | plot |
| FLUXNET | ||||||
| LHEAT | latent heat:FCTR+FCEV+FGEV | plot | plot | plot | plot | plot |
| FPSN | photosynthesis | plot | plot | plot | plot | plot |
| MODIS | ||||||
| TLAI | total one-sided leaf area index | plot | plot | plot | plot | plot |
| Model Only | DJF | MAM | JJA | SON | ANN | |
| ASA | all-sky albedo:FSR/FSDS | plot | plot | plot | plot | plot |
| RNET | net radiation:fsa-fira | plot | plot | plot | plot | plot |
| FPSN | photosynthesis | plot | plot | plot | plot | plot |
| FSH | sensible heat | plot | plot | plot | plot | plot |
| FSH_V | sensible heat from vegetation | plot | plot | plot | plot | plot |
| FSH_G | sensible heat from ground | plot | plot | plot | plot | plot |
| FSH_TO_COUPLER | sensible heat sent to coupler | plot | plot | plot | plot | plot |
| FSH_PRECIP_CONVERSION | SHF from conv of rain/snow atm forcing | plot | plot | plot | plot | plot |
| FSH_RUNOFF_ICE_TO_LIQ | SHF from conv of ice runoff to liquid | plot | plot | plot | plot | plot |
| CPL_ENERGY_BAL | Coupler Energy Balance (Land Area) | plot | plot | plot | plot | plot |
| TV | vegetation temperature | plot | plot | plot | plot | plot |
| TG | ground temperature | plot | plot | plot | plot | plot |
| FSA | absorbed solar radiation | plot | plot | plot | plot | plot |
| SABV | solar rad absorbed by vegetation | plot | plot | plot | plot | plot |
| SABG | solar rad absorbed by ground | plot | plot | plot | plot | plot |
| FSR | reflected solar radiation | plot | plot | plot | plot | plot |
| FIRA | net infrared (longwave) radiation | plot | plot | plot | plot | plot |
| FIRE | emitted infrared (longwave) radiation | plot | plot | plot | plot | plot |
| FCTR | canopy transpiration | plot | plot | plot | plot | plot |
| FCEV | canopy evaporation | plot | plot | plot | plot | plot |
| FGEV | ground evaporation | plot | plot | plot | plot | plot |
| FGR | heat flux into snow/soil (includes snow melt) | plot | plot | plot | plot | plot |
| FSM | snow melt heat flux | plot | plot | plot | plot | plot |
| FGNET | net ground heat flux:fgr-fsm | plot | plot | plot | plot | plot |
| TAUX | zonal surface stress | plot | plot | plot | plot | plot |
| TAUY | meridional surface stress | plot | plot | plot | plot | plot |
| ELAI | exposed one-sided leaf area index | plot | plot | plot | plot | plot |
| ESAI | exposed one-sided stem area index | plot | plot | plot | plot | plot |
| TSAI | total one-sided stem area index | plot | plot | plot | plot | plot |
| LAISUN | Sunlit Projected Leaf Area Index | plot | plot | plot | plot | plot |
| LAISHA | Shaded Projected Leaf Area Index | plot | plot | plot | plot | plot |
| BTRAN | transpiration beta factor | plot | plot | plot | plot | plot |
| H2OCAN | intercepted water | plot | plot | plot | plot | plot |
| SNOWLIQ | snow liquid water | plot | plot | plot | plot | plot |
| SNOWICE | snow ice | plot | plot | plot | plot | plot |
| QINFL | infiltration | plot | plot | plot | plot | plot |
| QOVER | surface runoff | plot | plot | plot | plot | plot |
| QRGWL | surface runoff at glaciers, wetlands, lakes | plot | plot | plot | plot | plot |
| QDRAI | sub-surface drainage | plot | plot | plot | plot | plot |
| QINTR | interception | plot | plot | plot | plot | plot |
| QDRIP | throughfall | plot | plot | plot | plot | plot |
| QSNOMELT | snow melt | plot | plot | plot | plot | plot |
| QSOIL | ground evaporation | plot | plot | plot | plot | plot |
| QVEGE | canopy evaporation | plot | plot | plot | plot | plot |
| QVEGT | canopy transpiration | plot | plot | plot | plot | plot |
| ERRSOI | soil/lake energy conservation error | plot | plot | plot | plot | plot |
| ERRSEB | surface energy conservation error | plot | plot | plot | plot | plot |
| ERRSOL | solar radiation conservation error | plot | plot | plot | plot | plot |
| ERRH2O | total water conservation error | plot | plot | plot | plot | plot |
| RAIN | atmospheric rain | plot | plot | plot | plot | plot |
| SNOW | atmospheric snow | plot | plot | plot | plot | plot |
| TBOT | atmospheric air temperature | plot | plot | plot | plot | plot |
| TLAKE (1) | lake temperature | plot | plot | plot | plot | plot |
| TLAKE (5) | lake temperature | plot | plot | plot | plot | plot |
| TLAKE (10) | lake temperature | plot | plot | plot | plot | plot |
| WIND | atmospheric wind velocity magnitude | plot | plot | plot | plot | plot |
| THBOT | atmospheric air potential temperature | plot | plot | plot | plot | plot |
| QBOT | atmospheric specific humidity | plot | plot | plot | plot | plot |
| ZBOT | atmospheric reference height | plot | plot | plot | plot | plot |
| FLDS | atmospheric longwave radiation | plot | plot | plot | plot | plot |
| FSDS | atmospheric incident solar radiation | plot | plot | plot | plot | plot |
| FSDSND | direct nir incident solar radiation | plot | plot | plot | plot | plot |
| FSDSNDLN | direct nir incident solar radiation at local noon | plot | plot | plot | plot | plot |
| FSDSNI | diffuse nir incident solar radiation | plot | plot | plot | plot | plot |
| FSDSVD | direct vis incident solar radiation | plot | plot | plot | plot | plot |
| FSDSVDLN | direct vis incident solar radiation at local noon | plot | plot | plot | plot | plot |
| FSDSVI | diffuse vis incident solar radiation | plot | plot | plot | plot | plot |
| FSRND | direct nir reflected solar radiation | plot | plot | plot | plot | plot |
| FSRNDLN | direct nir reflected solar radiation at local noon | plot | plot | plot | plot | plot |
| FSRNI | diffuse nir reflected solar radiation | plot | plot | plot | plot | plot |
| FSRVD | direct vis reflected solar radiation | plot | plot | plot | plot | plot |
| FSRVDLN | direct vis reflected solar radiation at local noon | plot | plot | plot | plot | plot |
| FSRVI | diffuse vis reflected solar radiation | plot | plot | plot | plot | plot |
| Q2M | 2m specific humidity | plot | plot | plot | plot | plot |
| RH2M | 2m relative humidity | plot | plot | plot | plot | plot |
| TREFMNAV | daily minimum of average 2m temperature | plot | plot | plot | plot | plot |
| TREFMXAV | daily maximum of average 2m temperature | plot | plot | plot | plot | plot |
| VBSA | visible black-sky albedo | plot | plot | plot | plot | plot |
| NBSA | near-IR black-sky albedo | plot | plot | plot | plot | plot |
| VWSA | visible white-sky albedo | plot | plot | plot | plot | plot |
| NWSA | near-IR white-sky albedo | plot | plot | plot | plot | plot |
| SOILLIQ (1) | soil liquid water | plot | plot | plot | plot | plot |
| SOILLIQ (5) | soil liquid water | plot | plot | plot | plot | plot |
| SOILLIQ (10) | soil liquid water | plot | plot | plot | plot | plot |
| SOILICE (1) | soil ice | plot | plot | plot | plot | plot |
| SOILICE (5) | soil ice | plot | plot | plot | plot | plot |
| SOILICE (10) | soil ice | plot | plot | plot | plot | plot |
| H2OSOI (1) | volumetric soil water | plot | plot | plot | plot | plot |
| H2OSOI (5) | volumetric soil water | plot | plot | plot | plot | plot |
| H2OSOI (10) | volumetric soil water | plot | plot | plot | plot | plot |
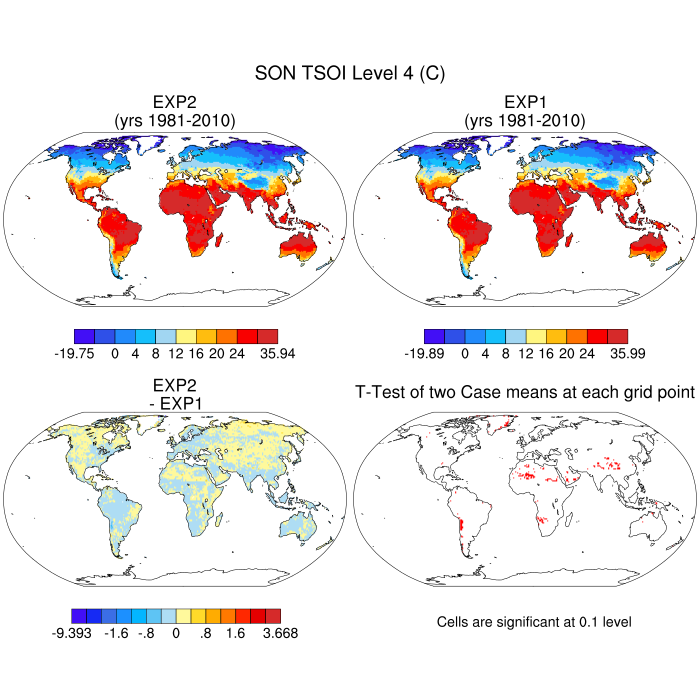
| TSOI (1) | soil temperature | plot | plot | plot | plot | plot |
| TSOI (5) | soil temperature | plot | plot | plot | plot | plot |
| TSOI (10) | soil temperature | plot | plot | plot | plot | plot |
| EVAPFRAC | LHEAT/(LHEAT+FSH) | plot | plot | plot | plot | plot |
| XIM | moisture index | plot | plot | plot | plot | plot |
| P-E | PREC-ET | plot | plot | plot | plot | plot |
| WA | water in the unconfined aquifer | plot | plot | plot | plot | plot |
| ZWT | water table depth | plot | plot | plot | plot | plot |
| TWS | total water storage | plot | plot | plot | plot | plot |
| VOLR | river channel total water storage | plot | plot | plot | plot | plot |
| QCHARGE | aquifer recharge rate | plot | plot | plot | plot | plot |
| FCOV | fractional area with water table at surface | plot | plot | plot | plot | plot |
| PCO2 | partial pressure of CO2 | plot | plot | plot | plot | plot |
| DSTDEP | total dust deposition (dry+wet) from atmosphere | plot | plot | plot | plot | plot |
| DSTFLXT | total surface dust emission | plot | plot | plot | plot | plot |
| OCDEP | total OC deposition (dry+wet) from atmosphere | plot | plot | plot | plot | plot |
| BCDEP | total BC deposition (dry+wet) from atmosphere | plot | plot | plot | plot | plot |
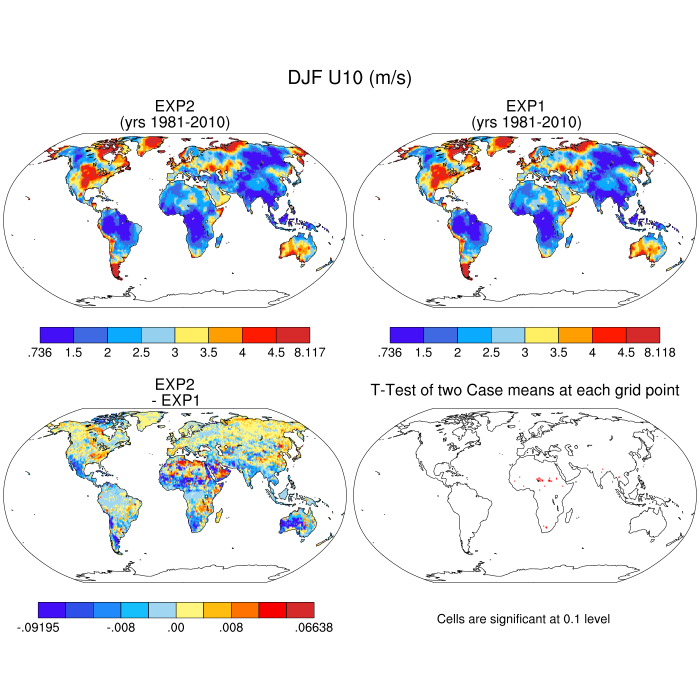
| U10 | 10-m wind | plot | plot | plot | plot | plot |
| PCT_BSOIL_PFT | Percent Bare Soil on Natural Veg Landunit | plot | plot | plot | plot | plot |
| PCT_TREE_PFT | Percent Tree on Natural Veg Landunit | plot | plot | plot | plot | plot |
| PCT_GRASS_PFT | Percent Grass on Natural Veg Landunit | plot | plot | plot | plot | plot |
| PCT_SHRUB_PFT | Percent Shrub on Natural Veg Landunit | plot | plot | plot | plot | plot |
| PCT_CROP_PFT | Percent Crop on Natural Veg Landunit or Gridcell (CropModel) | plot | plot | plot | plot | plot |