Mean State
Download Data |
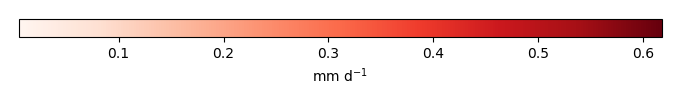
Period Mean (original grids) [mm d-1] |
Model Period Mean (intersection) [mm d-1] |
Model Period Mean (complement) [mm d-1] |
Benchmark Period Mean (intersection) [mm d-1] |
Benchmark Period Mean (complement) [mm d-1] |
Bias [mm d-1] |
RMSE [mm d-1] |
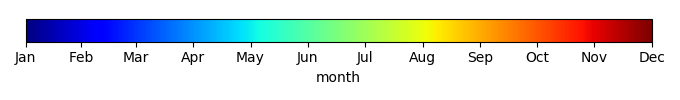
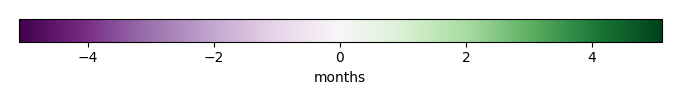
Phase Shift [months] |
Bias Score [1] |
RMSE Score [1] |
Seasonal Cycle Score [1] |
Spatial Distribution Score [1] |
Interannual Variability Score [1] |
Overall Score [1] |
|||
|---|---|---|---|---|---|---|---|---|---|---|---|---|---|---|---|---|---|
| Benchmark | [-] | 2.07 | |||||||||||||||
| Calib | [-] | 2.15 | 2.17 | 1.91 | 2.07 | 1.64 | 0.0780 | 0.643 | 1.69 | 0.621 | 0.336 | 0.702 | 0.983 | 0.684 | 0.610 | ||
| Control | [-] | 2.60 | 2.63 | 2.22 | 2.07 | 1.64 | 0.526 | 0.846 | 2.10 | 0.357 | 0.320 | 0.615 | 0.941 | 0.682 | 0.539 |
Download Data |
Period Mean (original grids) [mm d-1] |
Model Period Mean (intersection) [mm d-1] |
Model Period Mean (complement) [mm d-1] |
Benchmark Period Mean (intersection) [mm d-1] |
Benchmark Period Mean (complement) [mm d-1] |
Bias [mm d-1] |
RMSE [mm d-1] |
Phase Shift [months] |
Bias Score [1] |
RMSE Score [1] |
Seasonal Cycle Score [1] |
Spatial Distribution Score [1] |
Interannual Variability Score [1] |
Overall Score [1] |
|||
|---|---|---|---|---|---|---|---|---|---|---|---|---|---|---|---|---|---|
| Benchmark | [-] | 1.48 | |||||||||||||||
| Calib | [-] | 1.51 | 1.48 | 1.75 | 1.48 | 2.05 | -0.000807 | 0.637 | 0.541 | 0.756 | 0.475 | 0.920 | 0.938 | 0.749 | 0.719 | ||
| Control | [-] | 1.84 | 1.81 | 1.91 | 1.48 | 2.05 | 0.326 | 0.695 | 0.712 | 0.620 | 0.485 | 0.871 | 0.897 | 0.775 | 0.689 |
Download Data |
Period Mean (original grids) [mm d-1] |
Model Period Mean (intersection) [mm d-1] |
Model Period Mean (complement) [mm d-1] |
Benchmark Period Mean (intersection) [mm d-1] |
Benchmark Period Mean (complement) [mm d-1] |
Bias [mm d-1] |
RMSE [mm d-1] |
Phase Shift [months] |
Bias Score [1] |
RMSE Score [1] |
Seasonal Cycle Score [1] |
Spatial Distribution Score [1] |
Interannual Variability Score [1] |
Overall Score [1] |
|||
|---|---|---|---|---|---|---|---|---|---|---|---|---|---|---|---|---|---|
| Benchmark | [-] | 1.64 | |||||||||||||||
| Calib | [-] | 1.56 | 1.55 | 1.79 | 1.65 | 1.47 | -0.0964 | 0.677 | 0.853 | 0.652 | 0.488 | 0.894 | 0.947 | 0.718 | 0.698 | ||
| Control | [-] | 1.93 | 1.93 | 2.02 | 1.65 | 1.47 | 0.273 | 0.726 | 0.956 | 0.593 | 0.503 | 0.871 | 0.885 | 0.723 | 0.680 |
Download Data |
Period Mean (original grids) [mm d-1] |
Model Period Mean (intersection) [mm d-1] |
Model Period Mean (complement) [mm d-1] |
Benchmark Period Mean (intersection) [mm d-1] |
Benchmark Period Mean (complement) [mm d-1] |
Bias [mm d-1] |
RMSE [mm d-1] |
Phase Shift [months] |
Bias Score [1] |
RMSE Score [1] |
Seasonal Cycle Score [1] |
Spatial Distribution Score [1] |
Interannual Variability Score [1] |
Overall Score [1] |
|||
|---|---|---|---|---|---|---|---|---|---|---|---|---|---|---|---|---|---|
| Benchmark | [-] | 0.536 | |||||||||||||||
| Calib | [-] | 0.474 | 0.478 | 0.368 | 0.540 | 0.307 | -0.0679 | 0.427 | 0.604 | 0.854 | 0.540 | 0.960 | 0.951 | 0.752 | 0.766 | ||
| Control | [-] | 0.490 | 0.493 | 0.376 | 0.540 | 0.307 | -0.0527 | 0.433 | 0.660 | 0.854 | 0.539 | 0.956 | 0.928 | 0.782 | 0.766 |
Download Data |
Period Mean (original grids) [mm d-1] |
Model Period Mean (intersection) [mm d-1] |
Model Period Mean (complement) [mm d-1] |
Benchmark Period Mean (intersection) [mm d-1] |
Benchmark Period Mean (complement) [mm d-1] |
Bias [mm d-1] |
RMSE [mm d-1] |
Phase Shift [months] |
Bias Score [1] |
RMSE Score [1] |
Seasonal Cycle Score [1] |
Spatial Distribution Score [1] |
Interannual Variability Score [1] |
Overall Score [1] |
|||
|---|---|---|---|---|---|---|---|---|---|---|---|---|---|---|---|---|---|
| Benchmark | [-] | 2.98 | |||||||||||||||
| Calib | [-] | 3.22 | 3.21 | 3.25 | 3.08 | 2.11 | 0.163 | 0.896 | 2.22 | 0.362 | 0.338 | 0.640 | 0.379 | 0.664 | 0.454 | ||
| Control | [-] | 3.64 | 3.64 | 3.67 | 3.08 | 2.11 | 0.586 | 0.958 | 2.38 | 0.395 | 0.324 | 0.603 | 0.338 | 0.700 | 0.447 |
Download Data |
Period Mean (original grids) [mm d-1] |
Model Period Mean (intersection) [mm d-1] |
Model Period Mean (complement) [mm d-1] |
Benchmark Period Mean (intersection) [mm d-1] |
Benchmark Period Mean (complement) [mm d-1] |
Bias [mm d-1] |
RMSE [mm d-1] |
Phase Shift [months] |
Bias Score [1] |
RMSE Score [1] |
Seasonal Cycle Score [1] |
Spatial Distribution Score [1] |
Interannual Variability Score [1] |
Overall Score [1] |
|||
|---|---|---|---|---|---|---|---|---|---|---|---|---|---|---|---|---|---|
| Benchmark | [-] | 1.00 | |||||||||||||||
| Calib | [-] | 0.856 | 0.856 | 0.856 | 1.01 | 0.630 | -0.147 | 0.466 | 0.428 | 0.833 | 0.639 | 0.971 | 0.990 | 0.790 | 0.810 | ||
| Control | [-] | 0.875 | 0.873 | 0.815 | 1.01 | 0.630 | -0.132 | 0.480 | 0.478 | 0.835 | 0.632 | 0.968 | 0.973 | 0.827 | 0.811 |
Download Data |
Period Mean (original grids) [mm d-1] |
Model Period Mean (intersection) [mm d-1] |
Model Period Mean (complement) [mm d-1] |
Benchmark Period Mean (intersection) [mm d-1] |
Benchmark Period Mean (complement) [mm d-1] |
Bias [mm d-1] |
RMSE [mm d-1] |
Phase Shift [months] |
Bias Score [1] |
RMSE Score [1] |
Seasonal Cycle Score [1] |
Spatial Distribution Score [1] |
Interannual Variability Score [1] |
Overall Score [1] |
|||
|---|---|---|---|---|---|---|---|---|---|---|---|---|---|---|---|---|---|
| Benchmark | [-] | 0.939 | |||||||||||||||
| Calib | [-] | 0.802 | 0.799 | 1.32 | 0.942 | 0.755 | -0.119 | 0.416 | 0.517 | 0.722 | 0.605 | 0.965 | 0.969 | 0.700 | 0.761 | ||
| Control | [-] | 0.897 | 0.894 | 1.38 | 0.942 | 0.755 | -0.0238 | 0.429 | 0.536 | 0.745 | 0.590 | 0.963 | 0.968 | 0.709 | 0.761 |
Download Data |
Period Mean (original grids) [mm d-1] |
Model Period Mean (intersection) [mm d-1] |
Model Period Mean (complement) [mm d-1] |
Benchmark Period Mean (intersection) [mm d-1] |
Benchmark Period Mean (complement) [mm d-1] |
Bias [mm d-1] |
RMSE [mm d-1] |
Phase Shift [months] |
Bias Score [1] |
RMSE Score [1] |
Seasonal Cycle Score [1] |
Spatial Distribution Score [1] |
Interannual Variability Score [1] |
Overall Score [1] |
|||
|---|---|---|---|---|---|---|---|---|---|---|---|---|---|---|---|---|---|
| Benchmark | [-] | 1.65 | |||||||||||||||
| Calib | [-] | 1.94 | 1.92 | 2.53 | 1.65 | 1.88 | 0.351 | 0.753 | 1.41 | 0.556 | 0.413 | 0.747 | 0.974 | 0.701 | 0.634 | ||
| Control | [-] | 2.24 | 2.22 | 2.89 | 1.65 | 1.88 | 0.651 | 0.952 | 1.52 | 0.430 | 0.382 | 0.727 | 0.957 | 0.724 | 0.600 |
Download Data |
Period Mean (original grids) [mm d-1] |
Model Period Mean (intersection) [mm d-1] |
Model Period Mean (complement) [mm d-1] |
Benchmark Period Mean (intersection) [mm d-1] |
Benchmark Period Mean (complement) [mm d-1] |
Bias [mm d-1] |
RMSE [mm d-1] |
Phase Shift [months] |
Bias Score [1] |
RMSE Score [1] |
Seasonal Cycle Score [1] |
Spatial Distribution Score [1] |
Interannual Variability Score [1] |
Overall Score [1] |
|||
|---|---|---|---|---|---|---|---|---|---|---|---|---|---|---|---|---|---|
| Benchmark | [-] | 0.539 | |||||||||||||||
| Calib | [-] | 0.505 | 0.514 | 0.347 | 0.541 | 0.253 | -0.0381 | 0.495 | 0.305 | 0.879 | 0.494 | 0.978 | 0.989 | 0.669 | 0.751 | ||
| Control | [-] | 0.516 | 0.525 | 0.367 | 0.541 | 0.253 | -0.0270 | 0.506 | 0.315 | 0.872 | 0.490 | 0.977 | 0.988 | 0.692 | 0.752 |
Download Data |
Period Mean (original grids) [mm d-1] |
Model Period Mean (intersection) [mm d-1] |
Model Period Mean (complement) [mm d-1] |
Benchmark Period Mean (intersection) [mm d-1] |
Benchmark Period Mean (complement) [mm d-1] |
Bias [mm d-1] |
RMSE [mm d-1] |
Phase Shift [months] |
Bias Score [1] |
RMSE Score [1] |
Seasonal Cycle Score [1] |
Spatial Distribution Score [1] |
Interannual Variability Score [1] |
Overall Score [1] |
|||
|---|---|---|---|---|---|---|---|---|---|---|---|---|---|---|---|---|---|
| Benchmark | [-] | 1.17 | |||||||||||||||
| Calib | [-] | 0.924 | 0.902 | 1.79 | 1.17 | 1.56 | -0.211 | 0.480 | 0.706 | 0.640 | 0.593 | 0.920 | 0.976 | 0.755 | 0.746 | ||
| Control | [-] | 1.15 | 1.13 | 2.09 | 1.17 | 1.56 | 0.0185 | 0.414 | 0.647 | 0.759 | 0.608 | 0.930 | 0.970 | 0.767 | 0.774 |
Download Data |
Period Mean (original grids) [mm d-1] |
Model Period Mean (intersection) [mm d-1] |
Model Period Mean (complement) [mm d-1] |
Benchmark Period Mean (intersection) [mm d-1] |
Benchmark Period Mean (complement) [mm d-1] |
Bias [mm d-1] |
RMSE [mm d-1] |
Phase Shift [months] |
Bias Score [1] |
RMSE Score [1] |
Seasonal Cycle Score [1] |
Spatial Distribution Score [1] |
Interannual Variability Score [1] |
Overall Score [1] |
|||
|---|---|---|---|---|---|---|---|---|---|---|---|---|---|---|---|---|---|
| Benchmark | [-] | 1.10 | |||||||||||||||
| Calib | [-] | 1.14 | 1.14 | 1.13 | 1.10 | 0.739 | 0.0385 | 0.420 | 0.456 | 0.839 | 0.666 | 0.971 | 0.986 | 0.754 | 0.814 | ||
| Control | [-] | 1.19 | 1.19 | 1.14 | 1.10 | 0.739 | 0.0843 | 0.445 | 0.489 | 0.807 | 0.658 | 0.970 | 0.976 | 0.762 | 0.805 |
Download Data |
Period Mean (original grids) [mm d-1] |
Model Period Mean (intersection) [mm d-1] |
Model Period Mean (complement) [mm d-1] |
Benchmark Period Mean (intersection) [mm d-1] |
Benchmark Period Mean (complement) [mm d-1] |
Bias [mm d-1] |
RMSE [mm d-1] |
Phase Shift [months] |
Bias Score [1] |
RMSE Score [1] |
Seasonal Cycle Score [1] |
Spatial Distribution Score [1] |
Interannual Variability Score [1] |
Overall Score [1] |
|||
|---|---|---|---|---|---|---|---|---|---|---|---|---|---|---|---|---|---|
| Benchmark | [-] | 1.18 | |||||||||||||||
| Calib | [-] | 1.07 | 1.06 | 1.40 | 1.17 | 1.30 | -0.0828 | 0.490 | 0.932 | 0.621 | 0.496 | 0.834 | 0.978 | 0.709 | 0.689 | ||
| Control | [-] | 1.23 | 1.23 | 1.56 | 1.17 | 1.30 | 0.0797 | 0.514 | 0.979 | 0.626 | 0.484 | 0.817 | 0.964 | 0.725 | 0.683 |
Download Data |
Period Mean (original grids) [mm d-1] |
Model Period Mean (intersection) [mm d-1] |
Model Period Mean (complement) [mm d-1] |
Benchmark Period Mean (intersection) [mm d-1] |
Benchmark Period Mean (complement) [mm d-1] |
Bias [mm d-1] |
RMSE [mm d-1] |
Phase Shift [months] |
Bias Score [1] |
RMSE Score [1] |
Seasonal Cycle Score [1] |
Spatial Distribution Score [1] |
Interannual Variability Score [1] |
Overall Score [1] |
|||
|---|---|---|---|---|---|---|---|---|---|---|---|---|---|---|---|---|---|
| Benchmark | [-] | 0.283 | |||||||||||||||
| Calib | [-] | 0.237 | 0.238 | 0.402 | 0.278 | 0.924 | -0.0290 | 0.259 | 1.09 | 0.649 | 0.455 | 0.874 | 0.918 | 0.648 | 0.667 | ||
| Control | [-] | 0.295 | 0.296 | 0.494 | 0.278 | 0.924 | 0.0308 | 0.270 | 1.09 | 0.631 | 0.449 | 0.878 | 0.918 | 0.696 | 0.670 |
Download Data |
Period Mean (original grids) [mm d-1] |
Model Period Mean (intersection) [mm d-1] |
Model Period Mean (complement) [mm d-1] |
Benchmark Period Mean (intersection) [mm d-1] |
Benchmark Period Mean (complement) [mm d-1] |
Bias [mm d-1] |
RMSE [mm d-1] |
Phase Shift [months] |
Bias Score [1] |
RMSE Score [1] |
Seasonal Cycle Score [1] |
Spatial Distribution Score [1] |
Interannual Variability Score [1] |
Overall Score [1] |
|||
|---|---|---|---|---|---|---|---|---|---|---|---|---|---|---|---|---|---|
| Benchmark | [-] | 0.532 | |||||||||||||||
| Calib | [-] | 0.466 | 0.469 | 0.303 | 0.535 | 0.321 | -0.0810 | 0.418 | 0.416 | 0.795 | 0.552 | 0.971 | 0.976 | 0.711 | 0.759 | ||
| Control | [-] | 0.503 | 0.506 | 0.332 | 0.535 | 0.321 | -0.0454 | 0.450 | 0.359 | 0.803 | 0.530 | 0.975 | 0.976 | 0.708 | 0.754 |
Download Data |
Period Mean (original grids) [mm d-1] |
Model Period Mean (intersection) [mm d-1] |
Model Period Mean (complement) [mm d-1] |
Benchmark Period Mean (intersection) [mm d-1] |
Benchmark Period Mean (complement) [mm d-1] |
Bias [mm d-1] |
RMSE [mm d-1] |
Phase Shift [months] |
Bias Score [1] |
RMSE Score [1] |
Seasonal Cycle Score [1] |
Spatial Distribution Score [1] |
Interannual Variability Score [1] |
Overall Score [1] |
|||
|---|---|---|---|---|---|---|---|---|---|---|---|---|---|---|---|---|---|
| Benchmark | [-] | 1.80 | |||||||||||||||
| Calib | [-] | 1.78 | 1.78 | 1.98 | 1.81 | 1.69 | 0.0693 | 0.889 | 1.05 | 0.560 | 0.444 | 0.855 | 0.883 | 0.675 | 0.644 | ||
| Control | [-] | 2.12 | 2.12 | 2.34 | 1.81 | 1.69 | 0.420 | 0.957 | 1.01 | 0.554 | 0.440 | 0.856 | 0.842 | 0.663 | 0.632 |
Download Data |
Period Mean (original grids) [mm d-1] |
Model Period Mean (intersection) [mm d-1] |
Model Period Mean (complement) [mm d-1] |
Benchmark Period Mean (intersection) [mm d-1] |
Benchmark Period Mean (complement) [mm d-1] |
Bias [mm d-1] |
RMSE [mm d-1] |
Phase Shift [months] |
Bias Score [1] |
RMSE Score [1] |
Seasonal Cycle Score [1] |
Spatial Distribution Score [1] |
Interannual Variability Score [1] |
Overall Score [1] |
|||
|---|---|---|---|---|---|---|---|---|---|---|---|---|---|---|---|---|---|
| Benchmark | [-] | 1.98 | |||||||||||||||
| Calib | [-] | 1.71 | 1.71 | 1.83 | 1.99 | 1.71 | -0.250 | 0.607 | 0.312 | 0.732 | 0.656 | 0.975 | 0.979 | 0.774 | 0.795 | ||
| Control | [-] | 1.83 | 1.84 | 1.88 | 1.99 | 1.71 | -0.124 | 0.592 | 0.297 | 0.787 | 0.644 | 0.977 | 0.957 | 0.784 | 0.799 |
Download Data |
Period Mean (original grids) [mm d-1] |
Model Period Mean (intersection) [mm d-1] |
Model Period Mean (complement) [mm d-1] |
Benchmark Period Mean (intersection) [mm d-1] |
Benchmark Period Mean (complement) [mm d-1] |
Bias [mm d-1] |
RMSE [mm d-1] |
Phase Shift [months] |
Bias Score [1] |
RMSE Score [1] |
Seasonal Cycle Score [1] |
Spatial Distribution Score [1] |
Interannual Variability Score [1] |
Overall Score [1] |
|||
|---|---|---|---|---|---|---|---|---|---|---|---|---|---|---|---|---|---|
| Benchmark | [-] | 1.20 | |||||||||||||||
| Calib | [-] | 0.982 | 0.983 | 1.22 | 1.20 | 0.911 | -0.213 | 0.533 | 0.555 | 0.730 | 0.632 | 0.961 | 0.864 | 0.702 | 0.753 | ||
| Control | [-] | 1.00 | 1.00 | 1.15 | 1.20 | 0.911 | -0.198 | 0.586 | 0.599 | 0.719 | 0.615 | 0.958 | 0.810 | 0.690 | 0.735 |
Download Data |
Period Mean (original grids) [mm d-1] |
Model Period Mean (intersection) [mm d-1] |
Model Period Mean (complement) [mm d-1] |
Benchmark Period Mean (intersection) [mm d-1] |
Benchmark Period Mean (complement) [mm d-1] |
Bias [mm d-1] |
RMSE [mm d-1] |
Phase Shift [months] |
Bias Score [1] |
RMSE Score [1] |
Seasonal Cycle Score [1] |
Spatial Distribution Score [1] |
Interannual Variability Score [1] |
Overall Score [1] |
|||
|---|---|---|---|---|---|---|---|---|---|---|---|---|---|---|---|---|---|
| Benchmark | [-] | 1.11 | |||||||||||||||
| Calib | [-] | 0.795 | 0.805 | 0.945 | 1.11 | 1.14 | -0.290 | 0.502 | 0.564 | 0.621 | 0.600 | 0.955 | 0.906 | 0.709 | 0.732 | ||
| Control | [-] | 0.915 | 0.929 | 1.06 | 1.11 | 1.14 | -0.169 | 0.501 | 0.689 | 0.702 | 0.562 | 0.946 | 0.884 | 0.653 | 0.718 |
Download Data |
Period Mean (original grids) [mm d-1] |
Model Period Mean (intersection) [mm d-1] |
Model Period Mean (complement) [mm d-1] |
Benchmark Period Mean (intersection) [mm d-1] |
Benchmark Period Mean (complement) [mm d-1] |
Bias [mm d-1] |
RMSE [mm d-1] |
Phase Shift [months] |
Bias Score [1] |
RMSE Score [1] |
Seasonal Cycle Score [1] |
Spatial Distribution Score [1] |
Interannual Variability Score [1] |
Overall Score [1] |
|||
|---|---|---|---|---|---|---|---|---|---|---|---|---|---|---|---|---|---|
| Benchmark | [-] | 3.25 | |||||||||||||||
| Calib | [-] | 2.93 | 2.93 | 2.74 | 3.25 | 1.70 | -0.333 | 0.817 | 2.66 | 0.370 | 0.363 | 0.536 | 0.732 | 0.698 | 0.510 | ||
| Control | [-] | 3.38 | 3.38 | 3.17 | 3.25 | 1.70 | 0.119 | 0.768 | 2.84 | 0.522 | 0.323 | 0.503 | 0.801 | 0.736 | 0.535 |
Download Data |
Period Mean (original grids) [mm d-1] |
Model Period Mean (intersection) [mm d-1] |
Model Period Mean (complement) [mm d-1] |
Benchmark Period Mean (intersection) [mm d-1] |
Benchmark Period Mean (complement) [mm d-1] |
Bias [mm d-1] |
RMSE [mm d-1] |
Phase Shift [months] |
Bias Score [1] |
RMSE Score [1] |
Seasonal Cycle Score [1] |
Spatial Distribution Score [1] |
Interannual Variability Score [1] |
Overall Score [1] |
|||
|---|---|---|---|---|---|---|---|---|---|---|---|---|---|---|---|---|---|
| Benchmark | [-] | 2.24 | |||||||||||||||
| Calib | [-] | 2.04 | 2.03 | 2.32 | 2.25 | 1.55 | -0.215 | 0.668 | 0.719 | 0.688 | 0.539 | 0.931 | 0.891 | 0.703 | 0.715 | ||
| Control | [-] | 2.37 | 2.35 | 2.68 | 2.25 | 1.55 | 0.116 | 0.640 | 0.683 | 0.719 | 0.537 | 0.933 | 0.892 | 0.722 | 0.723 |
Download Data |
Period Mean (original grids) [mm d-1] |
Model Period Mean (intersection) [mm d-1] |
Model Period Mean (complement) [mm d-1] |
Benchmark Period Mean (intersection) [mm d-1] |
Benchmark Period Mean (complement) [mm d-1] |
Bias [mm d-1] |
RMSE [mm d-1] |
Phase Shift [months] |
Bias Score [1] |
RMSE Score [1] |
Seasonal Cycle Score [1] |
Spatial Distribution Score [1] |
Interannual Variability Score [1] |
Overall Score [1] |
|||
|---|---|---|---|---|---|---|---|---|---|---|---|---|---|---|---|---|---|
| Benchmark | [-] | 0.909 | |||||||||||||||
| Calib | [-] | 0.746 | 0.744 | 0.511 | 0.907 | 0.966 | -0.174 | 0.569 | 1.07 | 0.552 | 0.503 | 0.884 | 0.943 | 0.598 | 0.664 | ||
| Control | [-] | 0.862 | 0.859 | 0.580 | 0.907 | 0.966 | -0.0656 | 0.559 | 1.04 | 0.596 | 0.500 | 0.888 | 0.937 | 0.617 | 0.673 |
Temporally integrated period mean