Mean State
Download Data |
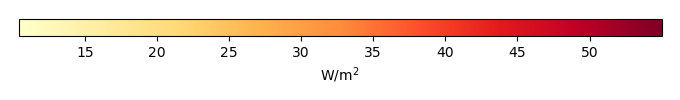
Period Mean (original grids) [W/m2] |
Model Period Mean (intersection) [W/m2] |
Model Period Mean (complement) [W/m2] |
Benchmark Period Mean (intersection) [W/m2] |
Benchmark Period Mean (complement) [W/m2] |
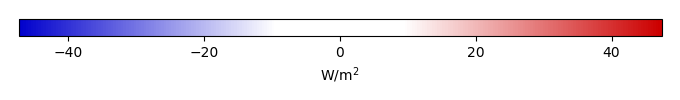
Bias [W/m2] |
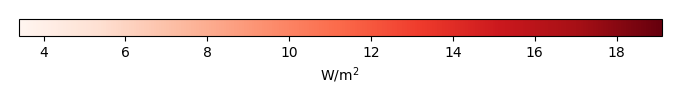
RMSE [W/m2] |
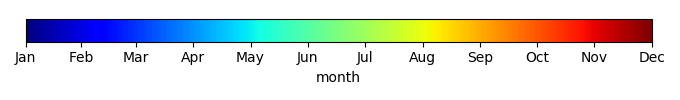
Phase Shift [months] |
Bias Score [1] |
RMSE Score [1] |
Seasonal Cycle Score [1] |
Spatial Distribution Score [1] |
Interannual Variability Score [1] |
Overall Score [1] |
|||
|---|---|---|---|---|---|---|---|---|---|---|---|---|---|---|---|---|---|
| Benchmark | [-] | 131. | |||||||||||||||
| Calib | [-] | 116. | 116. | 130. | 157. | -13.3 | 21.7 | 1.27 | 0.517 | 0.434 | 0.833 | 0.990 | 0.665 | 0.645 | |||
| Control | [-] | 118. | 118. | 130. | 157. | -11.1 | 20.8 | 1.31 | 0.563 | 0.428 | 0.825 | 0.989 | 0.678 | 0.652 |
Download Data |
Period Mean (original grids) [W/m2] |
Model Period Mean (intersection) [W/m2] |
Model Period Mean (complement) [W/m2] |
Benchmark Period Mean (intersection) [W/m2] |
Benchmark Period Mean (complement) [W/m2] |
Bias [W/m2] |
RMSE [W/m2] |
Phase Shift [months] |
Bias Score [1] |
RMSE Score [1] |
Seasonal Cycle Score [1] |
Spatial Distribution Score [1] |
Interannual Variability Score [1] |
Overall Score [1] |
|||
|---|---|---|---|---|---|---|---|---|---|---|---|---|---|---|---|---|---|
| Benchmark | [-] | 123. | |||||||||||||||
| Calib | [-] | 100. | 99.4 | 122. | 160. | -22.2 | 27.8 | 1.43 | 0.413 | 0.514 | 0.781 | 0.987 | 0.627 | 0.639 | |||
| Control | [-] | 103. | 102. | 122. | 160. | -19.5 | 25.7 | 1.37 | 0.460 | 0.514 | 0.793 | 0.989 | 0.634 | 0.651 |
Download Data |
Period Mean (original grids) [W/m2] |
Model Period Mean (intersection) [W/m2] |
Model Period Mean (complement) [W/m2] |
Benchmark Period Mean (intersection) [W/m2] |
Benchmark Period Mean (complement) [W/m2] |
Bias [W/m2] |
RMSE [W/m2] |
Phase Shift [months] |
Bias Score [1] |
RMSE Score [1] |
Seasonal Cycle Score [1] |
Spatial Distribution Score [1] |
Interannual Variability Score [1] |
Overall Score [1] |
|||
|---|---|---|---|---|---|---|---|---|---|---|---|---|---|---|---|---|---|
| Benchmark | [-] | 123. | |||||||||||||||
| Calib | [-] | 108. | 108. | 121. | 157. | -12.0 | 22.2 | 1.18 | 0.674 | 0.596 | 0.834 | 0.965 | 0.655 | 0.720 | |||
| Control | [-] | 111. | 111. | 121. | 157. | -9.49 | 21.3 | 1.38 | 0.717 | 0.591 | 0.796 | 0.966 | 0.662 | 0.720 |
Download Data |
Period Mean (original grids) [W/m2] |
Model Period Mean (intersection) [W/m2] |
Model Period Mean (complement) [W/m2] |
Benchmark Period Mean (intersection) [W/m2] |
Benchmark Period Mean (complement) [W/m2] |
Bias [W/m2] |
RMSE [W/m2] |
Phase Shift [months] |
Bias Score [1] |
RMSE Score [1] |
Seasonal Cycle Score [1] |
Spatial Distribution Score [1] |
Interannual Variability Score [1] |
Overall Score [1] |
|||
|---|---|---|---|---|---|---|---|---|---|---|---|---|---|---|---|---|---|
| Benchmark | [-] | 34.4 | |||||||||||||||
| Calib | [-] | 30.4 | 30.5 | 34.5 | 33.0 | -5.20 | 20.4 | 0.262 | 0.868 | 0.724 | 0.983 | 0.894 | 0.746 | 0.823 | |||
| Control | [-] | 30.2 | 30.2 | 34.5 | 33.0 | -5.48 | 20.5 | 0.262 | 0.866 | 0.724 | 0.983 | 0.895 | 0.746 | 0.823 |
Download Data |
Period Mean (original grids) [W/m2] |
Model Period Mean (intersection) [W/m2] |
Model Period Mean (complement) [W/m2] |
Benchmark Period Mean (intersection) [W/m2] |
Benchmark Period Mean (complement) [W/m2] |
Bias [W/m2] |
RMSE [W/m2] |
Phase Shift [months] |
Bias Score [1] |
RMSE Score [1] |
Seasonal Cycle Score [1] |
Spatial Distribution Score [1] |
Interannual Variability Score [1] |
Overall Score [1] |
|||
|---|---|---|---|---|---|---|---|---|---|---|---|---|---|---|---|---|---|
| Benchmark | [-] | 147. | |||||||||||||||
| Calib | [-] | 129. | 129. | 145. | 156. | -11.5 | 20.9 | 1.68 | 0.506 | 0.432 | 0.734 | 0.995 | 0.688 | 0.631 | |||
| Control | [-] | 130. | 130. | 145. | 156. | -10.3 | 20.4 | 1.71 | 0.526 | 0.431 | 0.728 | 0.995 | 0.691 | 0.634 |
Download Data |
Period Mean (original grids) [W/m2] |
Model Period Mean (intersection) [W/m2] |
Model Period Mean (complement) [W/m2] |
Benchmark Period Mean (intersection) [W/m2] |
Benchmark Period Mean (complement) [W/m2] |
Bias [W/m2] |
RMSE [W/m2] |
Phase Shift [months] |
Bias Score [1] |
RMSE Score [1] |
Seasonal Cycle Score [1] |
Spatial Distribution Score [1] |
Interannual Variability Score [1] |
Overall Score [1] |
|||
|---|---|---|---|---|---|---|---|---|---|---|---|---|---|---|---|---|---|
| Benchmark | [-] | 53.7 | |||||||||||||||
| Calib | [-] | 50.6 | 50.7 | 53.5 | 64.9 | -2.59 | 16.2 | 0.213 | 0.897 | 0.777 | 0.986 | 0.906 | 0.697 | 0.840 | |||
| Control | [-] | 49.9 | 49.9 | 53.5 | 64.9 | -3.41 | 16.2 | 0.211 | 0.897 | 0.777 | 0.986 | 0.917 | 0.697 | 0.842 |
Download Data |
Period Mean (original grids) [W/m2] |
Model Period Mean (intersection) [W/m2] |
Model Period Mean (complement) [W/m2] |
Benchmark Period Mean (intersection) [W/m2] |
Benchmark Period Mean (complement) [W/m2] |
Bias [W/m2] |
RMSE [W/m2] |
Phase Shift [months] |
Bias Score [1] |
RMSE Score [1] |
Seasonal Cycle Score [1] |
Spatial Distribution Score [1] |
Interannual Variability Score [1] |
Overall Score [1] |
|||
|---|---|---|---|---|---|---|---|---|---|---|---|---|---|---|---|---|---|
| Benchmark | [-] | 71.7 | |||||||||||||||
| Calib | [-] | 61.5 | 61.5 | 71.1 | 90.6 | -8.31 | 19.0 | 0.434 | 0.798 | 0.724 | 0.963 | 0.993 | 0.678 | 0.814 | |||
| Control | [-] | 62.3 | 62.3 | 71.1 | 90.6 | -7.50 | 18.8 | 0.441 | 0.807 | 0.723 | 0.962 | 0.991 | 0.684 | 0.815 |
Download Data |
Period Mean (original grids) [W/m2] |
Model Period Mean (intersection) [W/m2] |
Model Period Mean (complement) [W/m2] |
Benchmark Period Mean (intersection) [W/m2] |
Benchmark Period Mean (complement) [W/m2] |
Bias [W/m2] |
RMSE [W/m2] |
Phase Shift [months] |
Bias Score [1] |
RMSE Score [1] |
Seasonal Cycle Score [1] |
Spatial Distribution Score [1] |
Interannual Variability Score [1] |
Overall Score [1] |
|||
|---|---|---|---|---|---|---|---|---|---|---|---|---|---|---|---|---|---|
| Benchmark | [-] | 120. | |||||||||||||||
| Calib | [-] | 97.6 | 97.3 | 118. | 153. | -16.4 | 25.4 | 0.652 | 0.586 | 0.555 | 0.924 | 0.993 | 0.634 | 0.708 | |||
| Control | [-] | 99.6 | 99.3 | 118. | 153. | -14.5 | 24.2 | 0.669 | 0.621 | 0.555 | 0.921 | 0.993 | 0.643 | 0.715 |
Download Data |
Period Mean (original grids) [W/m2] |
Model Period Mean (intersection) [W/m2] |
Model Period Mean (complement) [W/m2] |
Benchmark Period Mean (intersection) [W/m2] |
Benchmark Period Mean (complement) [W/m2] |
Bias [W/m2] |
RMSE [W/m2] |
Phase Shift [months] |
Bias Score [1] |
RMSE Score [1] |
Seasonal Cycle Score [1] |
Spatial Distribution Score [1] |
Interannual Variability Score [1] |
Overall Score [1] |
|||
|---|---|---|---|---|---|---|---|---|---|---|---|---|---|---|---|---|---|
| Benchmark | [-] | 30.5 | |||||||||||||||
| Calib | [-] | 22.1 | 22.4 | 31.0 | 19.5 | -9.52 | 19.7 | 0.192 | 0.839 | 0.736 | 0.987 | 0.984 | 0.747 | 0.838 | |||
| Control | [-] | 21.8 | 22.1 | 31.0 | 19.5 | -9.83 | 19.9 | 0.180 | 0.835 | 0.735 | 0.988 | 0.984 | 0.747 | 0.837 |
Download Data |
Period Mean (original grids) [W/m2] |
Model Period Mean (intersection) [W/m2] |
Model Period Mean (complement) [W/m2] |
Benchmark Period Mean (intersection) [W/m2] |
Benchmark Period Mean (complement) [W/m2] |
Bias [W/m2] |
RMSE [W/m2] |
Phase Shift [months] |
Bias Score [1] |
RMSE Score [1] |
Seasonal Cycle Score [1] |
Spatial Distribution Score [1] |
Interannual Variability Score [1] |
Overall Score [1] |
|||
|---|---|---|---|---|---|---|---|---|---|---|---|---|---|---|---|---|---|
| Benchmark | [-] | 109. | |||||||||||||||
| Calib | [-] | 93.1 | 93.0 | 108. | 131. | -12.8 | 20.0 | 0.503 | 0.743 | 0.736 | 0.961 | 0.978 | 0.702 | 0.809 | |||
| Control | [-] | 95.3 | 95.3 | 108. | 131. | -10.7 | 18.6 | 0.512 | 0.775 | 0.738 | 0.960 | 0.980 | 0.721 | 0.818 |
Download Data |
Period Mean (original grids) [W/m2] |
Model Period Mean (intersection) [W/m2] |
Model Period Mean (complement) [W/m2] |
Benchmark Period Mean (intersection) [W/m2] |
Benchmark Period Mean (complement) [W/m2] |
Bias [W/m2] |
RMSE [W/m2] |
Phase Shift [months] |
Bias Score [1] |
RMSE Score [1] |
Seasonal Cycle Score [1] |
Spatial Distribution Score [1] |
Interannual Variability Score [1] |
Overall Score [1] |
|||
|---|---|---|---|---|---|---|---|---|---|---|---|---|---|---|---|---|---|
| Benchmark | [-] | 65.7 | |||||||||||||||
| Calib | [-] | 55.7 | 55.7 | 63.8 | 85.4 | -6.06 | 16.7 | 0.204 | 0.884 | 0.783 | 0.987 | 0.993 | 0.661 | 0.848 | |||
| Control | [-] | 55.8 | 55.9 | 63.8 | 85.4 | -5.90 | 16.6 | 0.225 | 0.886 | 0.783 | 0.985 | 0.995 | 0.663 | 0.849 |
Download Data |
Period Mean (original grids) [W/m2] |
Model Period Mean (intersection) [W/m2] |
Model Period Mean (complement) [W/m2] |
Benchmark Period Mean (intersection) [W/m2] |
Benchmark Period Mean (complement) [W/m2] |
Bias [W/m2] |
RMSE [W/m2] |
Phase Shift [months] |
Bias Score [1] |
RMSE Score [1] |
Seasonal Cycle Score [1] |
Spatial Distribution Score [1] |
Interannual Variability Score [1] |
Overall Score [1] |
|||
|---|---|---|---|---|---|---|---|---|---|---|---|---|---|---|---|---|---|
| Benchmark | [-] | 109. | |||||||||||||||
| Calib | [-] | 65.2 | 65.2 | 80.5 | 123. | -13.3 | 22.4 | 0.662 | 0.650 | 0.621 | 0.922 | 0.977 | 0.664 | 0.743 | |||
| Control | [-] | 66.1 | 66.1 | 80.5 | 123. | -12.4 | 21.9 | 0.678 | 0.665 | 0.620 | 0.919 | 0.976 | 0.670 | 0.745 |
Download Data |
Period Mean (original grids) [W/m2] |
Model Period Mean (intersection) [W/m2] |
Model Period Mean (complement) [W/m2] |
Benchmark Period Mean (intersection) [W/m2] |
Benchmark Period Mean (complement) [W/m2] |
Bias [W/m2] |
RMSE [W/m2] |
Phase Shift [months] |
Bias Score [1] |
RMSE Score [1] |
Seasonal Cycle Score [1] |
Spatial Distribution Score [1] |
Interannual Variability Score [1] |
Overall Score [1] |
|||
|---|---|---|---|---|---|---|---|---|---|---|---|---|---|---|---|---|---|
| Benchmark | [-] | 76.6 | |||||||||||||||
| Calib | [-] | 53.1 | 53.1 | 73.9 | 144. | -18.5 | 24.7 | 0.890 | 0.549 | 0.625 | 0.901 | 0.943 | 0.682 | 0.721 | |||
| Control | [-] | 53.8 | 53.8 | 73.9 | 144. | -17.8 | 24.3 | 0.901 | 0.559 | 0.622 | 0.899 | 0.947 | 0.697 | 0.724 |
Download Data |
Period Mean (original grids) [W/m2] |
Model Period Mean (intersection) [W/m2] |
Model Period Mean (complement) [W/m2] |
Benchmark Period Mean (intersection) [W/m2] |
Benchmark Period Mean (complement) [W/m2] |
Bias [W/m2] |
RMSE [W/m2] |
Phase Shift [months] |
Bias Score [1] |
RMSE Score [1] |
Seasonal Cycle Score [1] |
Spatial Distribution Score [1] |
Interannual Variability Score [1] |
Overall Score [1] |
|||
|---|---|---|---|---|---|---|---|---|---|---|---|---|---|---|---|---|---|
| Benchmark | [-] | 36.2 | |||||||||||||||
| Calib | [-] | 26.1 | 25.9 | 36.2 | 36.3 | -12.0 | 21.7 | 0.0954 | 0.807 | 0.726 | 0.994 | 0.945 | 0.771 | 0.828 | |||
| Control | [-] | 25.8 | 25.7 | 36.2 | 36.3 | -12.2 | 21.9 | 0.0880 | 0.804 | 0.725 | 0.994 | 0.949 | 0.771 | 0.828 |
Download Data |
Period Mean (original grids) [W/m2] |
Model Period Mean (intersection) [W/m2] |
Model Period Mean (complement) [W/m2] |
Benchmark Period Mean (intersection) [W/m2] |
Benchmark Period Mean (complement) [W/m2] |
Bias [W/m2] |
RMSE [W/m2] |
Phase Shift [months] |
Bias Score [1] |
RMSE Score [1] |
Seasonal Cycle Score [1] |
Spatial Distribution Score [1] |
Interannual Variability Score [1] |
Overall Score [1] |
|||
|---|---|---|---|---|---|---|---|---|---|---|---|---|---|---|---|---|---|
| Benchmark | [-] | 138. | |||||||||||||||
| Calib | [-] | 108. | 109. | 133. | 161. | -18.9 | 26.4 | 1.06 | 0.574 | 0.627 | 0.868 | 0.988 | 0.678 | 0.727 | |||
| Control | [-] | 110. | 111. | 133. | 161. | -16.8 | 25.0 | 1.05 | 0.600 | 0.629 | 0.870 | 0.991 | 0.684 | 0.734 |
Download Data |
Period Mean (original grids) [W/m2] |
Model Period Mean (intersection) [W/m2] |
Model Period Mean (complement) [W/m2] |
Benchmark Period Mean (intersection) [W/m2] |
Benchmark Period Mean (complement) [W/m2] |
Bias [W/m2] |
RMSE [W/m2] |
Phase Shift [months] |
Bias Score [1] |
RMSE Score [1] |
Seasonal Cycle Score [1] |
Spatial Distribution Score [1] |
Interannual Variability Score [1] |
Overall Score [1] |
|||
|---|---|---|---|---|---|---|---|---|---|---|---|---|---|---|---|---|---|
| Benchmark | [-] | 98.6 | |||||||||||||||
| Calib | [-] | 83.0 | 83.2 | 96.9 | 135. | -12.1 | 18.2 | 0.453 | 0.800 | 0.776 | 0.967 | 0.966 | 0.712 | 0.833 | |||
| Control | [-] | 83.7 | 83.8 | 96.9 | 135. | -11.5 | 18.0 | 0.438 | 0.809 | 0.774 | 0.968 | 0.964 | 0.716 | 0.834 |
Download Data |
Period Mean (original grids) [W/m2] |
Model Period Mean (intersection) [W/m2] |
Model Period Mean (complement) [W/m2] |
Benchmark Period Mean (intersection) [W/m2] |
Benchmark Period Mean (complement) [W/m2] |
Bias [W/m2] |
RMSE [W/m2] |
Phase Shift [months] |
Bias Score [1] |
RMSE Score [1] |
Seasonal Cycle Score [1] |
Spatial Distribution Score [1] |
Interannual Variability Score [1] |
Overall Score [1] |
|||
|---|---|---|---|---|---|---|---|---|---|---|---|---|---|---|---|---|---|
| Benchmark | [-] | 63.9 | |||||||||||||||
| Calib | [-] | 58.1 | 58.2 | 63.6 | 72.9 | -5.23 | 15.1 | 0.157 | 0.895 | 0.797 | 0.990 | 0.988 | 0.690 | 0.859 | |||
| Control | [-] | 57.3 | 57.3 | 63.6 | 72.9 | -6.08 | 15.2 | 0.140 | 0.889 | 0.797 | 0.991 | 0.991 | 0.690 | 0.859 |
Download Data |
Period Mean (original grids) [W/m2] |
Model Period Mean (intersection) [W/m2] |
Model Period Mean (complement) [W/m2] |
Benchmark Period Mean (intersection) [W/m2] |
Benchmark Period Mean (complement) [W/m2] |
Bias [W/m2] |
RMSE [W/m2] |
Phase Shift [months] |
Bias Score [1] |
RMSE Score [1] |
Seasonal Cycle Score [1] |
Spatial Distribution Score [1] |
Interannual Variability Score [1] |
Overall Score [1] |
|||
|---|---|---|---|---|---|---|---|---|---|---|---|---|---|---|---|---|---|
| Benchmark | [-] | 82.3 | |||||||||||||||
| Calib | [-] | 72.4 | 72.6 | 81.8 | 110. | -8.80 | 18.2 | 0.544 | 0.818 | 0.771 | 0.952 | 0.983 | 0.709 | 0.834 | |||
| Control | [-] | 73.5 | 73.7 | 81.8 | 110. | -7.69 | 17.4 | 0.539 | 0.834 | 0.773 | 0.953 | 0.977 | 0.712 | 0.837 |
Download Data |
Period Mean (original grids) [W/m2] |
Model Period Mean (intersection) [W/m2] |
Model Period Mean (complement) [W/m2] |
Benchmark Period Mean (intersection) [W/m2] |
Benchmark Period Mean (complement) [W/m2] |
Bias [W/m2] |
RMSE [W/m2] |
Phase Shift [months] |
Bias Score [1] |
RMSE Score [1] |
Seasonal Cycle Score [1] |
Spatial Distribution Score [1] |
Interannual Variability Score [1] |
Overall Score [1] |
|||
|---|---|---|---|---|---|---|---|---|---|---|---|---|---|---|---|---|---|
| Benchmark | [-] | 139. | |||||||||||||||
| Calib | [-] | 122. | 122. | 138. | 170. | -15.7 | 23.7 | 1.15 | 0.362 | 0.402 | 0.839 | 0.970 | 0.717 | 0.615 | |||
| Control | [-] | 123. | 123. | 138. | 170. | -14.3 | 22.9 | 1.16 | 0.389 | 0.398 | 0.835 | 0.973 | 0.725 | 0.620 |
Download Data |
Period Mean (original grids) [W/m2] |
Model Period Mean (intersection) [W/m2] |
Model Period Mean (complement) [W/m2] |
Benchmark Period Mean (intersection) [W/m2] |
Benchmark Period Mean (complement) [W/m2] |
Bias [W/m2] |
RMSE [W/m2] |
Phase Shift [months] |
Bias Score [1] |
RMSE Score [1] |
Seasonal Cycle Score [1] |
Spatial Distribution Score [1] |
Interannual Variability Score [1] |
Overall Score [1] |
|||
|---|---|---|---|---|---|---|---|---|---|---|---|---|---|---|---|---|---|
| Benchmark | [-] | 121. | |||||||||||||||
| Calib | [-] | 109. | 109. | 120. | 143. | -11.4 | 21.0 | 0.970 | 0.693 | 0.622 | 0.881 | 0.874 | 0.668 | 0.727 | |||
| Control | [-] | 111. | 111. | 120. | 143. | -9.39 | 20.1 | 1.02 | 0.721 | 0.620 | 0.871 | 0.882 | 0.675 | 0.732 |
Download Data |
Period Mean (original grids) [W/m2] |
Model Period Mean (intersection) [W/m2] |
Model Period Mean (complement) [W/m2] |
Benchmark Period Mean (intersection) [W/m2] |
Benchmark Period Mean (complement) [W/m2] |
Bias [W/m2] |
RMSE [W/m2] |
Phase Shift [months] |
Bias Score [1] |
RMSE Score [1] |
Seasonal Cycle Score [1] |
Spatial Distribution Score [1] |
Interannual Variability Score [1] |
Overall Score [1] |
|||
|---|---|---|---|---|---|---|---|---|---|---|---|---|---|---|---|---|---|
| Benchmark | [-] | 98.1 | |||||||||||||||
| Calib | [-] | 89.5 | 88.9 | 95.8 | 118. | -7.84 | 23.9 | 0.504 | 0.749 | 0.706 | 0.955 | 0.990 | 0.622 | 0.788 | |||
| Control | [-] | 90.8 | 90.1 | 95.8 | 118. | -6.75 | 23.4 | 0.502 | 0.757 | 0.707 | 0.955 | 0.990 | 0.626 | 0.791 |
Temporally integrated period mean