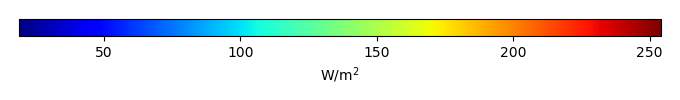
Mean State
Download Data |
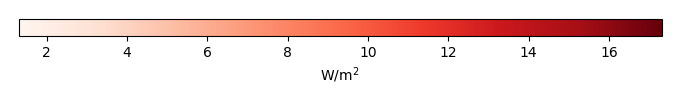
Period Mean (original grids) [W/m2] |
Model Period Mean (intersection) [W/m2] |
Model Period Mean (complement) [W/m2] |
Benchmark Period Mean (intersection) [W/m2] |
Benchmark Period Mean (complement) [W/m2] |
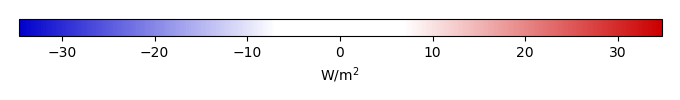
Bias [W/m2] |
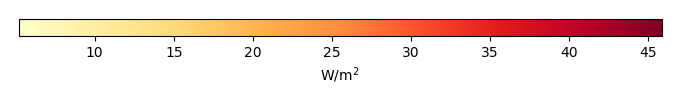
RMSE [W/m2] |
Phase Shift [months] |
Bias Score [1] |
RMSE Score [1] |
Seasonal Cycle Score [1] |
Spatial Distribution Score [1] |
Interannual Variability Score [1] |
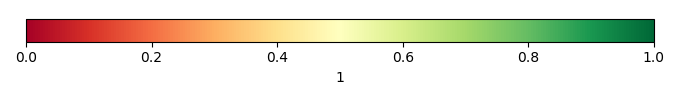
Overall Score [1] |
|||
|---|---|---|---|---|---|---|---|---|---|---|---|---|---|---|---|---|---|
| Benchmark | [-] | 187. | |||||||||||||||
| Calib | [-] | 181. | 182. | 186. | 206. | -4.51 | 15.3 | 0.744 | 0.723 | 0.496 | 0.912 | 0.917 | 0.801 | 0.724 | |||
| Control | [-] | 182. | 182. | 186. | 206. | -4.28 | 15.3 | 0.775 | 0.726 | 0.495 | 0.907 | 0.924 | 0.800 | 0.725 |
Download Data |
Period Mean (original grids) [W/m2] |
Model Period Mean (intersection) [W/m2] |
Model Period Mean (complement) [W/m2] |
Benchmark Period Mean (intersection) [W/m2] |
Benchmark Period Mean (complement) [W/m2] |
Bias [W/m2] |
RMSE [W/m2] |
Phase Shift [months] |
Bias Score [1] |
RMSE Score [1] |
Seasonal Cycle Score [1] |
Spatial Distribution Score [1] |
Interannual Variability Score [1] |
Overall Score [1] |
|||
|---|---|---|---|---|---|---|---|---|---|---|---|---|---|---|---|---|---|
| Benchmark | [-] | 198. | |||||||||||||||
| Calib | [-] | 194. | 194. | 198. | 214. | -3.42 | 14.3 | 0.687 | 0.713 | 0.515 | 0.925 | 0.980 | 0.834 | 0.747 | |||
| Control | [-] | 195. | 195. | 198. | 214. | -3.09 | 14.3 | 0.704 | 0.717 | 0.513 | 0.923 | 0.977 | 0.834 | 0.746 |
Download Data |
Period Mean (original grids) [W/m2] |
Model Period Mean (intersection) [W/m2] |
Model Period Mean (complement) [W/m2] |
Benchmark Period Mean (intersection) [W/m2] |
Benchmark Period Mean (complement) [W/m2] |
Bias [W/m2] |
RMSE [W/m2] |
Phase Shift [months] |
Bias Score [1] |
RMSE Score [1] |
Seasonal Cycle Score [1] |
Spatial Distribution Score [1] |
Interannual Variability Score [1] |
Overall Score [1] |
|||
|---|---|---|---|---|---|---|---|---|---|---|---|---|---|---|---|---|---|
| Benchmark | [-] | 199. | |||||||||||||||
| Calib | [-] | 196. | 196. | 198. | 219. | -2.64 | 15.5 | 0.776 | 0.801 | 0.570 | 0.892 | 0.994 | 0.744 | 0.762 | |||
| Control | [-] | 197. | 197. | 198. | 219. | -2.28 | 15.5 | 0.772 | 0.801 | 0.569 | 0.893 | 0.995 | 0.744 | 0.762 |
Download Data |
Period Mean (original grids) [W/m2] |
Model Period Mean (intersection) [W/m2] |
Model Period Mean (complement) [W/m2] |
Benchmark Period Mean (intersection) [W/m2] |
Benchmark Period Mean (complement) [W/m2] |
Bias [W/m2] |
RMSE [W/m2] |
Phase Shift [months] |
Bias Score [1] |
RMSE Score [1] |
Seasonal Cycle Score [1] |
Spatial Distribution Score [1] |
Interannual Variability Score [1] |
Overall Score [1] |
|||
|---|---|---|---|---|---|---|---|---|---|---|---|---|---|---|---|---|---|
| Benchmark | [-] | 70.7 | |||||||||||||||
| Calib | [-] | 70.1 | 70.2 | 70.5 | 72.8 | -0.710 | 18.2 | 0.319 | 0.934 | 0.765 | 0.979 | 0.996 | 0.763 | 0.867 | |||
| Control | [-] | 69.9 | 70.0 | 70.5 | 72.8 | -0.897 | 18.1 | 0.324 | 0.934 | 0.766 | 0.979 | 0.997 | 0.759 | 0.867 |
Download Data |
Period Mean (original grids) [W/m2] |
Model Period Mean (intersection) [W/m2] |
Model Period Mean (complement) [W/m2] |
Benchmark Period Mean (intersection) [W/m2] |
Benchmark Period Mean (complement) [W/m2] |
Bias [W/m2] |
RMSE [W/m2] |
Phase Shift [months] |
Bias Score [1] |
RMSE Score [1] |
Seasonal Cycle Score [1] |
Spatial Distribution Score [1] |
Interannual Variability Score [1] |
Overall Score [1] |
|||
|---|---|---|---|---|---|---|---|---|---|---|---|---|---|---|---|---|---|
| Benchmark | [-] | 194. | |||||||||||||||
| Calib | [-] | 176. | 176. | 190. | 207. | -10.3 | 18.7 | 1.25 | 0.568 | 0.436 | 0.803 | 0.963 | 0.769 | 0.662 | |||
| Control | [-] | 176. | 176. | 190. | 207. | -10.3 | 18.7 | 1.25 | 0.568 | 0.436 | 0.803 | 0.964 | 0.769 | 0.662 |
Download Data |
Period Mean (original grids) [W/m2] |
Model Period Mean (intersection) [W/m2] |
Model Period Mean (complement) [W/m2] |
Benchmark Period Mean (intersection) [W/m2] |
Benchmark Period Mean (complement) [W/m2] |
Bias [W/m2] |
RMSE [W/m2] |
Phase Shift [months] |
Bias Score [1] |
RMSE Score [1] |
Seasonal Cycle Score [1] |
Spatial Distribution Score [1] |
Interannual Variability Score [1] |
Overall Score [1] |
|||
|---|---|---|---|---|---|---|---|---|---|---|---|---|---|---|---|---|---|
| Benchmark | [-] | 97.8 | |||||||||||||||
| Calib | [-] | 102. | 102. | 97.6 | 118. | 4.70 | 14.7 | 0.228 | 0.923 | 0.826 | 0.985 | 0.991 | 0.668 | 0.870 | |||
| Control | [-] | 102. | 102. | 97.6 | 118. | 4.32 | 14.5 | 0.227 | 0.927 | 0.828 | 0.985 | 0.990 | 0.666 | 0.870 |
Download Data |
Period Mean (original grids) [W/m2] |
Model Period Mean (intersection) [W/m2] |
Model Period Mean (complement) [W/m2] |
Benchmark Period Mean (intersection) [W/m2] |
Benchmark Period Mean (complement) [W/m2] |
Bias [W/m2] |
RMSE [W/m2] |
Phase Shift [months] |
Bias Score [1] |
RMSE Score [1] |
Seasonal Cycle Score [1] |
Spatial Distribution Score [1] |
Interannual Variability Score [1] |
Overall Score [1] |
|||
|---|---|---|---|---|---|---|---|---|---|---|---|---|---|---|---|---|---|
| Benchmark | [-] | 139. | |||||||||||||||
| Calib | [-] | 135. | 135. | 138. | 149. | -2.74 | 15.9 | 0.337 | 0.878 | 0.769 | 0.971 | 0.999 | 0.669 | 0.842 | |||
| Control | [-] | 136. | 135. | 138. | 149. | -2.42 | 15.8 | 0.346 | 0.880 | 0.769 | 0.971 | 0.999 | 0.671 | 0.843 |
Download Data |
Period Mean (original grids) [W/m2] |
Model Period Mean (intersection) [W/m2] |
Model Period Mean (complement) [W/m2] |
Benchmark Period Mean (intersection) [W/m2] |
Benchmark Period Mean (complement) [W/m2] |
Bias [W/m2] |
RMSE [W/m2] |
Phase Shift [months] |
Bias Score [1] |
RMSE Score [1] |
Seasonal Cycle Score [1] |
Spatial Distribution Score [1] |
Interannual Variability Score [1] |
Overall Score [1] |
|||
|---|---|---|---|---|---|---|---|---|---|---|---|---|---|---|---|---|---|
| Benchmark | [-] | 181. | |||||||||||||||
| Calib | [-] | 175. | 175. | 179. | 205. | -2.79 | 18.1 | 0.341 | 0.777 | 0.610 | 0.973 | 0.948 | 0.725 | 0.774 | |||
| Control | [-] | 175. | 175. | 179. | 205. | -2.72 | 18.0 | 0.344 | 0.778 | 0.609 | 0.973 | 0.950 | 0.725 | 0.774 |
Download Data |
Period Mean (original grids) [W/m2] |
Model Period Mean (intersection) [W/m2] |
Model Period Mean (complement) [W/m2] |
Benchmark Period Mean (intersection) [W/m2] |
Benchmark Period Mean (complement) [W/m2] |
Bias [W/m2] |
RMSE [W/m2] |
Phase Shift [months] |
Bias Score [1] |
RMSE Score [1] |
Seasonal Cycle Score [1] |
Spatial Distribution Score [1] |
Interannual Variability Score [1] |
Overall Score [1] |
|||
|---|---|---|---|---|---|---|---|---|---|---|---|---|---|---|---|---|---|
| Benchmark | [-] | 62.8 | |||||||||||||||
| Calib | [-] | 62.1 | 62.5 | 63.2 | 54.4 | -1.60 | 15.8 | 0.163 | 0.946 | 0.784 | 0.989 | 0.985 | 0.753 | 0.874 | |||
| Control | [-] | 61.9 | 62.3 | 63.2 | 54.4 | -1.82 | 15.8 | 0.161 | 0.945 | 0.783 | 0.989 | 0.985 | 0.751 | 0.873 |
Download Data |
Period Mean (original grids) [W/m2] |
Model Period Mean (intersection) [W/m2] |
Model Period Mean (complement) [W/m2] |
Benchmark Period Mean (intersection) [W/m2] |
Benchmark Period Mean (complement) [W/m2] |
Bias [W/m2] |
RMSE [W/m2] |
Phase Shift [months] |
Bias Score [1] |
RMSE Score [1] |
Seasonal Cycle Score [1] |
Spatial Distribution Score [1] |
Interannual Variability Score [1] |
Overall Score [1] |
|||
|---|---|---|---|---|---|---|---|---|---|---|---|---|---|---|---|---|---|
| Benchmark | [-] | 198. | |||||||||||||||
| Calib | [-] | 189. | 189. | 198. | 197. | -9.74 | 16.9 | 0.353 | 0.812 | 0.765 | 0.973 | 1.00 | 0.704 | 0.836 | |||
| Control | [-] | 190. | 190. | 198. | 197. | -9.06 | 16.6 | 0.369 | 0.821 | 0.763 | 0.971 | 1.00 | 0.706 | 0.837 |
Download Data |
Period Mean (original grids) [W/m2] |
Model Period Mean (intersection) [W/m2] |
Model Period Mean (complement) [W/m2] |
Benchmark Period Mean (intersection) [W/m2] |
Benchmark Period Mean (complement) [W/m2] |
Bias [W/m2] |
RMSE [W/m2] |
Phase Shift [months] |
Bias Score [1] |
RMSE Score [1] |
Seasonal Cycle Score [1] |
Spatial Distribution Score [1] |
Interannual Variability Score [1] |
Overall Score [1] |
|||
|---|---|---|---|---|---|---|---|---|---|---|---|---|---|---|---|---|---|
| Benchmark | [-] | 120. | |||||||||||||||
| Calib | [-] | 114. | 114. | 118. | 145. | -1.51 | 13.3 | 0.214 | 0.925 | 0.841 | 0.986 | 0.992 | 0.656 | 0.874 | |||
| Control | [-] | 114. | 114. | 118. | 145. | -1.56 | 13.2 | 0.210 | 0.925 | 0.842 | 0.986 | 0.993 | 0.658 | 0.874 |
Download Data |
Period Mean (original grids) [W/m2] |
Model Period Mean (intersection) [W/m2] |
Model Period Mean (complement) [W/m2] |
Benchmark Period Mean (intersection) [W/m2] |
Benchmark Period Mean (complement) [W/m2] |
Bias [W/m2] |
RMSE [W/m2] |
Phase Shift [months] |
Bias Score [1] |
RMSE Score [1] |
Seasonal Cycle Score [1] |
Spatial Distribution Score [1] |
Interannual Variability Score [1] |
Overall Score [1] |
|||
|---|---|---|---|---|---|---|---|---|---|---|---|---|---|---|---|---|---|
| Benchmark | [-] | 163. | |||||||||||||||
| Calib | [-] | 136. | 136. | 142. | 173. | -4.59 | 16.0 | 0.384 | 0.820 | 0.705 | 0.959 | 0.998 | 0.710 | 0.816 | |||
| Control | [-] | 136. | 136. | 142. | 173. | -4.44 | 15.9 | 0.388 | 0.822 | 0.705 | 0.959 | 0.998 | 0.711 | 0.817 |
Download Data |
Period Mean (original grids) [W/m2] |
Model Period Mean (intersection) [W/m2] |
Model Period Mean (complement) [W/m2] |
Benchmark Period Mean (intersection) [W/m2] |
Benchmark Period Mean (complement) [W/m2] |
Bias [W/m2] |
RMSE [W/m2] |
Phase Shift [months] |
Bias Score [1] |
RMSE Score [1] |
Seasonal Cycle Score [1] |
Spatial Distribution Score [1] |
Interannual Variability Score [1] |
Overall Score [1] |
|||
|---|---|---|---|---|---|---|---|---|---|---|---|---|---|---|---|---|---|
| Benchmark | [-] | 177. | |||||||||||||||
| Calib | [-] | 162. | 162. | 175. | 217. | -12.3 | 18.0 | 0.291 | 0.705 | 0.766 | 0.979 | 0.964 | 0.670 | 0.808 | |||
| Control | [-] | 162. | 162. | 175. | 217. | -11.9 | 17.8 | 0.299 | 0.710 | 0.764 | 0.978 | 0.963 | 0.674 | 0.809 |
Download Data |
Period Mean (original grids) [W/m2] |
Model Period Mean (intersection) [W/m2] |
Model Period Mean (complement) [W/m2] |
Benchmark Period Mean (intersection) [W/m2] |
Benchmark Period Mean (complement) [W/m2] |
Bias [W/m2] |
RMSE [W/m2] |
Phase Shift [months] |
Bias Score [1] |
RMSE Score [1] |
Seasonal Cycle Score [1] |
Spatial Distribution Score [1] |
Interannual Variability Score [1] |
Overall Score [1] |
|||
|---|---|---|---|---|---|---|---|---|---|---|---|---|---|---|---|---|---|
| Benchmark | [-] | 69.7 | |||||||||||||||
| Calib | [-] | 69.9 | 69.8 | 69.6 | 71.1 | -1.18 | 17.2 | 0.0916 | 0.922 | 0.779 | 0.994 | 0.985 | 0.759 | 0.870 | |||
| Control | [-] | 69.6 | 69.5 | 69.6 | 71.1 | -1.43 | 17.2 | 0.0834 | 0.922 | 0.779 | 0.994 | 0.985 | 0.756 | 0.869 |
Download Data |
Period Mean (original grids) [W/m2] |
Model Period Mean (intersection) [W/m2] |
Model Period Mean (complement) [W/m2] |
Benchmark Period Mean (intersection) [W/m2] |
Benchmark Period Mean (complement) [W/m2] |
Bias [W/m2] |
RMSE [W/m2] |
Phase Shift [months] |
Bias Score [1] |
RMSE Score [1] |
Seasonal Cycle Score [1] |
Spatial Distribution Score [1] |
Interannual Variability Score [1] |
Overall Score [1] |
|||
|---|---|---|---|---|---|---|---|---|---|---|---|---|---|---|---|---|---|
| Benchmark | [-] | 204. | |||||||||||||||
| Calib | [-] | 191. | 192. | 201. | 219. | -6.97 | 16.8 | 0.459 | 0.765 | 0.678 | 0.945 | 0.986 | 0.752 | 0.801 | |||
| Control | [-] | 192. | 192. | 201. | 219. | -6.62 | 16.7 | 0.458 | 0.770 | 0.678 | 0.945 | 0.985 | 0.753 | 0.802 |
Download Data |
Period Mean (original grids) [W/m2] |
Model Period Mean (intersection) [W/m2] |
Model Period Mean (complement) [W/m2] |
Benchmark Period Mean (intersection) [W/m2] |
Benchmark Period Mean (complement) [W/m2] |
Bias [W/m2] |
RMSE [W/m2] |
Phase Shift [months] |
Bias Score [1] |
RMSE Score [1] |
Seasonal Cycle Score [1] |
Spatial Distribution Score [1] |
Interannual Variability Score [1] |
Overall Score [1] |
|||
|---|---|---|---|---|---|---|---|---|---|---|---|---|---|---|---|---|---|
| Benchmark | [-] | 150. | |||||||||||||||
| Calib | [-] | 146. | 145. | 148. | 192. | -1.23 | 13.2 | 0.290 | 0.940 | 0.803 | 0.981 | 0.986 | 0.698 | 0.868 | |||
| Control | [-] | 145. | 145. | 148. | 192. | -1.35 | 13.3 | 0.290 | 0.940 | 0.802 | 0.981 | 0.990 | 0.697 | 0.868 |
Download Data |
Period Mean (original grids) [W/m2] |
Model Period Mean (intersection) [W/m2] |
Model Period Mean (complement) [W/m2] |
Benchmark Period Mean (intersection) [W/m2] |
Benchmark Period Mean (complement) [W/m2] |
Bias [W/m2] |
RMSE [W/m2] |
Phase Shift [months] |
Bias Score [1] |
RMSE Score [1] |
Seasonal Cycle Score [1] |
Spatial Distribution Score [1] |
Interannual Variability Score [1] |
Overall Score [1] |
|||
|---|---|---|---|---|---|---|---|---|---|---|---|---|---|---|---|---|---|
| Benchmark | [-] | 110. | |||||||||||||||
| Calib | [-] | 112. | 112. | 110. | 117. | 2.11 | 13.5 | 0.120 | 0.929 | 0.840 | 0.992 | 0.999 | 0.672 | 0.879 | |||
| Control | [-] | 111. | 112. | 110. | 117. | 1.72 | 13.3 | 0.116 | 0.932 | 0.842 | 0.992 | 0.999 | 0.670 | 0.879 |
Download Data |
Period Mean (original grids) [W/m2] |
Model Period Mean (intersection) [W/m2] |
Model Period Mean (complement) [W/m2] |
Benchmark Period Mean (intersection) [W/m2] |
Benchmark Period Mean (complement) [W/m2] |
Bias [W/m2] |
RMSE [W/m2] |
Phase Shift [months] |
Bias Score [1] |
RMSE Score [1] |
Seasonal Cycle Score [1] |
Spatial Distribution Score [1] |
Interannual Variability Score [1] |
Overall Score [1] |
|||
|---|---|---|---|---|---|---|---|---|---|---|---|---|---|---|---|---|---|
| Benchmark | [-] | 161. | |||||||||||||||
| Calib | [-] | 159. | 159. | 161. | 163. | -1.42 | 14.3 | 0.191 | 0.924 | 0.826 | 0.987 | 0.979 | 0.696 | 0.873 | |||
| Control | [-] | 160. | 160. | 161. | 163. | -0.793 | 14.1 | 0.197 | 0.931 | 0.826 | 0.987 | 0.984 | 0.707 | 0.877 |
Download Data |
Period Mean (original grids) [W/m2] |
Model Period Mean (intersection) [W/m2] |
Model Period Mean (complement) [W/m2] |
Benchmark Period Mean (intersection) [W/m2] |
Benchmark Period Mean (complement) [W/m2] |
Bias [W/m2] |
RMSE [W/m2] |
Phase Shift [months] |
Bias Score [1] |
RMSE Score [1] |
Seasonal Cycle Score [1] |
Spatial Distribution Score [1] |
Interannual Variability Score [1] |
Overall Score [1] |
|||
|---|---|---|---|---|---|---|---|---|---|---|---|---|---|---|---|---|---|
| Benchmark | [-] | 179. | |||||||||||||||
| Calib | [-] | 174. | 174. | 178. | 218. | -3.05 | 14.3 | 0.802 | 0.751 | 0.449 | 0.896 | 0.957 | 0.806 | 0.718 | |||
| Control | [-] | 174. | 174. | 178. | 218. | -3.02 | 14.3 | 0.799 | 0.751 | 0.449 | 0.896 | 0.959 | 0.806 | 0.718 |
Download Data |
Period Mean (original grids) [W/m2] |
Model Period Mean (intersection) [W/m2] |
Model Period Mean (complement) [W/m2] |
Benchmark Period Mean (intersection) [W/m2] |
Benchmark Period Mean (complement) [W/m2] |
Bias [W/m2] |
RMSE [W/m2] |
Phase Shift [months] |
Bias Score [1] |
RMSE Score [1] |
Seasonal Cycle Score [1] |
Spatial Distribution Score [1] |
Interannual Variability Score [1] |
Overall Score [1] |
|||
|---|---|---|---|---|---|---|---|---|---|---|---|---|---|---|---|---|---|
| Benchmark | [-] | 185. | |||||||||||||||
| Calib | [-] | 180. | 181. | 184. | 202. | -3.49 | 15.5 | 0.720 | 0.830 | 0.645 | 0.909 | 0.975 | 0.714 | 0.786 | |||
| Control | [-] | 181. | 181. | 184. | 202. | -3.27 | 15.5 | 0.722 | 0.832 | 0.645 | 0.909 | 0.975 | 0.715 | 0.787 |
Download Data |
Period Mean (original grids) [W/m2] |
Model Period Mean (intersection) [W/m2] |
Model Period Mean (complement) [W/m2] |
Benchmark Period Mean (intersection) [W/m2] |
Benchmark Period Mean (complement) [W/m2] |
Bias [W/m2] |
RMSE [W/m2] |
Phase Shift [months] |
Bias Score [1] |
RMSE Score [1] |
Seasonal Cycle Score [1] |
Spatial Distribution Score [1] |
Interannual Variability Score [1] |
Overall Score [1] |
|||
|---|---|---|---|---|---|---|---|---|---|---|---|---|---|---|---|---|---|
| Benchmark | [-] | 178. | |||||||||||||||
| Calib | [-] | 177. | 176. | 179. | 169. | -7.79 | 21.1 | 0.389 | 0.783 | 0.711 | 0.959 | 0.998 | 0.686 | 0.808 | |||
| Control | [-] | 177. | 176. | 179. | 169. | -7.25 | 20.8 | 0.395 | 0.790 | 0.712 | 0.959 | 0.998 | 0.688 | 0.810 |
Temporally integrated period mean