Mean State
Download Data |
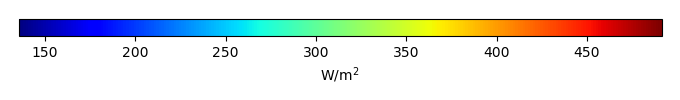
Period Mean (original grids) [W/m2] |
Model Period Mean (intersection) [W/m2] |
Model Period Mean (complement) [W/m2] |
Benchmark Period Mean (intersection) [W/m2] |
Benchmark Period Mean (complement) [W/m2] |
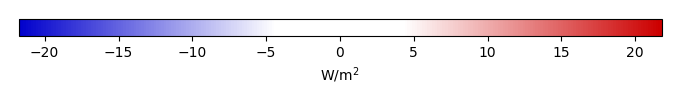
Bias [W/m2] |
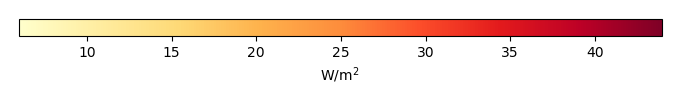
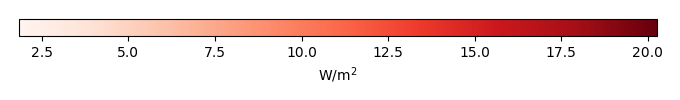
RMSE [W/m2] |
Phase Shift [months] |
Bias Score [1] |
RMSE Score [1] |
Seasonal Cycle Score [1] |
Spatial Distribution Score [1] |
Interannual Variability Score [1] |
Overall Score [1] |
|||
|---|---|---|---|---|---|---|---|---|---|---|---|---|---|---|---|---|---|
| Benchmark | [-] | 457. | |||||||||||||||
| Calib | [-] | 463. | 463. | 456. | 465. | 7.40 | 15.4 | 1.28 | 0.482 | 0.390 | 0.826 | 0.994 | 0.605 | 0.614 | |||
| Control | [-] | 461. | 461. | 456. | 465. | 5.45 | 14.8 | 1.39 | 0.498 | 0.387 | 0.806 | 0.996 | 0.603 | 0.613 |
Download Data |
Period Mean (original grids) [W/m2] |
Model Period Mean (intersection) [W/m2] |
Model Period Mean (complement) [W/m2] |
Benchmark Period Mean (intersection) [W/m2] |
Benchmark Period Mean (complement) [W/m2] |
Bias [W/m2] |
RMSE [W/m2] |
Phase Shift [months] |
Bias Score [1] |
RMSE Score [1] |
Seasonal Cycle Score [1] |
Spatial Distribution Score [1] |
Interannual Variability Score [1] |
Overall Score [1] |
|||
|---|---|---|---|---|---|---|---|---|---|---|---|---|---|---|---|---|---|
| Benchmark | [-] | 466. | |||||||||||||||
| Calib | [-] | 480. | 481. | 467. | 458. | 13.9 | 20.8 | 0.561 | 0.525 | 0.517 | 0.952 | 0.978 | 0.618 | 0.684 | |||
| Control | [-] | 478. | 478. | 467. | 458. | 11.5 | 19.5 | 0.558 | 0.574 | 0.514 | 0.952 | 0.973 | 0.614 | 0.690 |
Download Data |
Period Mean (original grids) [W/m2] |
Model Period Mean (intersection) [W/m2] |
Model Period Mean (complement) [W/m2] |
Benchmark Period Mean (intersection) [W/m2] |
Benchmark Period Mean (complement) [W/m2] |
Bias [W/m2] |
RMSE [W/m2] |
Phase Shift [months] |
Bias Score [1] |
RMSE Score [1] |
Seasonal Cycle Score [1] |
Spatial Distribution Score [1] |
Interannual Variability Score [1] |
Overall Score [1] |
|||
|---|---|---|---|---|---|---|---|---|---|---|---|---|---|---|---|---|---|
| Benchmark | [-] | 443. | |||||||||||||||
| Calib | [-] | 449. | 449. | 443. | 446. | 6.44 | 16.3 | 1.09 | 0.639 | 0.500 | 0.861 | 0.993 | 0.610 | 0.684 | |||
| Control | [-] | 447. | 447. | 443. | 446. | 4.25 | 15.8 | 1.08 | 0.674 | 0.496 | 0.862 | 0.987 | 0.601 | 0.686 |
Download Data |
Period Mean (original grids) [W/m2] |
Model Period Mean (intersection) [W/m2] |
Model Period Mean (complement) [W/m2] |
Benchmark Period Mean (intersection) [W/m2] |
Benchmark Period Mean (complement) [W/m2] |
Bias [W/m2] |
RMSE [W/m2] |
Phase Shift [months] |
Bias Score [1] |
RMSE Score [1] |
Seasonal Cycle Score [1] |
Spatial Distribution Score [1] |
Interannual Variability Score [1] |
Overall Score [1] |
|||
|---|---|---|---|---|---|---|---|---|---|---|---|---|---|---|---|---|---|
| Benchmark | [-] | 279. | |||||||||||||||
| Calib | [-] | 277. | 277. | 278. | 296. | 1.89 | 15.4 | 0.132 | 0.906 | 0.807 | 0.990 | 0.999 | 0.748 | 0.876 | |||
| Control | [-] | 277. | 277. | 278. | 296. | 1.98 | 15.4 | 0.132 | 0.906 | 0.807 | 0.990 | 0.999 | 0.744 | 0.876 |
Download Data |
Period Mean (original grids) [W/m2] |
Model Period Mean (intersection) [W/m2] |
Model Period Mean (complement) [W/m2] |
Benchmark Period Mean (intersection) [W/m2] |
Benchmark Period Mean (complement) [W/m2] |
Bias [W/m2] |
RMSE [W/m2] |
Phase Shift [months] |
Bias Score [1] |
RMSE Score [1] |
Seasonal Cycle Score [1] |
Spatial Distribution Score [1] |
Interannual Variability Score [1] |
Overall Score [1] |
|||
|---|---|---|---|---|---|---|---|---|---|---|---|---|---|---|---|---|---|
| Benchmark | [-] | 457. | |||||||||||||||
| Calib | [-] | 458. | 458. | 454. | 467. | 4.96 | 14.2 | 1.63 | 0.291 | 0.389 | 0.748 | 0.570 | 0.569 | 0.493 | |||
| Control | [-] | 457. | 457. | 454. | 467. | 3.82 | 13.9 | 1.70 | 0.300 | 0.388 | 0.735 | 0.573 | 0.566 | 0.492 |
Download Data |
Period Mean (original grids) [W/m2] |
Model Period Mean (intersection) [W/m2] |
Model Period Mean (complement) [W/m2] |
Benchmark Period Mean (intersection) [W/m2] |
Benchmark Period Mean (complement) [W/m2] |
Bias [W/m2] |
RMSE [W/m2] |
Phase Shift [months] |
Bias Score [1] |
RMSE Score [1] |
Seasonal Cycle Score [1] |
Spatial Distribution Score [1] |
Interannual Variability Score [1] |
Overall Score [1] |
|||
|---|---|---|---|---|---|---|---|---|---|---|---|---|---|---|---|---|---|
| Benchmark | [-] | 312. | |||||||||||||||
| Calib | [-] | 316. | 316. | 311. | 334. | 4.68 | 11.0 | 0.0401 | 0.916 | 0.887 | 0.997 | 0.999 | 0.862 | 0.925 | |||
| Control | [-] | 316. | 316. | 311. | 334. | 5.11 | 11.3 | 0.0408 | 0.913 | 0.885 | 0.997 | 1.00 | 0.857 | 0.923 |
Download Data |
Period Mean (original grids) [W/m2] |
Model Period Mean (intersection) [W/m2] |
Model Period Mean (complement) [W/m2] |
Benchmark Period Mean (intersection) [W/m2] |
Benchmark Period Mean (complement) [W/m2] |
Bias [W/m2] |
RMSE [W/m2] |
Phase Shift [months] |
Bias Score [1] |
RMSE Score [1] |
Seasonal Cycle Score [1] |
Spatial Distribution Score [1] |
Interannual Variability Score [1] |
Overall Score [1] |
|||
|---|---|---|---|---|---|---|---|---|---|---|---|---|---|---|---|---|---|
| Benchmark | [-] | 364. | |||||||||||||||
| Calib | [-] | 366. | 366. | 363. | 399. | 4.99 | 14.5 | 0.112 | 0.845 | 0.827 | 0.992 | 0.993 | 0.763 | 0.874 | |||
| Control | [-] | 366. | 365. | 363. | 399. | 4.49 | 14.5 | 0.114 | 0.848 | 0.825 | 0.992 | 0.993 | 0.756 | 0.873 |
Download Data |
Period Mean (original grids) [W/m2] |
Model Period Mean (intersection) [W/m2] |
Model Period Mean (complement) [W/m2] |
Benchmark Period Mean (intersection) [W/m2] |
Benchmark Period Mean (complement) [W/m2] |
Bias [W/m2] |
RMSE [W/m2] |
Phase Shift [months] |
Bias Score [1] |
RMSE Score [1] |
Seasonal Cycle Score [1] |
Spatial Distribution Score [1] |
Interannual Variability Score [1] |
Overall Score [1] |
|||
|---|---|---|---|---|---|---|---|---|---|---|---|---|---|---|---|---|---|
| Benchmark | [-] | 448. | |||||||||||||||
| Calib | [-] | 452. | 452. | 446. | 467. | 8.01 | 17.8 | 0.682 | 0.625 | 0.570 | 0.932 | 0.969 | 0.617 | 0.714 | |||
| Control | [-] | 450. | 450. | 446. | 467. | 6.13 | 17.1 | 0.701 | 0.646 | 0.572 | 0.928 | 0.963 | 0.617 | 0.716 |
Download Data |
Period Mean (original grids) [W/m2] |
Model Period Mean (intersection) [W/m2] |
Model Period Mean (complement) [W/m2] |
Benchmark Period Mean (intersection) [W/m2] |
Benchmark Period Mean (complement) [W/m2] |
Bias [W/m2] |
RMSE [W/m2] |
Phase Shift [months] |
Bias Score [1] |
RMSE Score [1] |
Seasonal Cycle Score [1] |
Spatial Distribution Score [1] |
Interannual Variability Score [1] |
Overall Score [1] |
|||
|---|---|---|---|---|---|---|---|---|---|---|---|---|---|---|---|---|---|
| Benchmark | [-] | 281. | |||||||||||||||
| Calib | [-] | 283. | 284. | 281. | 288. | 3.78 | 13.2 | 0.0849 | 0.918 | 0.825 | 0.993 | 0.999 | 0.765 | 0.887 | |||
| Control | [-] | 283. | 284. | 281. | 288. | 3.87 | 13.3 | 0.0847 | 0.917 | 0.825 | 0.993 | 0.999 | 0.762 | 0.887 |
Download Data |
Period Mean (original grids) [W/m2] |
Model Period Mean (intersection) [W/m2] |
Model Period Mean (complement) [W/m2] |
Benchmark Period Mean (intersection) [W/m2] |
Benchmark Period Mean (complement) [W/m2] |
Bias [W/m2] |
RMSE [W/m2] |
Phase Shift [months] |
Bias Score [1] |
RMSE Score [1] |
Seasonal Cycle Score [1] |
Spatial Distribution Score [1] |
Interannual Variability Score [1] |
Overall Score [1] |
|||
|---|---|---|---|---|---|---|---|---|---|---|---|---|---|---|---|---|---|
| Benchmark | [-] | 441. | |||||||||||||||
| Calib | [-] | 447. | 447. | 443. | 426. | 2.09 | 12.4 | 0.382 | 0.823 | 0.697 | 0.968 | 0.997 | 0.728 | 0.818 | |||
| Control | [-] | 446. | 446. | 443. | 426. | 0.638 | 12.2 | 0.377 | 0.836 | 0.697 | 0.969 | 0.998 | 0.720 | 0.819 |
Download Data |
Period Mean (original grids) [W/m2] |
Model Period Mean (intersection) [W/m2] |
Model Period Mean (complement) [W/m2] |
Benchmark Period Mean (intersection) [W/m2] |
Benchmark Period Mean (complement) [W/m2] |
Bias [W/m2] |
RMSE [W/m2] |
Phase Shift [months] |
Bias Score [1] |
RMSE Score [1] |
Seasonal Cycle Score [1] |
Spatial Distribution Score [1] |
Interannual Variability Score [1] |
Overall Score [1] |
|||
|---|---|---|---|---|---|---|---|---|---|---|---|---|---|---|---|---|---|
| Benchmark | [-] | 368. | |||||||||||||||
| Calib | [-] | 364. | 364. | 366. | 389. | 1.29 | 11.5 | 0.231 | 0.859 | 0.777 | 0.984 | 0.998 | 0.777 | 0.862 | |||
| Control | [-] | 364. | 364. | 366. | 389. | 1.09 | 11.6 | 0.235 | 0.859 | 0.775 | 0.984 | 0.997 | 0.773 | 0.861 |
Download Data |
Period Mean (original grids) [W/m2] |
Model Period Mean (intersection) [W/m2] |
Model Period Mean (complement) [W/m2] |
Benchmark Period Mean (intersection) [W/m2] |
Benchmark Period Mean (complement) [W/m2] |
Bias [W/m2] |
RMSE [W/m2] |
Phase Shift [months] |
Bias Score [1] |
RMSE Score [1] |
Seasonal Cycle Score [1] |
Spatial Distribution Score [1] |
Interannual Variability Score [1] |
Overall Score [1] |
|||
|---|---|---|---|---|---|---|---|---|---|---|---|---|---|---|---|---|---|
| Benchmark | [-] | 399. | |||||||||||||||
| Calib | [-] | 380. | 380. | 376. | 409. | 5.91 | 15.6 | 0.481 | 0.732 | 0.673 | 0.946 | 0.999 | 0.692 | 0.786 | |||
| Control | [-] | 379. | 379. | 376. | 409. | 5.14 | 15.3 | 0.491 | 0.742 | 0.672 | 0.945 | 0.999 | 0.687 | 0.786 |
Download Data |
Period Mean (original grids) [W/m2] |
Model Period Mean (intersection) [W/m2] |
Model Period Mean (complement) [W/m2] |
Benchmark Period Mean (intersection) [W/m2] |
Benchmark Period Mean (complement) [W/m2] |
Bias [W/m2] |
RMSE [W/m2] |
Phase Shift [months] |
Bias Score [1] |
RMSE Score [1] |
Seasonal Cycle Score [1] |
Spatial Distribution Score [1] |
Interannual Variability Score [1] |
Overall Score [1] |
|||
|---|---|---|---|---|---|---|---|---|---|---|---|---|---|---|---|---|---|
| Benchmark | [-] | 450. | |||||||||||||||
| Calib | [-] | 452. | 452. | 450. | 446. | 2.47 | 15.1 | 0.317 | 0.843 | 0.761 | 0.976 | 0.999 | 0.716 | 0.843 | |||
| Control | [-] | 452. | 452. | 450. | 446. | 2.15 | 15.0 | 0.321 | 0.844 | 0.761 | 0.976 | 1.00 | 0.714 | 0.843 |
Download Data |
Period Mean (original grids) [W/m2] |
Model Period Mean (intersection) [W/m2] |
Model Period Mean (complement) [W/m2] |
Benchmark Period Mean (intersection) [W/m2] |
Benchmark Period Mean (complement) [W/m2] |
Bias [W/m2] |
RMSE [W/m2] |
Phase Shift [months] |
Bias Score [1] |
RMSE Score [1] |
Seasonal Cycle Score [1] |
Spatial Distribution Score [1] |
Interannual Variability Score [1] |
Overall Score [1] |
|||
|---|---|---|---|---|---|---|---|---|---|---|---|---|---|---|---|---|---|
| Benchmark | [-] | 281. | |||||||||||||||
| Calib | [-] | 287. | 287. | 281. | 293. | 6.59 | 16.6 | 0.169 | 0.882 | 0.796 | 0.986 | 1.00 | 0.765 | 0.871 | |||
| Control | [-] | 287. | 287. | 281. | 293. | 6.58 | 16.7 | 0.170 | 0.882 | 0.795 | 0.986 | 1.00 | 0.763 | 0.870 |
Download Data |
Period Mean (original grids) [W/m2] |
Model Period Mean (intersection) [W/m2] |
Model Period Mean (complement) [W/m2] |
Benchmark Period Mean (intersection) [W/m2] |
Benchmark Period Mean (complement) [W/m2] |
Bias [W/m2] |
RMSE [W/m2] |
Phase Shift [months] |
Bias Score [1] |
RMSE Score [1] |
Seasonal Cycle Score [1] |
Spatial Distribution Score [1] |
Interannual Variability Score [1] |
Overall Score [1] |
|||
|---|---|---|---|---|---|---|---|---|---|---|---|---|---|---|---|---|---|
| Benchmark | [-] | 442. | |||||||||||||||
| Calib | [-] | 445. | 445. | 439. | 459. | 10.7 | 17.4 | 0.836 | 0.531 | 0.569 | 0.895 | 0.964 | 0.679 | 0.701 | |||
| Control | [-] | 444. | 444. | 439. | 459. | 8.93 | 16.4 | 0.842 | 0.563 | 0.573 | 0.894 | 0.962 | 0.670 | 0.706 |
Download Data |
Period Mean (original grids) [W/m2] |
Model Period Mean (intersection) [W/m2] |
Model Period Mean (complement) [W/m2] |
Benchmark Period Mean (intersection) [W/m2] |
Benchmark Period Mean (complement) [W/m2] |
Bias [W/m2] |
RMSE [W/m2] |
Phase Shift [months] |
Bias Score [1] |
RMSE Score [1] |
Seasonal Cycle Score [1] |
Spatial Distribution Score [1] |
Interannual Variability Score [1] |
Overall Score [1] |
|||
|---|---|---|---|---|---|---|---|---|---|---|---|---|---|---|---|---|---|
| Benchmark | [-] | 386. | |||||||||||||||
| Calib | [-] | 391. | 391. | 384. | 429. | 8.51 | 12.3 | 0.0925 | 0.831 | 0.861 | 0.994 | 0.999 | 0.859 | 0.901 | |||
| Control | [-] | 390. | 390. | 384. | 429. | 7.76 | 11.9 | 0.0732 | 0.843 | 0.859 | 0.995 | 0.998 | 0.852 | 0.901 |
Download Data |
Period Mean (original grids) [W/m2] |
Model Period Mean (intersection) [W/m2] |
Model Period Mean (complement) [W/m2] |
Benchmark Period Mean (intersection) [W/m2] |
Benchmark Period Mean (complement) [W/m2] |
Bias [W/m2] |
RMSE [W/m2] |
Phase Shift [months] |
Bias Score [1] |
RMSE Score [1] |
Seasonal Cycle Score [1] |
Spatial Distribution Score [1] |
Interannual Variability Score [1] |
Overall Score [1] |
|||
|---|---|---|---|---|---|---|---|---|---|---|---|---|---|---|---|---|---|
| Benchmark | [-] | 324. | |||||||||||||||
| Calib | [-] | 329. | 329. | 323. | 347. | 6.37 | 13.1 | 0.0584 | 0.876 | 0.836 | 0.996 | 0.970 | 0.783 | 0.883 | |||
| Control | [-] | 329. | 329. | 323. | 347. | 6.82 | 13.5 | 0.0540 | 0.870 | 0.835 | 0.996 | 0.964 | 0.778 | 0.880 |
Download Data |
Period Mean (original grids) [W/m2] |
Model Period Mean (intersection) [W/m2] |
Model Period Mean (complement) [W/m2] |
Benchmark Period Mean (intersection) [W/m2] |
Benchmark Period Mean (complement) [W/m2] |
Bias [W/m2] |
RMSE [W/m2] |
Phase Shift [months] |
Bias Score [1] |
RMSE Score [1] |
Seasonal Cycle Score [1] |
Spatial Distribution Score [1] |
Interannual Variability Score [1] |
Overall Score [1] |
|||
|---|---|---|---|---|---|---|---|---|---|---|---|---|---|---|---|---|---|
| Benchmark | [-] | 377. | |||||||||||||||
| Calib | [-] | 380. | 381. | 377. | 378. | 4.38 | 13.6 | 0.0971 | 0.848 | 0.818 | 0.993 | 0.999 | 0.745 | 0.870 | |||
| Control | [-] | 380. | 381. | 377. | 378. | 3.89 | 13.5 | 0.0966 | 0.852 | 0.816 | 0.993 | 1.00 | 0.734 | 0.869 |
Download Data |
Period Mean (original grids) [W/m2] |
Model Period Mean (intersection) [W/m2] |
Model Period Mean (complement) [W/m2] |
Benchmark Period Mean (intersection) [W/m2] |
Benchmark Period Mean (complement) [W/m2] |
Bias [W/m2] |
RMSE [W/m2] |
Phase Shift [months] |
Bias Score [1] |
RMSE Score [1] |
Seasonal Cycle Score [1] |
Spatial Distribution Score [1] |
Interannual Variability Score [1] |
Overall Score [1] |
|||
|---|---|---|---|---|---|---|---|---|---|---|---|---|---|---|---|---|---|
| Benchmark | [-] | 449. | |||||||||||||||
| Calib | [-] | 458. | 458. | 449. | 463. | 9.64 | 14.9 | 1.14 | 0.307 | 0.403 | 0.848 | 0.998 | 0.628 | 0.598 | |||
| Control | [-] | 457. | 457. | 449. | 463. | 8.35 | 14.1 | 1.22 | 0.341 | 0.399 | 0.836 | 0.999 | 0.624 | 0.600 |
Download Data |
Period Mean (original grids) [W/m2] |
Model Period Mean (intersection) [W/m2] |
Model Period Mean (complement) [W/m2] |
Benchmark Period Mean (intersection) [W/m2] |
Benchmark Period Mean (complement) [W/m2] |
Bias [W/m2] |
RMSE [W/m2] |
Phase Shift [months] |
Bias Score [1] |
RMSE Score [1] |
Seasonal Cycle Score [1] |
Spatial Distribution Score [1] |
Interannual Variability Score [1] |
Overall Score [1] |
|||
|---|---|---|---|---|---|---|---|---|---|---|---|---|---|---|---|---|---|
| Benchmark | [-] | 443. | |||||||||||||||
| Calib | [-] | 449. | 448. | 443. | 434. | 4.91 | 12.9 | 0.743 | 0.732 | 0.576 | 0.894 | 1.00 | 0.661 | 0.740 | |||
| Control | [-] | 447. | 447. | 443. | 434. | 3.15 | 12.6 | 0.762 | 0.757 | 0.574 | 0.892 | 1.00 | 0.651 | 0.741 |
Download Data |
Period Mean (original grids) [W/m2] |
Model Period Mean (intersection) [W/m2] |
Model Period Mean (complement) [W/m2] |
Benchmark Period Mean (intersection) [W/m2] |
Benchmark Period Mean (complement) [W/m2] |
Bias [W/m2] |
RMSE [W/m2] |
Phase Shift [months] |
Bias Score [1] |
RMSE Score [1] |
Seasonal Cycle Score [1] |
Spatial Distribution Score [1] |
Interannual Variability Score [1] |
Overall Score [1] |
|||
|---|---|---|---|---|---|---|---|---|---|---|---|---|---|---|---|---|---|
| Benchmark | [-] | 383. | |||||||||||||||
| Calib | [-] | 388. | 387. | 381. | 396. | 6.64 | 20.5 | 0.936 | 0.617 | 0.566 | 0.882 | 0.994 | 0.624 | 0.708 | |||
| Control | [-] | 387. | 387. | 381. | 396. | 6.08 | 20.3 | 0.938 | 0.622 | 0.568 | 0.881 | 0.993 | 0.621 | 0.709 |
Temporally integrated period mean