Mean State
Download Data |
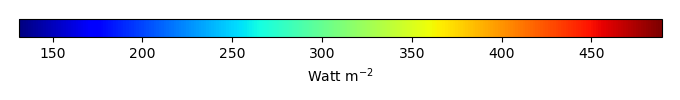
Period Mean (original grids) [Watt m-2] |
Model Period Mean (intersection) [Watt m-2] |
Model Period Mean (complement) [Watt m-2] |
Benchmark Period Mean (intersection) [Watt m-2] |
Benchmark Period Mean (complement) [Watt m-2] |
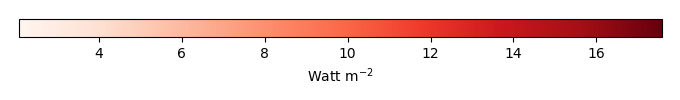
Bias [Watt m-2] |
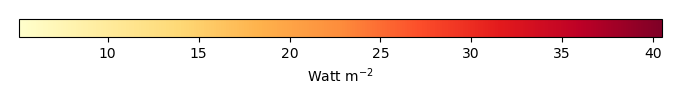
RMSE [Watt m-2] |
Phase Shift [months] |
Bias Score [1] |
RMSE Score [1] |
Seasonal Cycle Score [1] |
Spatial Distribution Score [1] |
Interannual Variability Score [1] |
Overall Score [1] |
|||
|---|---|---|---|---|---|---|---|---|---|---|---|---|---|---|---|---|---|
| Benchmark | [-] | 453. | |||||||||||||||
| Calib | [-] | 461. | 461. | 453. | 460. | 8.92 | 15.3 | 1.69 | 0.334 | 0.384 | 0.746 | 0.969 | 0.712 | 0.588 | |||
| Control | [-] | 459. | 459. | 453. | 460. | 6.94 | 14.3 | 1.63 | 0.382 | 0.379 | 0.760 | 0.968 | 0.709 | 0.596 |
Download Data |
Period Mean (original grids) [Watt m-2] |
Model Period Mean (intersection) [Watt m-2] |
Model Period Mean (complement) [Watt m-2] |
Benchmark Period Mean (intersection) [Watt m-2] |
Benchmark Period Mean (complement) [Watt m-2] |
Bias [Watt m-2] |
RMSE [Watt m-2] |
Phase Shift [months] |
Bias Score [1] |
RMSE Score [1] |
Seasonal Cycle Score [1] |
Spatial Distribution Score [1] |
Interannual Variability Score [1] |
Overall Score [1] |
|||
|---|---|---|---|---|---|---|---|---|---|---|---|---|---|---|---|---|---|
| Benchmark | [-] | 471. | |||||||||||||||
| Calib | [-] | 478. | 479. | 471. | 456. | 7.02 | 18.2 | 0.662 | 0.624 | 0.523 | 0.951 | 0.976 | 0.700 | 0.716 | |||
| Control | [-] | 476. | 476. | 471. | 456. | 4.64 | 17.3 | 0.646 | 0.668 | 0.518 | 0.953 | 0.972 | 0.694 | 0.721 |
Download Data |
Period Mean (original grids) [Watt m-2] |
Model Period Mean (intersection) [Watt m-2] |
Model Period Mean (complement) [Watt m-2] |
Benchmark Period Mean (intersection) [Watt m-2] |
Benchmark Period Mean (complement) [Watt m-2] |
Bias [Watt m-2] |
RMSE [Watt m-2] |
Phase Shift [months] |
Bias Score [1] |
RMSE Score [1] |
Seasonal Cycle Score [1] |
Spatial Distribution Score [1] |
Interannual Variability Score [1] |
Overall Score [1] |
|||
|---|---|---|---|---|---|---|---|---|---|---|---|---|---|---|---|---|---|
| Benchmark | [-] | 443. | |||||||||||||||
| Calib | [-] | 448. | 448. | 443. | 444. | 4.97 | 15.4 | 0.829 | 0.617 | 0.532 | 0.902 | 1.00 | 0.617 | 0.700 | |||
| Control | [-] | 446. | 446. | 443. | 444. | 2.79 | 14.7 | 0.875 | 0.669 | 0.527 | 0.895 | 1.00 | 0.612 | 0.705 |
Download Data |
Period Mean (original grids) [Watt m-2] |
Model Period Mean (intersection) [Watt m-2] |
Model Period Mean (complement) [Watt m-2] |
Benchmark Period Mean (intersection) [Watt m-2] |
Benchmark Period Mean (complement) [Watt m-2] |
Bias [Watt m-2] |
RMSE [Watt m-2] |
Phase Shift [months] |
Bias Score [1] |
RMSE Score [1] |
Seasonal Cycle Score [1] |
Spatial Distribution Score [1] |
Interannual Variability Score [1] |
Overall Score [1] |
|||
|---|---|---|---|---|---|---|---|---|---|---|---|---|---|---|---|---|---|
| Benchmark | [-] | 276. | |||||||||||||||
| Calib | [-] | 275. | 275. | 275. | 292. | 3.16 | 15.4 | 0.0640 | 0.906 | 0.805 | 0.995 | 0.991 | 0.796 | 0.883 | |||
| Control | [-] | 275. | 275. | 275. | 292. | 3.23 | 15.4 | 0.0632 | 0.905 | 0.805 | 0.996 | 0.990 | 0.792 | 0.882 |
Download Data |
Period Mean (original grids) [Watt m-2] |
Model Period Mean (intersection) [Watt m-2] |
Model Period Mean (complement) [Watt m-2] |
Benchmark Period Mean (intersection) [Watt m-2] |
Benchmark Period Mean (complement) [Watt m-2] |
Bias [Watt m-2] |
RMSE [Watt m-2] |
Phase Shift [months] |
Bias Score [1] |
RMSE Score [1] |
Seasonal Cycle Score [1] |
Spatial Distribution Score [1] |
Interannual Variability Score [1] |
Overall Score [1] |
|||
|---|---|---|---|---|---|---|---|---|---|---|---|---|---|---|---|---|---|
| Benchmark | [-] | 456. | |||||||||||||||
| Calib | [-] | 458. | 457. | 453. | 465. | 5.45 | 9.71 | 1.74 | 0.325 | 0.420 | 0.732 | 0.892 | 0.711 | 0.584 | |||
| Control | [-] | 456. | 456. | 453. | 465. | 4.25 | 9.30 | 1.78 | 0.341 | 0.419 | 0.725 | 0.893 | 0.705 | 0.584 |
Download Data |
Period Mean (original grids) [Watt m-2] |
Model Period Mean (intersection) [Watt m-2] |
Model Period Mean (complement) [Watt m-2] |
Benchmark Period Mean (intersection) [Watt m-2] |
Benchmark Period Mean (complement) [Watt m-2] |
Bias [Watt m-2] |
RMSE [Watt m-2] |
Phase Shift [months] |
Bias Score [1] |
RMSE Score [1] |
Seasonal Cycle Score [1] |
Spatial Distribution Score [1] |
Interannual Variability Score [1] |
Overall Score [1] |
|||
|---|---|---|---|---|---|---|---|---|---|---|---|---|---|---|---|---|---|
| Benchmark | [-] | 306. | |||||||||||||||
| Calib | [-] | 315. | 315. | 306. | 329. | 9.21 | 14.3 | 0.0208 | 0.870 | 0.863 | 0.999 | 0.988 | 0.893 | 0.912 | |||
| Control | [-] | 315. | 315. | 306. | 329. | 9.65 | 14.6 | 0.0208 | 0.865 | 0.862 | 0.999 | 0.993 | 0.891 | 0.912 |
Download Data |
Period Mean (original grids) [Watt m-2] |
Model Period Mean (intersection) [Watt m-2] |
Model Period Mean (complement) [Watt m-2] |
Benchmark Period Mean (intersection) [Watt m-2] |
Benchmark Period Mean (complement) [Watt m-2] |
Bias [Watt m-2] |
RMSE [Watt m-2] |
Phase Shift [months] |
Bias Score [1] |
RMSE Score [1] |
Seasonal Cycle Score [1] |
Spatial Distribution Score [1] |
Interannual Variability Score [1] |
Overall Score [1] |
|||
|---|---|---|---|---|---|---|---|---|---|---|---|---|---|---|---|---|---|
| Benchmark | [-] | 362. | |||||||||||||||
| Calib | [-] | 365. | 364. | 361. | 395. | 5.61 | 15.5 | 0.109 | 0.848 | 0.824 | 0.992 | 0.986 | 0.729 | 0.867 | |||
| Control | [-] | 364. | 363. | 361. | 395. | 5.14 | 15.5 | 0.111 | 0.853 | 0.821 | 0.992 | 0.986 | 0.724 | 0.866 |
Download Data |
Period Mean (original grids) [Watt m-2] |
Model Period Mean (intersection) [Watt m-2] |
Model Period Mean (complement) [Watt m-2] |
Benchmark Period Mean (intersection) [Watt m-2] |
Benchmark Period Mean (complement) [Watt m-2] |
Bias [Watt m-2] |
RMSE [Watt m-2] |
Phase Shift [months] |
Bias Score [1] |
RMSE Score [1] |
Seasonal Cycle Score [1] |
Spatial Distribution Score [1] |
Interannual Variability Score [1] |
Overall Score [1] |
|||
|---|---|---|---|---|---|---|---|---|---|---|---|---|---|---|---|---|---|
| Benchmark | [-] | 450. | |||||||||||||||
| Calib | [-] | 450. | 450. | 450. | 463. | 3.07 | 17.0 | 0.648 | 0.672 | 0.565 | 0.938 | 0.997 | 0.621 | 0.727 | |||
| Control | [-] | 448. | 449. | 450. | 463. | 1.20 | 16.5 | 0.667 | 0.688 | 0.568 | 0.933 | 0.995 | 0.620 | 0.729 |
Download Data |
Period Mean (original grids) [Watt m-2] |
Model Period Mean (intersection) [Watt m-2] |
Model Period Mean (complement) [Watt m-2] |
Benchmark Period Mean (intersection) [Watt m-2] |
Benchmark Period Mean (complement) [Watt m-2] |
Bias [Watt m-2] |
RMSE [Watt m-2] |
Phase Shift [months] |
Bias Score [1] |
RMSE Score [1] |
Seasonal Cycle Score [1] |
Spatial Distribution Score [1] |
Interannual Variability Score [1] |
Overall Score [1] |
|||
|---|---|---|---|---|---|---|---|---|---|---|---|---|---|---|---|---|---|
| Benchmark | [-] | 275. | |||||||||||||||
| Calib | [-] | 281. | 281. | 275. | 280. | 7.50 | 14.6 | 0.0317 | 0.879 | 0.824 | 0.997 | 0.993 | 0.849 | 0.895 | |||
| Control | [-] | 281. | 282. | 275. | 280. | 7.59 | 14.7 | 0.0319 | 0.878 | 0.825 | 0.997 | 0.992 | 0.846 | 0.894 |
Download Data |
Period Mean (original grids) [Watt m-2] |
Model Period Mean (intersection) [Watt m-2] |
Model Period Mean (complement) [Watt m-2] |
Benchmark Period Mean (intersection) [Watt m-2] |
Benchmark Period Mean (complement) [Watt m-2] |
Bias [Watt m-2] |
RMSE [Watt m-2] |
Phase Shift [months] |
Bias Score [1] |
RMSE Score [1] |
Seasonal Cycle Score [1] |
Spatial Distribution Score [1] |
Interannual Variability Score [1] |
Overall Score [1] |
|||
|---|---|---|---|---|---|---|---|---|---|---|---|---|---|---|---|---|---|
| Benchmark | [-] | 448. | |||||||||||||||
| Calib | [-] | 447. | 448. | 450. | 423. | -4.64 | 15.0 | 0.379 | 0.772 | 0.710 | 0.968 | 0.986 | 0.698 | 0.807 | |||
| Control | [-] | 446. | 446. | 450. | 423. | -6.12 | 15.4 | 0.358 | 0.769 | 0.710 | 0.971 | 0.982 | 0.694 | 0.806 |
Download Data |
Period Mean (original grids) [Watt m-2] |
Model Period Mean (intersection) [Watt m-2] |
Model Period Mean (complement) [Watt m-2] |
Benchmark Period Mean (intersection) [Watt m-2] |
Benchmark Period Mean (complement) [Watt m-2] |
Bias [Watt m-2] |
RMSE [Watt m-2] |
Phase Shift [months] |
Bias Score [1] |
RMSE Score [1] |
Seasonal Cycle Score [1] |
Spatial Distribution Score [1] |
Interannual Variability Score [1] |
Overall Score [1] |
|||
|---|---|---|---|---|---|---|---|---|---|---|---|---|---|---|---|---|---|
| Benchmark | [-] | 364. | |||||||||||||||
| Calib | [-] | 362. | 362. | 362. | 385. | 3.53 | 10.7 | 0.217 | 0.858 | 0.812 | 0.985 | 0.992 | 0.827 | 0.881 | |||
| Control | [-] | 362. | 362. | 362. | 385. | 3.33 | 10.8 | 0.221 | 0.859 | 0.810 | 0.985 | 0.990 | 0.825 | 0.880 |
Download Data |
Period Mean (original grids) [Watt m-2] |
Model Period Mean (intersection) [Watt m-2] |
Model Period Mean (complement) [Watt m-2] |
Benchmark Period Mean (intersection) [Watt m-2] |
Benchmark Period Mean (complement) [Watt m-2] |
Bias [Watt m-2] |
RMSE [Watt m-2] |
Phase Shift [months] |
Bias Score [1] |
RMSE Score [1] |
Seasonal Cycle Score [1] |
Spatial Distribution Score [1] |
Interannual Variability Score [1] |
Overall Score [1] |
|||
|---|---|---|---|---|---|---|---|---|---|---|---|---|---|---|---|---|---|
| Benchmark | [-] | 397. | |||||||||||||||
| Calib | [-] | 379. | 379. | 376. | 406. | 4.20 | 15.9 | 0.462 | 0.704 | 0.692 | 0.950 | 0.998 | 0.738 | 0.796 | |||
| Control | [-] | 378. | 378. | 376. | 406. | 3.44 | 15.7 | 0.468 | 0.717 | 0.691 | 0.949 | 0.998 | 0.735 | 0.797 |
Download Data |
Period Mean (original grids) [Watt m-2] |
Model Period Mean (intersection) [Watt m-2] |
Model Period Mean (complement) [Watt m-2] |
Benchmark Period Mean (intersection) [Watt m-2] |
Benchmark Period Mean (complement) [Watt m-2] |
Bias [Watt m-2] |
RMSE [Watt m-2] |
Phase Shift [months] |
Bias Score [1] |
RMSE Score [1] |
Seasonal Cycle Score [1] |
Spatial Distribution Score [1] |
Interannual Variability Score [1] |
Overall Score [1] |
|||
|---|---|---|---|---|---|---|---|---|---|---|---|---|---|---|---|---|---|
| Benchmark | [-] | 464. | |||||||||||||||
| Calib | [-] | 450. | 450. | 465. | 441. | -15.2 | 24.0 | 0.417 | 0.711 | 0.732 | 0.967 | 0.970 | 0.645 | 0.793 | |||
| Control | [-] | 450. | 449. | 465. | 441. | -15.5 | 24.1 | 0.414 | 0.709 | 0.732 | 0.967 | 0.972 | 0.644 | 0.793 |
Download Data |
Period Mean (original grids) [Watt m-2] |
Model Period Mean (intersection) [Watt m-2] |
Model Period Mean (complement) [Watt m-2] |
Benchmark Period Mean (intersection) [Watt m-2] |
Benchmark Period Mean (complement) [Watt m-2] |
Bias [Watt m-2] |
RMSE [Watt m-2] |
Phase Shift [months] |
Bias Score [1] |
RMSE Score [1] |
Seasonal Cycle Score [1] |
Spatial Distribution Score [1] |
Interannual Variability Score [1] |
Overall Score [1] |
|||
|---|---|---|---|---|---|---|---|---|---|---|---|---|---|---|---|---|---|
| Benchmark | [-] | 278. | |||||||||||||||
| Calib | [-] | 286. | 286. | 277. | 289. | 8.94 | 14.6 | 0.0582 | 0.850 | 0.835 | 0.996 | 0.994 | 0.817 | 0.888 | |||
| Control | [-] | 286. | 286. | 277. | 289. | 8.91 | 14.6 | 0.0587 | 0.850 | 0.835 | 0.996 | 0.993 | 0.813 | 0.887 |
Download Data |
Period Mean (original grids) [Watt m-2] |
Model Period Mean (intersection) [Watt m-2] |
Model Period Mean (complement) [Watt m-2] |
Benchmark Period Mean (intersection) [Watt m-2] |
Benchmark Period Mean (complement) [Watt m-2] |
Bias [Watt m-2] |
RMSE [Watt m-2] |
Phase Shift [months] |
Bias Score [1] |
RMSE Score [1] |
Seasonal Cycle Score [1] |
Spatial Distribution Score [1] |
Interannual Variability Score [1] |
Overall Score [1] |
|||
|---|---|---|---|---|---|---|---|---|---|---|---|---|---|---|---|---|---|
| Benchmark | [-] | 444. | |||||||||||||||
| Calib | [-] | 444. | 444. | 442. | 455. | 6.46 | 13.5 | 0.625 | 0.564 | 0.603 | 0.935 | 0.980 | 0.724 | 0.735 | |||
| Control | [-] | 443. | 442. | 442. | 455. | 4.70 | 12.6 | 0.613 | 0.601 | 0.606 | 0.937 | 0.981 | 0.721 | 0.742 |
Download Data |
Period Mean (original grids) [Watt m-2] |
Model Period Mean (intersection) [Watt m-2] |
Model Period Mean (complement) [Watt m-2] |
Benchmark Period Mean (intersection) [Watt m-2] |
Benchmark Period Mean (complement) [Watt m-2] |
Bias [Watt m-2] |
RMSE [Watt m-2] |
Phase Shift [months] |
Bias Score [1] |
RMSE Score [1] |
Seasonal Cycle Score [1] |
Spatial Distribution Score [1] |
Interannual Variability Score [1] |
Overall Score [1] |
|||
|---|---|---|---|---|---|---|---|---|---|---|---|---|---|---|---|---|---|
| Benchmark | [-] | 386. | |||||||||||||||
| Calib | [-] | 389. | 389. | 384. | 429. | 8.08 | 11.2 | 0.120 | 0.837 | 0.864 | 0.992 | 0.997 | 0.869 | 0.904 | |||
| Control | [-] | 389. | 389. | 384. | 429. | 7.38 | 10.8 | 0.116 | 0.848 | 0.862 | 0.992 | 0.998 | 0.863 | 0.904 |
Download Data |
Period Mean (original grids) [Watt m-2] |
Model Period Mean (intersection) [Watt m-2] |
Model Period Mean (complement) [Watt m-2] |
Benchmark Period Mean (intersection) [Watt m-2] |
Benchmark Period Mean (complement) [Watt m-2] |
Bias [Watt m-2] |
RMSE [Watt m-2] |
Phase Shift [months] |
Bias Score [1] |
RMSE Score [1] |
Seasonal Cycle Score [1] |
Spatial Distribution Score [1] |
Interannual Variability Score [1] |
Overall Score [1] |
|||
|---|---|---|---|---|---|---|---|---|---|---|---|---|---|---|---|---|---|
| Benchmark | [-] | 319. | |||||||||||||||
| Calib | [-] | 328. | 328. | 318. | 343. | 10.7 | 14.8 | 0.0749 | 0.825 | 0.841 | 0.995 | 0.989 | 0.841 | 0.889 | |||
| Control | [-] | 328. | 328. | 318. | 343. | 11.1 | 15.2 | 0.0816 | 0.819 | 0.840 | 0.995 | 0.986 | 0.836 | 0.886 |
Download Data |
Period Mean (original grids) [Watt m-2] |
Model Period Mean (intersection) [Watt m-2] |
Model Period Mean (complement) [Watt m-2] |
Benchmark Period Mean (intersection) [Watt m-2] |
Benchmark Period Mean (complement) [Watt m-2] |
Bias [Watt m-2] |
RMSE [Watt m-2] |
Phase Shift [months] |
Bias Score [1] |
RMSE Score [1] |
Seasonal Cycle Score [1] |
Spatial Distribution Score [1] |
Interannual Variability Score [1] |
Overall Score [1] |
|||
|---|---|---|---|---|---|---|---|---|---|---|---|---|---|---|---|---|---|
| Benchmark | [-] | 376. | |||||||||||||||
| Calib | [-] | 379. | 380. | 376. | 379. | 4.29 | 16.3 | 0.0906 | 0.858 | 0.798 | 0.994 | 0.982 | 0.714 | 0.857 | |||
| Control | [-] | 379. | 380. | 376. | 379. | 3.88 | 16.3 | 0.0943 | 0.862 | 0.794 | 0.994 | 0.978 | 0.704 | 0.854 |
Download Data |
Period Mean (original grids) [Watt m-2] |
Model Period Mean (intersection) [Watt m-2] |
Model Period Mean (complement) [Watt m-2] |
Benchmark Period Mean (intersection) [Watt m-2] |
Benchmark Period Mean (complement) [Watt m-2] |
Bias [Watt m-2] |
RMSE [Watt m-2] |
Phase Shift [months] |
Bias Score [1] |
RMSE Score [1] |
Seasonal Cycle Score [1] |
Spatial Distribution Score [1] |
Interannual Variability Score [1] |
Overall Score [1] |
|||
|---|---|---|---|---|---|---|---|---|---|---|---|---|---|---|---|---|---|
| Benchmark | [-] | 449. | |||||||||||||||
| Calib | [-] | 457. | 457. | 449. | 458. | 8.36 | 13.5 | 1.18 | 0.407 | 0.404 | 0.832 | 0.956 | 0.632 | 0.606 | |||
| Control | [-] | 456. | 456. | 449. | 458. | 7.05 | 12.7 | 1.26 | 0.454 | 0.399 | 0.822 | 0.962 | 0.626 | 0.610 |
Download Data |
Period Mean (original grids) [Watt m-2] |
Model Period Mean (intersection) [Watt m-2] |
Model Period Mean (complement) [Watt m-2] |
Benchmark Period Mean (intersection) [Watt m-2] |
Benchmark Period Mean (complement) [Watt m-2] |
Bias [Watt m-2] |
RMSE [Watt m-2] |
Phase Shift [months] |
Bias Score [1] |
RMSE Score [1] |
Seasonal Cycle Score [1] |
Spatial Distribution Score [1] |
Interannual Variability Score [1] |
Overall Score [1] |
|||
|---|---|---|---|---|---|---|---|---|---|---|---|---|---|---|---|---|---|
| Benchmark | [-] | 440. | |||||||||||||||
| Calib | [-] | 448. | 447. | 440. | 430. | 6.52 | 11.6 | 0.607 | 0.683 | 0.619 | 0.928 | 0.997 | 0.729 | 0.763 | |||
| Control | [-] | 446. | 445. | 440. | 430. | 4.73 | 10.9 | 0.642 | 0.729 | 0.617 | 0.921 | 0.999 | 0.719 | 0.767 |
Download Data |
Period Mean (original grids) [Watt m-2] |
Model Period Mean (intersection) [Watt m-2] |
Model Period Mean (complement) [Watt m-2] |
Benchmark Period Mean (intersection) [Watt m-2] |
Benchmark Period Mean (complement) [Watt m-2] |
Bias [Watt m-2] |
RMSE [Watt m-2] |
Phase Shift [months] |
Bias Score [1] |
RMSE Score [1] |
Seasonal Cycle Score [1] |
Spatial Distribution Score [1] |
Interannual Variability Score [1] |
Overall Score [1] |
|||
|---|---|---|---|---|---|---|---|---|---|---|---|---|---|---|---|---|---|
| Benchmark | [-] | 387. | |||||||||||||||
| Calib | [-] | 388. | 387. | 386. | 394. | 1.86 | 16.9 | 0.600 | 0.619 | 0.627 | 0.939 | 0.993 | 0.696 | 0.750 | |||
| Control | [-] | 387. | 387. | 386. | 394. | 1.31 | 16.8 | 0.575 | 0.623 | 0.628 | 0.941 | 0.991 | 0.694 | 0.751 |
Temporally integrated period mean