Mean State
Download Data |
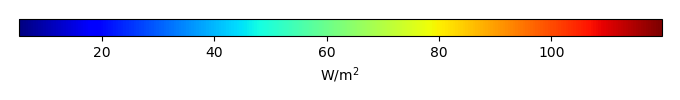
Period Mean (original grids) [W/m2] |
Model Period Mean (intersection) [W/m2] |
Model Period Mean (complement) [W/m2] |
Benchmark Period Mean (intersection) [W/m2] |
Benchmark Period Mean (complement) [W/m2] |
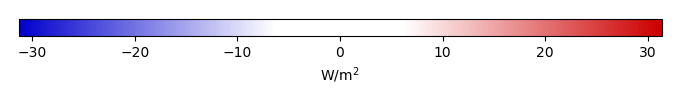
Bias [W/m2] |
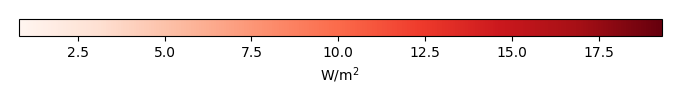
RMSE [W/m2] |
Phase Shift [months] |
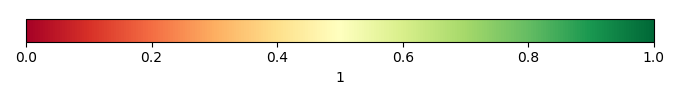
Bias Score [1] |
RMSE Score [1] |
Seasonal Cycle Score [1] |
Spatial Distribution Score [1] |
Interannual Variability Score [1] |
Overall Score [1] |
|||
|---|---|---|---|---|---|---|---|---|---|---|---|---|---|---|---|---|---|
| Benchmark | [-] | 31.3 | |||||||||||||||
| Calib | [-] | 33.8 | 33.5 | 32.3 | 12.4 | 1.84 | 7.11 | 1.87 | 0.457 | 0.343 | 0.731 | 0.956 | 0.659 | 0.581 | |||
| Control | [-] | 33.6 | 33.3 | 32.3 | 12.4 | 1.61 | 7.16 | 1.89 | 0.457 | 0.340 | 0.728 | 0.948 | 0.660 | 0.579 |
Download Data |
Period Mean (original grids) [W/m2] |
Model Period Mean (intersection) [W/m2] |
Model Period Mean (complement) [W/m2] |
Benchmark Period Mean (intersection) [W/m2] |
Benchmark Period Mean (complement) [W/m2] |
Bias [W/m2] |
RMSE [W/m2] |
Phase Shift [months] |
Bias Score [1] |
RMSE Score [1] |
Seasonal Cycle Score [1] |
Spatial Distribution Score [1] |
Interannual Variability Score [1] |
Overall Score [1] |
|||
|---|---|---|---|---|---|---|---|---|---|---|---|---|---|---|---|---|---|
| Benchmark | [-] | 44.7 | |||||||||||||||
| Calib | [-] | 45.9 | 46.4 | 45.1 | 13.9 | 1.01 | 8.25 | 1.04 | 0.524 | 0.365 | 0.872 | 0.983 | 0.633 | 0.624 | |||
| Control | [-] | 45.6 | 46.1 | 45.1 | 13.9 | 0.680 | 8.31 | 1.04 | 0.529 | 0.359 | 0.873 | 0.981 | 0.638 | 0.623 |
Download Data |
Period Mean (original grids) [W/m2] |
Model Period Mean (intersection) [W/m2] |
Model Period Mean (complement) [W/m2] |
Benchmark Period Mean (intersection) [W/m2] |
Benchmark Period Mean (complement) [W/m2] |
Bias [W/m2] |
RMSE [W/m2] |
Phase Shift [months] |
Bias Score [1] |
RMSE Score [1] |
Seasonal Cycle Score [1] |
Spatial Distribution Score [1] |
Interannual Variability Score [1] |
Overall Score [1] |
|||
|---|---|---|---|---|---|---|---|---|---|---|---|---|---|---|---|---|---|
| Benchmark | [-] | 33.4 | |||||||||||||||
| Calib | [-] | 36.2 | 36.2 | 34.3 | 15.0 | 1.93 | 7.80 | 1.41 | 0.594 | 0.427 | 0.808 | 0.928 | 0.650 | 0.639 | |||
| Control | [-] | 35.8 | 35.8 | 34.3 | 15.0 | 1.57 | 7.78 | 1.43 | 0.596 | 0.428 | 0.803 | 0.920 | 0.653 | 0.638 |
Download Data |
Period Mean (original grids) [W/m2] |
Model Period Mean (intersection) [W/m2] |
Model Period Mean (complement) [W/m2] |
Benchmark Period Mean (intersection) [W/m2] |
Benchmark Period Mean (complement) [W/m2] |
Bias [W/m2] |
RMSE [W/m2] |
Phase Shift [months] |
Bias Score [1] |
RMSE Score [1] |
Seasonal Cycle Score [1] |
Spatial Distribution Score [1] |
Interannual Variability Score [1] |
Overall Score [1] |
|||
|---|---|---|---|---|---|---|---|---|---|---|---|---|---|---|---|---|---|
| Benchmark | [-] | 40.8 | |||||||||||||||
| Calib | [-] | 36.4 | 36.4 | 41.2 | 35.6 | -4.57 | 19.2 | 0.181 | 0.850 | 0.687 | 0.988 | 0.745 | 0.700 | 0.776 | |||
| Control | [-] | 36.6 | 36.5 | 41.2 | 35.6 | -4.38 | 18.9 | 0.179 | 0.852 | 0.692 | 0.988 | 0.755 | 0.694 | 0.779 |
Download Data |
Period Mean (original grids) [W/m2] |
Model Period Mean (intersection) [W/m2] |
Model Period Mean (complement) [W/m2] |
Benchmark Period Mean (intersection) [W/m2] |
Benchmark Period Mean (complement) [W/m2] |
Bias [W/m2] |
RMSE [W/m2] |
Phase Shift [months] |
Bias Score [1] |
RMSE Score [1] |
Seasonal Cycle Score [1] |
Spatial Distribution Score [1] |
Interannual Variability Score [1] |
Overall Score [1] |
|||
|---|---|---|---|---|---|---|---|---|---|---|---|---|---|---|---|---|---|
| Benchmark | [-] | 17.7 | |||||||||||||||
| Calib | [-] | 26.6 | 26.6 | 19.3 | 12.3 | 7.98 | 9.94 | 1.50 | 0.287 | 0.372 | 0.771 | 0.359 | 0.684 | 0.474 | |||
| Control | [-] | 26.6 | 26.6 | 19.3 | 12.3 | 7.97 | 9.93 | 1.50 | 0.287 | 0.373 | 0.771 | 0.353 | 0.684 | 0.473 |
Download Data |
Period Mean (original grids) [W/m2] |
Model Period Mean (intersection) [W/m2] |
Model Period Mean (complement) [W/m2] |
Benchmark Period Mean (intersection) [W/m2] |
Benchmark Period Mean (complement) [W/m2] |
Bias [W/m2] |
RMSE [W/m2] |
Phase Shift [months] |
Bias Score [1] |
RMSE Score [1] |
Seasonal Cycle Score [1] |
Spatial Distribution Score [1] |
Interannual Variability Score [1] |
Overall Score [1] |
|||
|---|---|---|---|---|---|---|---|---|---|---|---|---|---|---|---|---|---|
| Benchmark | [-] | 28.1 | |||||||||||||||
| Calib | [-] | 23.5 | 23.4 | 28.2 | 21.3 | -4.75 | 12.1 | 0.308 | 0.782 | 0.612 | 0.978 | 0.943 | 0.635 | 0.760 | |||
| Control | [-] | 23.9 | 23.8 | 28.2 | 21.3 | -4.37 | 11.5 | 0.252 | 0.794 | 0.625 | 0.983 | 0.943 | 0.634 | 0.767 |
Download Data |
Period Mean (original grids) [W/m2] |
Model Period Mean (intersection) [W/m2] |
Model Period Mean (complement) [W/m2] |
Benchmark Period Mean (intersection) [W/m2] |
Benchmark Period Mean (complement) [W/m2] |
Bias [W/m2] |
RMSE [W/m2] |
Phase Shift [months] |
Bias Score [1] |
RMSE Score [1] |
Seasonal Cycle Score [1] |
Spatial Distribution Score [1] |
Interannual Variability Score [1] |
Overall Score [1] |
|||
|---|---|---|---|---|---|---|---|---|---|---|---|---|---|---|---|---|---|
| Benchmark | [-] | 35.8 | |||||||||||||||
| Calib | [-] | 35.3 | 35.2 | 36.5 | 15.2 | -1.96 | 10.7 | 0.910 | 0.703 | 0.548 | 0.882 | 0.926 | 0.686 | 0.715 | |||
| Control | [-] | 35.0 | 34.9 | 36.5 | 15.2 | -2.27 | 10.8 | 0.920 | 0.696 | 0.547 | 0.880 | 0.912 | 0.687 | 0.712 |
Download Data |
Period Mean (original grids) [W/m2] |
Model Period Mean (intersection) [W/m2] |
Model Period Mean (complement) [W/m2] |
Benchmark Period Mean (intersection) [W/m2] |
Benchmark Period Mean (complement) [W/m2] |
Bias [W/m2] |
RMSE [W/m2] |
Phase Shift [months] |
Bias Score [1] |
RMSE Score [1] |
Seasonal Cycle Score [1] |
Spatial Distribution Score [1] |
Interannual Variability Score [1] |
Overall Score [1] |
|||
|---|---|---|---|---|---|---|---|---|---|---|---|---|---|---|---|---|---|
| Benchmark | [-] | 29.2 | |||||||||||||||
| Calib | [-] | 32.3 | 32.2 | 30.4 | 12.7 | 1.34 | 9.24 | 1.06 | 0.555 | 0.434 | 0.873 | 0.824 | 0.634 | 0.626 | |||
| Control | [-] | 32.2 | 32.1 | 30.4 | 12.7 | 1.27 | 9.24 | 1.06 | 0.554 | 0.432 | 0.873 | 0.823 | 0.635 | 0.625 |
Download Data |
Period Mean (original grids) [W/m2] |
Model Period Mean (intersection) [W/m2] |
Model Period Mean (complement) [W/m2] |
Benchmark Period Mean (intersection) [W/m2] |
Benchmark Period Mean (complement) [W/m2] |
Bias [W/m2] |
RMSE [W/m2] |
Phase Shift [months] |
Bias Score [1] |
RMSE Score [1] |
Seasonal Cycle Score [1] |
Spatial Distribution Score [1] |
Interannual Variability Score [1] |
Overall Score [1] |
|||
|---|---|---|---|---|---|---|---|---|---|---|---|---|---|---|---|---|---|
| Benchmark | [-] | 36.1 | |||||||||||||||
| Calib | [-] | 34.0 | 33.8 | 36.1 | 36.1 | -2.00 | 16.9 | 0.155 | 0.897 | 0.706 | 0.989 | 0.813 | 0.720 | 0.805 | |||
| Control | [-] | 34.2 | 34.0 | 36.1 | 36.1 | -1.77 | 16.7 | 0.154 | 0.899 | 0.709 | 0.990 | 0.814 | 0.719 | 0.807 |
Download Data |
Period Mean (original grids) [W/m2] |
Model Period Mean (intersection) [W/m2] |
Model Period Mean (complement) [W/m2] |
Benchmark Period Mean (intersection) [W/m2] |
Benchmark Period Mean (complement) [W/m2] |
Bias [W/m2] |
RMSE [W/m2] |
Phase Shift [months] |
Bias Score [1] |
RMSE Score [1] |
Seasonal Cycle Score [1] |
Spatial Distribution Score [1] |
Interannual Variability Score [1] |
Overall Score [1] |
|||
|---|---|---|---|---|---|---|---|---|---|---|---|---|---|---|---|---|---|
| Benchmark | [-] | 36.6 | |||||||||||||||
| Calib | [-] | 41.9 | 41.9 | 38.5 | 12.8 | 2.21 | 8.21 | 0.640 | 0.658 | 0.580 | 0.942 | 0.913 | 0.661 | 0.722 | |||
| Control | [-] | 41.2 | 41.2 | 38.5 | 12.8 | 1.53 | 8.22 | 0.638 | 0.659 | 0.579 | 0.940 | 0.904 | 0.684 | 0.724 |
Download Data |
Period Mean (original grids) [W/m2] |
Model Period Mean (intersection) [W/m2] |
Model Period Mean (complement) [W/m2] |
Benchmark Period Mean (intersection) [W/m2] |
Benchmark Period Mean (complement) [W/m2] |
Bias [W/m2] |
RMSE [W/m2] |
Phase Shift [months] |
Bias Score [1] |
RMSE Score [1] |
Seasonal Cycle Score [1] |
Spatial Distribution Score [1] |
Interannual Variability Score [1] |
Overall Score [1] |
|||
|---|---|---|---|---|---|---|---|---|---|---|---|---|---|---|---|---|---|
| Benchmark | [-] | 19.6 | |||||||||||||||
| Calib | [-] | 21.5 | 21.5 | 20.5 | 10.1 | 0.903 | 8.55 | 0.750 | 0.686 | 0.582 | 0.911 | 0.833 | 0.632 | 0.704 | |||
| Control | [-] | 21.6 | 21.6 | 20.5 | 10.1 | 0.951 | 8.54 | 0.795 | 0.688 | 0.581 | 0.901 | 0.822 | 0.638 | 0.702 |
Download Data |
Period Mean (original grids) [W/m2] |
Model Period Mean (intersection) [W/m2] |
Model Period Mean (complement) [W/m2] |
Benchmark Period Mean (intersection) [W/m2] |
Benchmark Period Mean (complement) [W/m2] |
Bias [W/m2] |
RMSE [W/m2] |
Phase Shift [months] |
Bias Score [1] |
RMSE Score [1] |
Seasonal Cycle Score [1] |
Spatial Distribution Score [1] |
Interannual Variability Score [1] |
Overall Score [1] |
|||
|---|---|---|---|---|---|---|---|---|---|---|---|---|---|---|---|---|---|
| Benchmark | [-] | 24.0 | |||||||||||||||
| Calib | [-] | 45.1 | 45.1 | 44.8 | 14.0 | -0.753 | 12.3 | 0.759 | 0.656 | 0.558 | 0.907 | 0.991 | 0.666 | 0.722 | |||
| Control | [-] | 44.9 | 44.9 | 44.8 | 14.0 | -0.896 | 12.2 | 0.759 | 0.655 | 0.558 | 0.906 | 0.991 | 0.670 | 0.723 |
Download Data |
Period Mean (original grids) [W/m2] |
Model Period Mean (intersection) [W/m2] |
Model Period Mean (complement) [W/m2] |
Benchmark Period Mean (intersection) [W/m2] |
Benchmark Period Mean (complement) [W/m2] |
Bias [W/m2] |
RMSE [W/m2] |
Phase Shift [months] |
Bias Score [1] |
RMSE Score [1] |
Seasonal Cycle Score [1] |
Spatial Distribution Score [1] |
Interannual Variability Score [1] |
Overall Score [1] |
|||
|---|---|---|---|---|---|---|---|---|---|---|---|---|---|---|---|---|---|
| Benchmark | [-] | 72.5 | |||||||||||||||
| Calib | [-] | 78.8 | 78.6 | 74.7 | 16.4 | 1.98 | 13.7 | 0.685 | 0.593 | 0.569 | 0.931 | 0.981 | 0.690 | 0.722 | |||
| Control | [-] | 78.4 | 78.2 | 74.7 | 16.4 | 1.59 | 13.8 | 0.695 | 0.592 | 0.563 | 0.930 | 0.982 | 0.704 | 0.722 |
Download Data |
Period Mean (original grids) [W/m2] |
Model Period Mean (intersection) [W/m2] |
Model Period Mean (complement) [W/m2] |
Benchmark Period Mean (intersection) [W/m2] |
Benchmark Period Mean (complement) [W/m2] |
Bias [W/m2] |
RMSE [W/m2] |
Phase Shift [months] |
Bias Score [1] |
RMSE Score [1] |
Seasonal Cycle Score [1] |
Spatial Distribution Score [1] |
Interannual Variability Score [1] |
Overall Score [1] |
|||
|---|---|---|---|---|---|---|---|---|---|---|---|---|---|---|---|---|---|
| Benchmark | [-] | 46.1 | |||||||||||||||
| Calib | [-] | 38.1 | 38.1 | 46.3 | 43.2 | -7.26 | 22.3 | 0.200 | 0.845 | 0.677 | 0.984 | 0.927 | 0.693 | 0.801 | |||
| Control | [-] | 38.4 | 38.3 | 46.3 | 43.2 | -7.00 | 22.0 | 0.189 | 0.848 | 0.681 | 0.985 | 0.927 | 0.690 | 0.802 |
Download Data |
Period Mean (original grids) [W/m2] |
Model Period Mean (intersection) [W/m2] |
Model Period Mean (complement) [W/m2] |
Benchmark Period Mean (intersection) [W/m2] |
Benchmark Period Mean (complement) [W/m2] |
Bias [W/m2] |
RMSE [W/m2] |
Phase Shift [months] |
Bias Score [1] |
RMSE Score [1] |
Seasonal Cycle Score [1] |
Spatial Distribution Score [1] |
Interannual Variability Score [1] |
Overall Score [1] |
|||
|---|---|---|---|---|---|---|---|---|---|---|---|---|---|---|---|---|---|
| Benchmark | [-] | 26.3 | |||||||||||||||
| Calib | [-] | 34.2 | 34.2 | 28.9 | 13.2 | 4.61 | 10.2 | 0.717 | 0.456 | 0.497 | 0.910 | 0.707 | 0.658 | 0.621 | |||
| Control | [-] | 33.7 | 33.7 | 28.9 | 13.2 | 4.26 | 10.3 | 0.711 | 0.447 | 0.498 | 0.912 | 0.675 | 0.670 | 0.617 |
Download Data |
Period Mean (original grids) [W/m2] |
Model Period Mean (intersection) [W/m2] |
Model Period Mean (complement) [W/m2] |
Benchmark Period Mean (intersection) [W/m2] |
Benchmark Period Mean (complement) [W/m2] |
Bias [W/m2] |
RMSE [W/m2] |
Phase Shift [months] |
Bias Score [1] |
RMSE Score [1] |
Seasonal Cycle Score [1] |
Spatial Distribution Score [1] |
Interannual Variability Score [1] |
Overall Score [1] |
|||
|---|---|---|---|---|---|---|---|---|---|---|---|---|---|---|---|---|---|
| Benchmark | [-] | 26.9 | |||||||||||||||
| Calib | [-] | 26.7 | 26.6 | 27.6 | 12.3 | -1.14 | 8.13 | 0.948 | 0.691 | 0.549 | 0.860 | 0.817 | 0.661 | 0.688 | |||
| Control | [-] | 26.8 | 26.7 | 27.6 | 12.3 | -1.01 | 8.27 | 1.06 | 0.694 | 0.543 | 0.838 | 0.844 | 0.657 | 0.687 |
Download Data |
Period Mean (original grids) [W/m2] |
Model Period Mean (intersection) [W/m2] |
Model Period Mean (complement) [W/m2] |
Benchmark Period Mean (intersection) [W/m2] |
Benchmark Period Mean (complement) [W/m2] |
Bias [W/m2] |
RMSE [W/m2] |
Phase Shift [months] |
Bias Score [1] |
RMSE Score [1] |
Seasonal Cycle Score [1] |
Spatial Distribution Score [1] |
Interannual Variability Score [1] |
Overall Score [1] |
|||
|---|---|---|---|---|---|---|---|---|---|---|---|---|---|---|---|---|---|
| Benchmark | [-] | 26.3 | |||||||||||||||
| Calib | [-] | 23.2 | 23.3 | 26.9 | 10.9 | -3.74 | 12.7 | 0.432 | 0.726 | 0.562 | 0.949 | 0.957 | 0.607 | 0.727 | |||
| Control | [-] | 23.6 | 23.7 | 26.9 | 10.9 | -3.35 | 12.2 | 0.362 | 0.734 | 0.573 | 0.958 | 0.955 | 0.608 | 0.733 |
Download Data |
Period Mean (original grids) [W/m2] |
Model Period Mean (intersection) [W/m2] |
Model Period Mean (complement) [W/m2] |
Benchmark Period Mean (intersection) [W/m2] |
Benchmark Period Mean (complement) [W/m2] |
Bias [W/m2] |
RMSE [W/m2] |
Phase Shift [months] |
Bias Score [1] |
RMSE Score [1] |
Seasonal Cycle Score [1] |
Spatial Distribution Score [1] |
Interannual Variability Score [1] |
Overall Score [1] |
|||
|---|---|---|---|---|---|---|---|---|---|---|---|---|---|---|---|---|---|
| Benchmark | [-] | 38.3 | |||||||||||||||
| Calib | [-] | 34.6 | 34.6 | 38.7 | 12.8 | -4.45 | 9.90 | 0.975 | 0.688 | 0.585 | 0.849 | 0.993 | 0.714 | 0.736 | |||
| Control | [-] | 34.0 | 34.0 | 38.7 | 12.8 | -5.08 | 10.1 | 0.921 | 0.667 | 0.589 | 0.860 | 0.985 | 0.731 | 0.737 |
Download Data |
Period Mean (original grids) [W/m2] |
Model Period Mean (intersection) [W/m2] |
Model Period Mean (complement) [W/m2] |
Benchmark Period Mean (intersection) [W/m2] |
Benchmark Period Mean (complement) [W/m2] |
Bias [W/m2] |
RMSE [W/m2] |
Phase Shift [months] |
Bias Score [1] |
RMSE Score [1] |
Seasonal Cycle Score [1] |
Spatial Distribution Score [1] |
Interannual Variability Score [1] |
Overall Score [1] |
|||
|---|---|---|---|---|---|---|---|---|---|---|---|---|---|---|---|---|---|
| Benchmark | [-] | 27.6 | |||||||||||||||
| Calib | [-] | 26.4 | 26.4 | 28.0 | 11.7 | -1.39 | 5.27 | 1.16 | 0.489 | 0.454 | 0.856 | 0.728 | 0.619 | 0.600 | |||
| Control | [-] | 26.4 | 26.4 | 28.0 | 11.7 | -1.42 | 5.26 | 1.15 | 0.488 | 0.454 | 0.857 | 0.710 | 0.619 | 0.597 |
Download Data |
Period Mean (original grids) [W/m2] |
Model Period Mean (intersection) [W/m2] |
Model Period Mean (complement) [W/m2] |
Benchmark Period Mean (intersection) [W/m2] |
Benchmark Period Mean (complement) [W/m2] |
Bias [W/m2] |
RMSE [W/m2] |
Phase Shift [months] |
Bias Score [1] |
RMSE Score [1] |
Seasonal Cycle Score [1] |
Spatial Distribution Score [1] |
Interannual Variability Score [1] |
Overall Score [1] |
|||
|---|---|---|---|---|---|---|---|---|---|---|---|---|---|---|---|---|---|
| Benchmark | [-] | 31.2 | |||||||||||||||
| Calib | [-] | 30.7 | 30.7 | 31.8 | 11.7 | -1.13 | 6.43 | 1.13 | 0.634 | 0.510 | 0.858 | 0.653 | 0.634 | 0.633 | |||
| Control | [-] | 30.5 | 30.5 | 31.8 | 11.7 | -1.35 | 6.44 | 1.11 | 0.628 | 0.511 | 0.860 | 0.647 | 0.632 | 0.631 |
Download Data |
Period Mean (original grids) [W/m2] |
Model Period Mean (intersection) [W/m2] |
Model Period Mean (complement) [W/m2] |
Benchmark Period Mean (intersection) [W/m2] |
Benchmark Period Mean (complement) [W/m2] |
Bias [W/m2] |
RMSE [W/m2] |
Phase Shift [months] |
Bias Score [1] |
RMSE Score [1] |
Seasonal Cycle Score [1] |
Spatial Distribution Score [1] |
Interannual Variability Score [1] |
Overall Score [1] |
|||
|---|---|---|---|---|---|---|---|---|---|---|---|---|---|---|---|---|---|
| Benchmark | [-] | 30.1 | |||||||||||||||
| Calib | [-] | 32.9 | 32.9 | 32.0 | 13.9 | 0.464 | 9.93 | 0.849 | 0.557 | 0.532 | 0.906 | 0.962 | 0.705 | 0.699 | |||
| Control | [-] | 32.3 | 32.3 | 32.0 | 13.9 | -0.0714 | 9.92 | 0.859 | 0.557 | 0.533 | 0.905 | 0.959 | 0.715 | 0.700 |
Temporally integrated period mean