Mean State
Download Data |
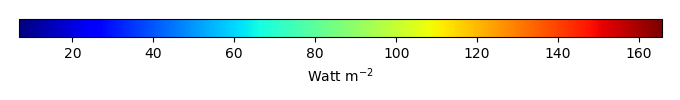
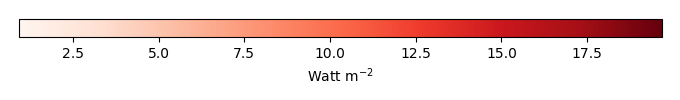
Period Mean (original grids) [Watt m-2] |
Model Period Mean (intersection) [Watt m-2] |
Model Period Mean (complement) [Watt m-2] |
Benchmark Period Mean (intersection) [Watt m-2] |
Benchmark Period Mean (complement) [Watt m-2] |
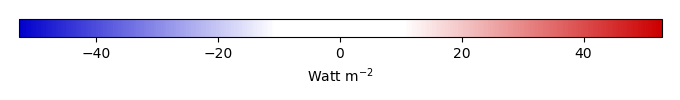
Bias [Watt m-2] |
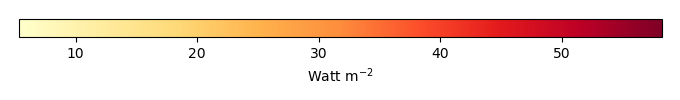
RMSE [Watt m-2] |
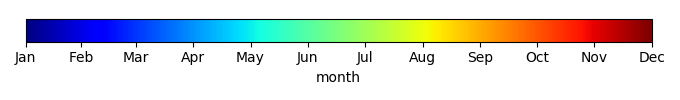
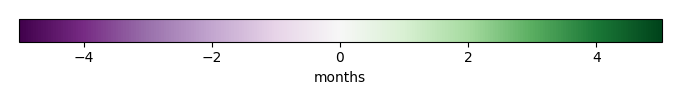
Phase Shift [months] |
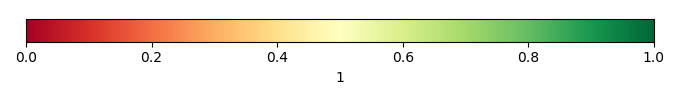
Bias Score [1] |
RMSE Score [1] |
Seasonal Cycle Score [1] |
Spatial Distribution Score [1] |
Interannual Variability Score [1] |
Overall Score [1] |
|||
|---|---|---|---|---|---|---|---|---|---|---|---|---|---|---|---|---|---|
| Benchmark | [-] | 38.3 | |||||||||||||||
| Calib | [-] | 34.0 | 33.7 | 39.6 | 15.5 | -5.22 | 11.4 | 1.61 | 0.303 | 0.378 | 0.742 | 0.966 | 0.499 | 0.544 | |||
| Control | [-] | 33.8 | 33.5 | 39.6 | 15.5 | -5.45 | 11.5 | 1.60 | 0.299 | 0.375 | 0.744 | 0.971 | 0.507 | 0.545 |
Download Data |
Period Mean (original grids) [Watt m-2] |
Model Period Mean (intersection) [Watt m-2] |
Model Period Mean (complement) [Watt m-2] |
Benchmark Period Mean (intersection) [Watt m-2] |
Benchmark Period Mean (complement) [Watt m-2] |
Bias [Watt m-2] |
RMSE [Watt m-2] |
Phase Shift [months] |
Bias Score [1] |
RMSE Score [1] |
Seasonal Cycle Score [1] |
Spatial Distribution Score [1] |
Interannual Variability Score [1] |
Overall Score [1] |
|||
|---|---|---|---|---|---|---|---|---|---|---|---|---|---|---|---|---|---|
| Benchmark | [-] | 52.3 | |||||||||||||||
| Calib | [-] | 45.9 | 46.4 | 52.8 | 14.1 | -6.51 | 13.5 | 1.36 | 0.406 | 0.385 | 0.827 | 0.989 | 0.491 | 0.580 | |||
| Control | [-] | 45.6 | 46.1 | 52.8 | 14.1 | -6.83 | 13.7 | 1.37 | 0.397 | 0.381 | 0.825 | 0.990 | 0.494 | 0.578 |
Download Data |
Period Mean (original grids) [Watt m-2] |
Model Period Mean (intersection) [Watt m-2] |
Model Period Mean (complement) [Watt m-2] |
Benchmark Period Mean (intersection) [Watt m-2] |
Benchmark Period Mean (complement) [Watt m-2] |
Bias [Watt m-2] |
RMSE [Watt m-2] |
Phase Shift [months] |
Bias Score [1] |
RMSE Score [1] |
Seasonal Cycle Score [1] |
Spatial Distribution Score [1] |
Interannual Variability Score [1] |
Overall Score [1] |
|||
|---|---|---|---|---|---|---|---|---|---|---|---|---|---|---|---|---|---|
| Benchmark | [-] | 39.3 | |||||||||||||||
| Calib | [-] | 36.4 | 36.4 | 40.4 | 16.6 | -4.00 | 11.9 | 1.89 | 0.380 | 0.396 | 0.709 | 0.923 | 0.525 | 0.555 | |||
| Control | [-] | 36.1 | 36.1 | 40.4 | 16.6 | -4.32 | 12.1 | 1.89 | 0.368 | 0.397 | 0.709 | 0.917 | 0.530 | 0.553 |
Download Data |
Period Mean (original grids) [Watt m-2] |
Model Period Mean (intersection) [Watt m-2] |
Model Period Mean (complement) [Watt m-2] |
Benchmark Period Mean (intersection) [Watt m-2] |
Benchmark Period Mean (complement) [Watt m-2] |
Bias [Watt m-2] |
RMSE [Watt m-2] |
Phase Shift [months] |
Bias Score [1] |
RMSE Score [1] |
Seasonal Cycle Score [1] |
Spatial Distribution Score [1] |
Interannual Variability Score [1] |
Overall Score [1] |
|||
|---|---|---|---|---|---|---|---|---|---|---|---|---|---|---|---|---|---|
| Benchmark | [-] | 31.6 | |||||||||||||||
| Calib | [-] | 37.4 | 37.3 | 31.5 | 32.6 | 6.16 | 19.9 | 0.284 | 0.768 | 0.555 | 0.980 | 0.851 | 0.800 | 0.752 | |||
| Control | [-] | 37.5 | 37.5 | 31.5 | 32.6 | 6.36 | 20.0 | 0.275 | 0.765 | 0.555 | 0.981 | 0.857 | 0.797 | 0.752 |
Download Data |
Period Mean (original grids) [Watt m-2] |
Model Period Mean (intersection) [Watt m-2] |
Model Period Mean (complement) [Watt m-2] |
Benchmark Period Mean (intersection) [Watt m-2] |
Benchmark Period Mean (complement) [Watt m-2] |
Bias [Watt m-2] |
RMSE [Watt m-2] |
Phase Shift [months] |
Bias Score [1] |
RMSE Score [1] |
Seasonal Cycle Score [1] |
Spatial Distribution Score [1] |
Interannual Variability Score [1] |
Overall Score [1] |
|||
|---|---|---|---|---|---|---|---|---|---|---|---|---|---|---|---|---|---|
| Benchmark | [-] | 23.5 | |||||||||||||||
| Calib | [-] | 26.9 | 26.9 | 25.9 | 15.5 | 1.67 | 11.1 | 1.53 | 0.337 | 0.366 | 0.775 | 0.221 | 0.541 | 0.434 | |||
| Control | [-] | 26.9 | 26.9 | 25.9 | 15.5 | 1.66 | 11.1 | 1.53 | 0.337 | 0.366 | 0.775 | 0.217 | 0.540 | 0.433 |
Download Data |
Period Mean (original grids) [Watt m-2] |
Model Period Mean (intersection) [Watt m-2] |
Model Period Mean (complement) [Watt m-2] |
Benchmark Period Mean (intersection) [Watt m-2] |
Benchmark Period Mean (complement) [Watt m-2] |
Bias [Watt m-2] |
RMSE [Watt m-2] |
Phase Shift [months] |
Bias Score [1] |
RMSE Score [1] |
Seasonal Cycle Score [1] |
Spatial Distribution Score [1] |
Interannual Variability Score [1] |
Overall Score [1] |
|||
|---|---|---|---|---|---|---|---|---|---|---|---|---|---|---|---|---|---|
| Benchmark | [-] | 21.4 | |||||||||||||||
| Calib | [-] | 23.7 | 23.5 | 21.5 | 17.6 | 2.05 | 10.3 | 0.750 | 0.790 | 0.516 | 0.911 | 0.903 | 0.710 | 0.725 | |||
| Control | [-] | 24.1 | 23.9 | 21.5 | 17.6 | 2.46 | 10.4 | 0.698 | 0.785 | 0.513 | 0.917 | 0.906 | 0.711 | 0.724 |
Download Data |
Period Mean (original grids) [Watt m-2] |
Model Period Mean (intersection) [Watt m-2] |
Model Period Mean (complement) [Watt m-2] |
Benchmark Period Mean (intersection) [Watt m-2] |
Benchmark Period Mean (complement) [Watt m-2] |
Bias [Watt m-2] |
RMSE [Watt m-2] |
Phase Shift [months] |
Bias Score [1] |
RMSE Score [1] |
Seasonal Cycle Score [1] |
Spatial Distribution Score [1] |
Interannual Variability Score [1] |
Overall Score [1] |
|||
|---|---|---|---|---|---|---|---|---|---|---|---|---|---|---|---|---|---|
| Benchmark | [-] | 30.0 | |||||||||||||||
| Calib | [-] | 35.5 | 35.4 | 30.5 | 14.9 | 4.27 | 11.5 | 0.953 | 0.660 | 0.475 | 0.872 | 0.950 | 0.675 | 0.684 | |||
| Control | [-] | 35.2 | 35.1 | 30.5 | 14.9 | 3.96 | 11.5 | 0.990 | 0.670 | 0.470 | 0.865 | 0.960 | 0.675 | 0.685 |
Download Data |
Period Mean (original grids) [Watt m-2] |
Model Period Mean (intersection) [Watt m-2] |
Model Period Mean (complement) [Watt m-2] |
Benchmark Period Mean (intersection) [Watt m-2] |
Benchmark Period Mean (complement) [Watt m-2] |
Bias [Watt m-2] |
RMSE [Watt m-2] |
Phase Shift [months] |
Bias Score [1] |
RMSE Score [1] |
Seasonal Cycle Score [1] |
Spatial Distribution Score [1] |
Interannual Variability Score [1] |
Overall Score [1] |
|||
|---|---|---|---|---|---|---|---|---|---|---|---|---|---|---|---|---|---|
| Benchmark | [-] | 29.5 | |||||||||||||||
| Calib | [-] | 32.5 | 32.4 | 30.6 | 14.2 | 1.33 | 11.7 | 1.04 | 0.568 | 0.396 | 0.882 | 0.979 | 0.495 | 0.619 | |||
| Control | [-] | 32.4 | 32.3 | 30.6 | 14.2 | 1.26 | 11.6 | 1.05 | 0.567 | 0.395 | 0.881 | 0.979 | 0.496 | 0.619 |
Download Data |
Period Mean (original grids) [Watt m-2] |
Model Period Mean (intersection) [Watt m-2] |
Model Period Mean (complement) [Watt m-2] |
Benchmark Period Mean (intersection) [Watt m-2] |
Benchmark Period Mean (complement) [Watt m-2] |
Bias [Watt m-2] |
RMSE [Watt m-2] |
Phase Shift [months] |
Bias Score [1] |
RMSE Score [1] |
Seasonal Cycle Score [1] |
Spatial Distribution Score [1] |
Interannual Variability Score [1] |
Overall Score [1] |
|||
|---|---|---|---|---|---|---|---|---|---|---|---|---|---|---|---|---|---|
| Benchmark | [-] | 33.0 | |||||||||||||||
| Calib | [-] | 35.0 | 34.8 | 32.8 | 37.1 | 2.35 | 17.9 | 0.300 | 0.844 | 0.593 | 0.980 | 0.796 | 0.756 | 0.760 | |||
| Control | [-] | 35.2 | 35.1 | 32.8 | 37.1 | 2.59 | 18.1 | 0.297 | 0.841 | 0.592 | 0.980 | 0.798 | 0.753 | 0.759 |
Download Data |
Period Mean (original grids) [Watt m-2] |
Model Period Mean (intersection) [Watt m-2] |
Model Period Mean (complement) [Watt m-2] |
Benchmark Period Mean (intersection) [Watt m-2] |
Benchmark Period Mean (complement) [Watt m-2] |
Bias [Watt m-2] |
RMSE [Watt m-2] |
Phase Shift [months] |
Bias Score [1] |
RMSE Score [1] |
Seasonal Cycle Score [1] |
Spatial Distribution Score [1] |
Interannual Variability Score [1] |
Overall Score [1] |
|||
|---|---|---|---|---|---|---|---|---|---|---|---|---|---|---|---|---|---|
| Benchmark | [-] | 35.1 | |||||||||||||||
| Calib | [-] | 42.2 | 42.2 | 36.7 | 14.1 | 4.12 | 10.6 | 0.429 | 0.593 | 0.545 | 0.964 | 0.963 | 0.616 | 0.704 | |||
| Control | [-] | 41.5 | 41.5 | 36.7 | 14.1 | 3.48 | 10.5 | 0.451 | 0.590 | 0.542 | 0.962 | 0.958 | 0.635 | 0.705 |
Download Data |
Period Mean (original grids) [Watt m-2] |
Model Period Mean (intersection) [Watt m-2] |
Model Period Mean (complement) [Watt m-2] |
Benchmark Period Mean (intersection) [Watt m-2] |
Benchmark Period Mean (complement) [Watt m-2] |
Bias [Watt m-2] |
RMSE [Watt m-2] |
Phase Shift [months] |
Bias Score [1] |
RMSE Score [1] |
Seasonal Cycle Score [1] |
Spatial Distribution Score [1] |
Interannual Variability Score [1] |
Overall Score [1] |
|||
|---|---|---|---|---|---|---|---|---|---|---|---|---|---|---|---|---|---|
| Benchmark | [-] | 19.8 | |||||||||||||||
| Calib | [-] | 21.6 | 21.6 | 20.7 | 10.0 | 0.878 | 9.58 | 1.02 | 0.718 | 0.550 | 0.889 | 0.867 | 0.636 | 0.702 | |||
| Control | [-] | 21.7 | 21.7 | 20.7 | 10.0 | 0.930 | 9.64 | 1.08 | 0.718 | 0.547 | 0.876 | 0.857 | 0.644 | 0.698 |
Download Data |
Period Mean (original grids) [Watt m-2] |
Model Period Mean (intersection) [Watt m-2] |
Model Period Mean (complement) [Watt m-2] |
Benchmark Period Mean (intersection) [Watt m-2] |
Benchmark Period Mean (complement) [Watt m-2] |
Bias [Watt m-2] |
RMSE [Watt m-2] |
Phase Shift [months] |
Bias Score [1] |
RMSE Score [1] |
Seasonal Cycle Score [1] |
Spatial Distribution Score [1] |
Interannual Variability Score [1] |
Overall Score [1] |
|||
|---|---|---|---|---|---|---|---|---|---|---|---|---|---|---|---|---|---|
| Benchmark | [-] | 23.6 | |||||||||||||||
| Calib | [-] | 45.2 | 45.2 | 43.1 | 14.1 | 1.13 | 14.2 | 0.871 | 0.626 | 0.499 | 0.885 | 0.877 | 0.591 | 0.663 | |||
| Control | [-] | 45.1 | 45.1 | 43.1 | 14.1 | 0.990 | 14.3 | 0.882 | 0.626 | 0.497 | 0.883 | 0.877 | 0.595 | 0.663 |
Download Data |
Period Mean (original grids) [Watt m-2] |
Model Period Mean (intersection) [Watt m-2] |
Model Period Mean (complement) [Watt m-2] |
Benchmark Period Mean (intersection) [Watt m-2] |
Benchmark Period Mean (complement) [Watt m-2] |
Bias [Watt m-2] |
RMSE [Watt m-2] |
Phase Shift [months] |
Bias Score [1] |
RMSE Score [1] |
Seasonal Cycle Score [1] |
Spatial Distribution Score [1] |
Interannual Variability Score [1] |
Overall Score [1] |
|||
|---|---|---|---|---|---|---|---|---|---|---|---|---|---|---|---|---|---|
| Benchmark | [-] | 64.3 | |||||||||||||||
| Calib | [-] | 78.7 | 78.5 | 66.2 | 16.5 | 10.4 | 18.6 | 0.501 | 0.559 | 0.580 | 0.952 | 0.985 | 0.535 | 0.698 | |||
| Control | [-] | 78.3 | 78.1 | 66.2 | 16.5 | 10.0 | 18.5 | 0.516 | 0.562 | 0.577 | 0.951 | 0.985 | 0.543 | 0.699 |
Download Data |
Period Mean (original grids) [Watt m-2] |
Model Period Mean (intersection) [Watt m-2] |
Model Period Mean (complement) [Watt m-2] |
Benchmark Period Mean (intersection) [Watt m-2] |
Benchmark Period Mean (complement) [Watt m-2] |
Bias [Watt m-2] |
RMSE [Watt m-2] |
Phase Shift [months] |
Bias Score [1] |
RMSE Score [1] |
Seasonal Cycle Score [1] |
Spatial Distribution Score [1] |
Interannual Variability Score [1] |
Overall Score [1] |
|||
|---|---|---|---|---|---|---|---|---|---|---|---|---|---|---|---|---|---|
| Benchmark | [-] | 34.3 | |||||||||||||||
| Calib | [-] | 38.4 | 38.3 | 34.2 | 35.0 | 5.06 | 18.8 | 0.228 | 0.788 | 0.593 | 0.982 | 0.956 | 0.792 | 0.784 | |||
| Control | [-] | 38.6 | 38.6 | 34.2 | 35.0 | 5.32 | 19.0 | 0.213 | 0.783 | 0.591 | 0.983 | 0.956 | 0.790 | 0.782 |
Download Data |
Period Mean (original grids) [Watt m-2] |
Model Period Mean (intersection) [Watt m-2] |
Model Period Mean (complement) [Watt m-2] |
Benchmark Period Mean (intersection) [Watt m-2] |
Benchmark Period Mean (complement) [Watt m-2] |
Bias [Watt m-2] |
RMSE [Watt m-2] |
Phase Shift [months] |
Bias Score [1] |
RMSE Score [1] |
Seasonal Cycle Score [1] |
Spatial Distribution Score [1] |
Interannual Variability Score [1] |
Overall Score [1] |
|||
|---|---|---|---|---|---|---|---|---|---|---|---|---|---|---|---|---|---|
| Benchmark | [-] | 24.8 | |||||||||||||||
| Calib | [-] | 34.2 | 34.2 | 27.0 | 14.3 | 6.70 | 11.0 | 0.847 | 0.522 | 0.445 | 0.915 | 0.916 | 0.537 | 0.630 | |||
| Control | [-] | 33.7 | 33.7 | 27.0 | 14.3 | 6.32 | 10.8 | 0.857 | 0.531 | 0.443 | 0.913 | 0.893 | 0.548 | 0.629 |
Download Data |
Period Mean (original grids) [Watt m-2] |
Model Period Mean (intersection) [Watt m-2] |
Model Period Mean (complement) [Watt m-2] |
Benchmark Period Mean (intersection) [Watt m-2] |
Benchmark Period Mean (complement) [Watt m-2] |
Bias [Watt m-2] |
RMSE [Watt m-2] |
Phase Shift [months] |
Bias Score [1] |
RMSE Score [1] |
Seasonal Cycle Score [1] |
Spatial Distribution Score [1] |
Interannual Variability Score [1] |
Overall Score [1] |
|||
|---|---|---|---|---|---|---|---|---|---|---|---|---|---|---|---|---|---|
| Benchmark | [-] | 20.7 | |||||||||||||||
| Calib | [-] | 26.5 | 26.4 | 21.1 | 12.1 | 5.13 | 8.83 | 0.836 | 0.606 | 0.494 | 0.886 | 0.993 | 0.635 | 0.685 | |||
| Control | [-] | 26.7 | 26.6 | 21.1 | 12.1 | 5.28 | 9.06 | 0.922 | 0.599 | 0.487 | 0.868 | 0.987 | 0.635 | 0.677 |
Download Data |
Period Mean (original grids) [Watt m-2] |
Model Period Mean (intersection) [Watt m-2] |
Model Period Mean (complement) [Watt m-2] |
Benchmark Period Mean (intersection) [Watt m-2] |
Benchmark Period Mean (complement) [Watt m-2] |
Bias [Watt m-2] |
RMSE [Watt m-2] |
Phase Shift [months] |
Bias Score [1] |
RMSE Score [1] |
Seasonal Cycle Score [1] |
Spatial Distribution Score [1] |
Interannual Variability Score [1] |
Overall Score [1] |
|||
|---|---|---|---|---|---|---|---|---|---|---|---|---|---|---|---|---|---|
| Benchmark | [-] | 20.3 | |||||||||||||||
| Calib | [-] | 23.2 | 23.3 | 20.6 | 10.6 | 2.60 | 9.94 | 0.756 | 0.707 | 0.530 | 0.910 | 0.929 | 0.667 | 0.712 | |||
| Control | [-] | 23.6 | 23.7 | 20.6 | 10.6 | 2.98 | 9.98 | 0.764 | 0.703 | 0.531 | 0.906 | 0.933 | 0.671 | 0.712 |
Download Data |
Period Mean (original grids) [Watt m-2] |
Model Period Mean (intersection) [Watt m-2] |
Model Period Mean (complement) [Watt m-2] |
Benchmark Period Mean (intersection) [Watt m-2] |
Benchmark Period Mean (complement) [Watt m-2] |
Bias [Watt m-2] |
RMSE [Watt m-2] |
Phase Shift [months] |
Bias Score [1] |
RMSE Score [1] |
Seasonal Cycle Score [1] |
Spatial Distribution Score [1] |
Interannual Variability Score [1] |
Overall Score [1] |
|||
|---|---|---|---|---|---|---|---|---|---|---|---|---|---|---|---|---|---|
| Benchmark | [-] | 30.8 | |||||||||||||||
| Calib | [-] | 34.3 | 34.3 | 31.1 | 10.8 | 2.82 | 9.21 | 0.691 | 0.703 | 0.527 | 0.905 | 0.975 | 0.716 | 0.725 | |||
| Control | [-] | 33.6 | 33.6 | 31.1 | 10.8 | 2.12 | 8.93 | 0.740 | 0.725 | 0.528 | 0.895 | 0.988 | 0.727 | 0.732 |
Download Data |
Period Mean (original grids) [Watt m-2] |
Model Period Mean (intersection) [Watt m-2] |
Model Period Mean (complement) [Watt m-2] |
Benchmark Period Mean (intersection) [Watt m-2] |
Benchmark Period Mean (complement) [Watt m-2] |
Bias [Watt m-2] |
RMSE [Watt m-2] |
Phase Shift [months] |
Bias Score [1] |
RMSE Score [1] |
Seasonal Cycle Score [1] |
Spatial Distribution Score [1] |
Interannual Variability Score [1] |
Overall Score [1] |
|||
|---|---|---|---|---|---|---|---|---|---|---|---|---|---|---|---|---|---|
| Benchmark | [-] | 26.8 | |||||||||||||||
| Calib | [-] | 26.5 | 26.5 | 27.1 | 15.2 | -0.475 | 8.29 | 2.30 | 0.742 | 0.368 | 0.628 | 0.776 | 0.446 | 0.555 | |||
| Control | [-] | 26.5 | 26.5 | 27.1 | 15.2 | -0.505 | 8.29 | 2.30 | 0.742 | 0.368 | 0.627 | 0.761 | 0.446 | 0.552 |
Download Data |
Period Mean (original grids) [Watt m-2] |
Model Period Mean (intersection) [Watt m-2] |
Model Period Mean (complement) [Watt m-2] |
Benchmark Period Mean (intersection) [Watt m-2] |
Benchmark Period Mean (complement) [Watt m-2] |
Bias [Watt m-2] |
RMSE [Watt m-2] |
Phase Shift [months] |
Bias Score [1] |
RMSE Score [1] |
Seasonal Cycle Score [1] |
Spatial Distribution Score [1] |
Interannual Variability Score [1] |
Overall Score [1] |
|||
|---|---|---|---|---|---|---|---|---|---|---|---|---|---|---|---|---|---|
| Benchmark | [-] | 29.5 | |||||||||||||||
| Calib | [-] | 30.8 | 30.8 | 29.9 | 14.5 | 0.861 | 8.70 | 1.09 | 0.751 | 0.451 | 0.851 | 0.650 | 0.483 | 0.606 | |||
| Control | [-] | 30.6 | 30.6 | 29.9 | 14.5 | 0.634 | 8.64 | 1.09 | 0.756 | 0.452 | 0.852 | 0.646 | 0.482 | 0.607 |
Download Data |
Period Mean (original grids) [Watt m-2] |
Model Period Mean (intersection) [Watt m-2] |
Model Period Mean (complement) [Watt m-2] |
Benchmark Period Mean (intersection) [Watt m-2] |
Benchmark Period Mean (complement) [Watt m-2] |
Bias [Watt m-2] |
RMSE [Watt m-2] |
Phase Shift [months] |
Bias Score [1] |
RMSE Score [1] |
Seasonal Cycle Score [1] |
Spatial Distribution Score [1] |
Interannual Variability Score [1] |
Overall Score [1] |
|||
|---|---|---|---|---|---|---|---|---|---|---|---|---|---|---|---|---|---|
| Benchmark | [-] | 28.0 | |||||||||||||||
| Calib | [-] | 32.8 | 32.8 | 29.7 | 12.6 | 2.59 | 12.1 | 0.804 | 0.562 | 0.484 | 0.914 | 0.931 | 0.592 | 0.661 | |||
| Control | [-] | 32.2 | 32.2 | 29.7 | 12.6 | 2.04 | 12.2 | 0.828 | 0.558 | 0.484 | 0.912 | 0.925 | 0.598 | 0.660 |
Temporally integrated period mean