Mean State
Download Data |
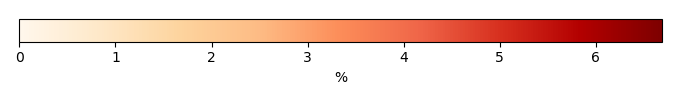
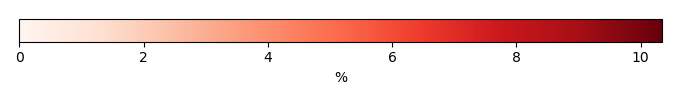
Period Mean (original grids) [%] |
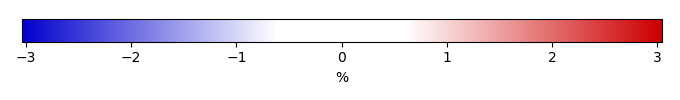
Bias [%] |
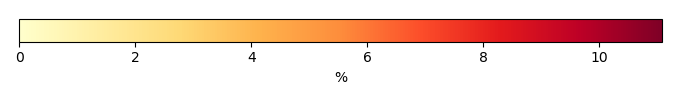
RMSE [%] |
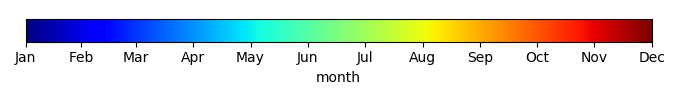
Phase Shift [months] |
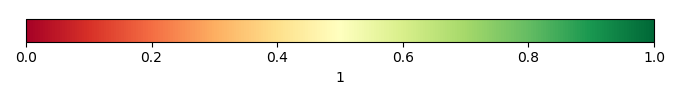
Bias Score [1] |
RMSE Score [1] |
Seasonal Cycle Score [1] |
Interannual Variability Score [1] |
Overall Score [1] |
|||
|---|---|---|---|---|---|---|---|---|---|---|---|---|
| Benchmark | [-] | 0.270 | ||||||||||
| Co2-284.7 | [-] | 0.325 | 0.0951 | 1.14 | 2.04 | 0.730 | 0.327 | 0.845 | 0.515 | 0.549 | ||
| Co2-867.2 | [-] | 0.326 | 0.0930 | 1.19 | 2.04 | 0.643 | 0.316 | 0.779 | 0.401 | 0.491 | ||
| Control | [-] | 0.356 | 0.129 | 1.17 | 2.06 | 0.698 | 0.311 | 0.827 | 0.471 | 0.524 | ||
| GSWP3-1901-1910 | [-] | 0.393 | 0.171 | 1.25 | 2.00 | 0.691 | 0.307 | 0.822 | 0.461 | 0.518 | ||
| Ndepm5 | [-] | 0.306 | 0.0728 | 1.09 | 2.03 | 0.721 | 0.322 | 0.810 | 0.492 | 0.533 | ||
| Ndepp5 | [-] | 0.611 | 0.416 | 1.44 | 2.01 | 0.607 | 0.291 | 0.850 | 0.417 | 0.491 | ||
| SSP370-2091-2100 | [-] | 0.385 | 0.161 | 1.18 | 2.11 | 0.721 | 0.331 | 0.821 | 0.520 | 0.545 |
Temporally integrated period mean