Mean State
Download Data |
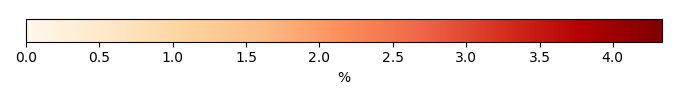
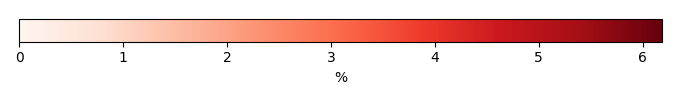
Period Mean (original grids) [%] |
Model Period Mean (intersection) [%] |
Model Period Mean (complement) [%] |
Benchmark Period Mean (intersection) [%] |
Benchmark Period Mean (complement) [%] |
Bias [%] |
RMSE [%] |
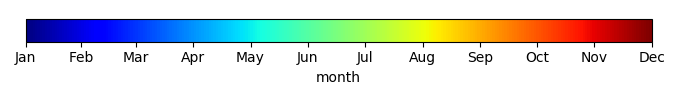
Phase Shift [months] |
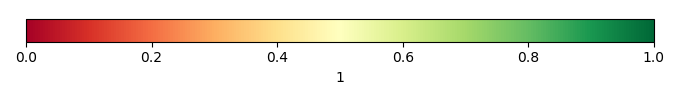
Bias Score [1] |
RMSE Score [1] |
Seasonal Cycle Score [1] |
Spatial Distribution Score [1] |
Interannual Variability Score [1] |
Overall Score [1] |
|||
|---|---|---|---|---|---|---|---|---|---|---|---|---|---|---|---|---|---|
| Benchmark | [-] | 0.432 | |||||||||||||||
| HARDCODEP2000 | [-] | 0.0786 | 0.199 | 0.204 | 0.455 | -0.0349 | 0.735 | 2.97 | 0.617 | 0.359 | 0.653 | 0.553 | 0.377 | 0.486 |
Download Data |
Period Mean (original grids) [%] |
Model Period Mean (intersection) [%] |
Model Period Mean (complement) [%] |
Benchmark Period Mean (intersection) [%] |
Benchmark Period Mean (complement) [%] |
Bias [%] |
RMSE [%] |
Phase Shift [months] |
Bias Score [1] |
RMSE Score [1] |
Seasonal Cycle Score [1] |
Spatial Distribution Score [1] |
Interannual Variability Score [1] |
Overall Score [1] |
|||
|---|---|---|---|---|---|---|---|---|---|---|---|---|---|---|---|---|---|
| Benchmark | [-] | 1.79 | |||||||||||||||
| HARDCODEP2000 | [-] | 1.23 | 1.26 | 1.46 | 1.83 | -0.259 | 3.87 | 2.18 | 0.728 | 0.324 | 0.720 | 0.709 | 0.500 | 0.551 |
Download Data |
Period Mean (original grids) [%] |
Model Period Mean (intersection) [%] |
Model Period Mean (complement) [%] |
Benchmark Period Mean (intersection) [%] |
Benchmark Period Mean (complement) [%] |
Bias [%] |
RMSE [%] |
Phase Shift [months] |
Bias Score [1] |
RMSE Score [1] |
Seasonal Cycle Score [1] |
Spatial Distribution Score [1] |
Interannual Variability Score [1] |
Overall Score [1] |
|||
|---|---|---|---|---|---|---|---|---|---|---|---|---|---|---|---|---|---|
| Benchmark | [-] | 1.57 | |||||||||||||||
| HARDCODEP2000 | [-] | 2.32 | 2.34 | 1.91 | 1.54 | 0.440 | 5.28 | 1.51 | 0.744 | 0.328 | 0.843 | 0.825 | 0.563 | 0.605 |
Download Data |
Period Mean (original grids) [%] |
Model Period Mean (intersection) [%] |
Model Period Mean (complement) [%] |
Benchmark Period Mean (intersection) [%] |
Benchmark Period Mean (complement) [%] |
Bias [%] |
RMSE [%] |
Phase Shift [months] |
Bias Score [1] |
RMSE Score [1] |
Seasonal Cycle Score [1] |
Spatial Distribution Score [1] |
Interannual Variability Score [1] |
Overall Score [1] |
|||
|---|---|---|---|---|---|---|---|---|---|---|---|---|---|---|---|---|---|
| Benchmark | [-] | 0.0250 | |||||||||||||||
| HARDCODEP2000 | [-] | 0.134 | 0.220 | 0.0641 | 0.0235 | 0.159 | 0.825 | 1.02 | 0.781 | 0.325 | 0.959 | 0.195 | 0.470 | 0.509 |
Download Data |
Period Mean (original grids) [%] |
Model Period Mean (intersection) [%] |
Model Period Mean (complement) [%] |
Benchmark Period Mean (intersection) [%] |
Benchmark Period Mean (complement) [%] |
Bias [%] |
RMSE [%] |
Phase Shift [months] |
Bias Score [1] |
RMSE Score [1] |
Seasonal Cycle Score [1] |
Spatial Distribution Score [1] |
Interannual Variability Score [1] |
Overall Score [1] |
|||
|---|---|---|---|---|---|---|---|---|---|---|---|---|---|---|---|---|---|
| Benchmark | [-] | 0.0504 | |||||||||||||||
| HARDCODEP2000 | [-] | 0.0205 | 0.0205 | 0.0313 | 0.0510 | -0.0108 | 0.118 | 1.81 | 0.732 | 0.359 | 0.658 | 0.206 | 0.368 | 0.447 |
Download Data |
Period Mean (original grids) [%] |
Model Period Mean (intersection) [%] |
Model Period Mean (complement) [%] |
Benchmark Period Mean (intersection) [%] |
Benchmark Period Mean (complement) [%] |
Bias [%] |
RMSE [%] |
Phase Shift [months] |
Bias Score [1] |
RMSE Score [1] |
Seasonal Cycle Score [1] |
Spatial Distribution Score [1] |
Interannual Variability Score [1] |
Overall Score [1] |
|||
|---|---|---|---|---|---|---|---|---|---|---|---|---|---|---|---|---|---|
| Benchmark | [-] | 0.0815 | |||||||||||||||
| HARDCODEP2000 | [-] | 0.160 | 0.154 | 0.0280 | 0.0937 | 0.0800 | 0.0593 | 0.749 | 1.78 | 0.795 | 0.316 | 0.644 | 0.676 | 0.477 | 0.537 |
Download Data |
Period Mean (original grids) [%] |
Model Period Mean (intersection) [%] |
Model Period Mean (complement) [%] |
Benchmark Period Mean (intersection) [%] |
Benchmark Period Mean (complement) [%] |
Bias [%] |
RMSE [%] |
Phase Shift [months] |
Bias Score [1] |
RMSE Score [1] |
Seasonal Cycle Score [1] |
Spatial Distribution Score [1] |
Interannual Variability Score [1] |
Overall Score [1] |
|||
|---|---|---|---|---|---|---|---|---|---|---|---|---|---|---|---|---|---|
| Benchmark | [-] | 0.127 | |||||||||||||||
| HARDCODEP2000 | [-] | 0.248 | 0.282 | 0.0606 | 0.111 | 0.129 | 0.174 | 0.781 | 2.45 | 0.744 | 0.305 | 0.767 | 0.579 | 0.511 | 0.535 |
Download Data |
Period Mean (original grids) [%] |
Model Period Mean (intersection) [%] |
Model Period Mean (complement) [%] |
Benchmark Period Mean (intersection) [%] |
Benchmark Period Mean (complement) [%] |
Bias [%] |
RMSE [%] |
Phase Shift [months] |
Bias Score [1] |
RMSE Score [1] |
Seasonal Cycle Score [1] |
Spatial Distribution Score [1] |
Interannual Variability Score [1] |
Overall Score [1] |
|||
|---|---|---|---|---|---|---|---|---|---|---|---|---|---|---|---|---|---|
| Benchmark | [-] | 0.175 | |||||||||||||||
| HARDCODEP2000 | [-] | 0.215 | 0.204 | 0.133 | 0.239 | 0.170 | -0.0282 | 0.987 | 1.42 | 0.672 | 0.361 | 0.794 | 0.347 | 0.375 | 0.485 |
Download Data |
Period Mean (original grids) [%] |
Model Period Mean (intersection) [%] |
Model Period Mean (complement) [%] |
Benchmark Period Mean (intersection) [%] |
Benchmark Period Mean (complement) [%] |
Bias [%] |
RMSE [%] |
Phase Shift [months] |
Bias Score [1] |
RMSE Score [1] |
Seasonal Cycle Score [1] |
Spatial Distribution Score [1] |
Interannual Variability Score [1] |
Overall Score [1] |
|||
|---|---|---|---|---|---|---|---|---|---|---|---|---|---|---|---|---|---|
| Benchmark | [-] | 0.00565 | |||||||||||||||
| HARDCODEP2000 | [-] | 0.00607 | 0.0360 | 0.0108 | 0.00550 | 0.0238 | 0.208 | 1.85 | 0.850 | 0.357 | 0.919 | 0.112 | 0.431 | 0.504 |
Download Data |
Period Mean (original grids) [%] |
Model Period Mean (intersection) [%] |
Model Period Mean (complement) [%] |
Benchmark Period Mean (intersection) [%] |
Benchmark Period Mean (complement) [%] |
Bias [%] |
RMSE [%] |
Phase Shift [months] |
Bias Score [1] |
RMSE Score [1] |
Seasonal Cycle Score [1] |
Spatial Distribution Score [1] |
Interannual Variability Score [1] |
Overall Score [1] |
|||
|---|---|---|---|---|---|---|---|---|---|---|---|---|---|---|---|---|---|
| Benchmark | [-] | 0.490 | |||||||||||||||
| HARDCODEP2000 | [-] | 0.480 | 0.480 | 0.490 | 0.643 | 0.477 | -0.161 | 2.48 | 1.66 | 0.783 | 0.363 | 0.841 | 0.354 | 0.410 | 0.519 |
Download Data |
Period Mean (original grids) [%] |
Model Period Mean (intersection) [%] |
Model Period Mean (complement) [%] |
Benchmark Period Mean (intersection) [%] |
Benchmark Period Mean (complement) [%] |
Bias [%] |
RMSE [%] |
Phase Shift [months] |
Bias Score [1] |
RMSE Score [1] |
Seasonal Cycle Score [1] |
Spatial Distribution Score [1] |
Interannual Variability Score [1] |
Overall Score [1] |
|||
|---|---|---|---|---|---|---|---|---|---|---|---|---|---|---|---|---|---|
| Benchmark | [-] | 0.0210 | |||||||||||||||
| HARDCODEP2000 | [-] | 0.135 | 0.140 | 0.0279 | 0.0206 | 0.112 | 0.293 | 2.38 | 0.535 | 0.224 | 0.935 | 0.173 | 0.679 | 0.461 |
Download Data |
Period Mean (original grids) [%] |
Model Period Mean (intersection) [%] |
Model Period Mean (complement) [%] |
Benchmark Period Mean (intersection) [%] |
Benchmark Period Mean (complement) [%] |
Bias [%] |
RMSE [%] |
Phase Shift [months] |
Bias Score [1] |
RMSE Score [1] |
Seasonal Cycle Score [1] |
Spatial Distribution Score [1] |
Interannual Variability Score [1] |
Overall Score [1] |
|||
|---|---|---|---|---|---|---|---|---|---|---|---|---|---|---|---|---|---|
| Benchmark | [-] | 0.325 | |||||||||||||||
| HARDCODEP2000 | [-] | 0.385 | 0.441 | 0.0130 | 0.386 | 0.320 | 0.0527 | 1.35 | 2.05 | 0.732 | 0.330 | 0.794 | 0.819 | 0.502 | 0.584 |
Download Data |
Period Mean (original grids) [%] |
Model Period Mean (intersection) [%] |
Model Period Mean (complement) [%] |
Benchmark Period Mean (intersection) [%] |
Benchmark Period Mean (complement) [%] |
Bias [%] |
RMSE [%] |
Phase Shift [months] |
Bias Score [1] |
RMSE Score [1] |
Seasonal Cycle Score [1] |
Spatial Distribution Score [1] |
Interannual Variability Score [1] |
Overall Score [1] |
|||
|---|---|---|---|---|---|---|---|---|---|---|---|---|---|---|---|---|---|
| Benchmark | [-] | 0.0198 | |||||||||||||||
| HARDCODEP2000 | [-] | 0.0171 | 0.0591 | 0.00134 | 0.0103 | 0.0206 | 0.0489 | 0.128 | 2.67 | 0.571 | 0.267 | 0.766 | 0.139 | 0.492 | 0.417 |
Download Data |
Period Mean (original grids) [%] |
Model Period Mean (intersection) [%] |
Model Period Mean (complement) [%] |
Benchmark Period Mean (intersection) [%] |
Benchmark Period Mean (complement) [%] |
Bias [%] |
RMSE [%] |
Phase Shift [months] |
Bias Score [1] |
RMSE Score [1] |
Seasonal Cycle Score [1] |
Spatial Distribution Score [1] |
Interannual Variability Score [1] |
Overall Score [1] |
|||
|---|---|---|---|---|---|---|---|---|---|---|---|---|---|---|---|---|---|
| Benchmark | [-] | 0.0157 | |||||||||||||||
| HARDCODEP2000 | [-] | 0.00396 | 0.00334 | 0.0126 | 0.0426 | 0.0153 | -0.0339 | 0.351 | 1.71 | 0.879 | 0.367 | 0.945 | 0.0161 | 0.369 | 0.491 |
Download Data |
Period Mean (original grids) [%] |
Model Period Mean (intersection) [%] |
Model Period Mean (complement) [%] |
Benchmark Period Mean (intersection) [%] |
Benchmark Period Mean (complement) [%] |
Bias [%] |
RMSE [%] |
Phase Shift [months] |
Bias Score [1] |
RMSE Score [1] |
Seasonal Cycle Score [1] |
Spatial Distribution Score [1] |
Interannual Variability Score [1] |
Overall Score [1] |
|||
|---|---|---|---|---|---|---|---|---|---|---|---|---|---|---|---|---|---|
| Benchmark | [-] | 0.0821 | |||||||||||||||
| HARDCODEP2000 | [-] | 0.00712 | 0.00721 | 0.00551 | 0.108 | 0.0805 | -0.0924 | 0.342 | 2.23 | 0.704 | 0.363 | 0.866 | 0.00115 | 0.395 | 0.449 |
Download Data |
Period Mean (original grids) [%] |
Model Period Mean (intersection) [%] |
Model Period Mean (complement) [%] |
Benchmark Period Mean (intersection) [%] |
Benchmark Period Mean (complement) [%] |
Bias [%] |
RMSE [%] |
Phase Shift [months] |
Bias Score [1] |
RMSE Score [1] |
Seasonal Cycle Score [1] |
Spatial Distribution Score [1] |
Interannual Variability Score [1] |
Overall Score [1] |
|||
|---|---|---|---|---|---|---|---|---|---|---|---|---|---|---|---|---|---|
| Benchmark | [-] | 0.0299 | |||||||||||||||
| HARDCODEP2000 | [-] | 0.0198 | 0.0198 | 0.000706 | 0.0309 | 0.0299 | -0.00966 | 0.161 | 3.50 | 0.732 | 0.301 | 0.568 | 0.656 | 0.438 | 0.499 |
Download Data |
Period Mean (original grids) [%] |
Model Period Mean (intersection) [%] |
Model Period Mean (complement) [%] |
Benchmark Period Mean (intersection) [%] |
Benchmark Period Mean (complement) [%] |
Bias [%] |
RMSE [%] |
Phase Shift [months] |
Bias Score [1] |
RMSE Score [1] |
Seasonal Cycle Score [1] |
Spatial Distribution Score [1] |
Interannual Variability Score [1] |
Overall Score [1] |
|||
|---|---|---|---|---|---|---|---|---|---|---|---|---|---|---|---|---|---|
| Benchmark | [-] | 0.0243 | |||||||||||||||
| HARDCODEP2000 | [-] | 0.0125 | 0.0119 | 0.0172 | 0.0289 | 0.0238 | -0.0191 | 0.235 | 2.68 | 0.860 | 0.348 | 0.822 | 0.111 | 0.388 | 0.480 |
Download Data |
Period Mean (original grids) [%] |
Model Period Mean (intersection) [%] |
Model Period Mean (complement) [%] |
Benchmark Period Mean (intersection) [%] |
Benchmark Period Mean (complement) [%] |
Bias [%] |
RMSE [%] |
Phase Shift [months] |
Bias Score [1] |
RMSE Score [1] |
Seasonal Cycle Score [1] |
Spatial Distribution Score [1] |
Interannual Variability Score [1] |
Overall Score [1] |
|||
|---|---|---|---|---|---|---|---|---|---|---|---|---|---|---|---|---|---|
| Benchmark | [-] | 0.0273 | |||||||||||||||
| HARDCODEP2000 | [-] | 0.198 | 0.196 | 0.000378 | 0.0208 | 0.0279 | 0.178 | 0.462 | 1.68 | 0.588 | 0.246 | 0.901 | 0.106 | 0.497 | 0.431 |
Download Data |
Period Mean (original grids) [%] |
Model Period Mean (intersection) [%] |
Model Period Mean (complement) [%] |
Benchmark Period Mean (intersection) [%] |
Benchmark Period Mean (complement) [%] |
Bias [%] |
RMSE [%] |
Phase Shift [months] |
Bias Score [1] |
RMSE Score [1] |
Seasonal Cycle Score [1] |
Spatial Distribution Score [1] |
Interannual Variability Score [1] |
Overall Score [1] |
|||
|---|---|---|---|---|---|---|---|---|---|---|---|---|---|---|---|---|---|
| Benchmark | [-] | 0.139 | |||||||||||||||
| HARDCODEP2000 | [-] | 0.0126 | 0.00911 | 0.168 | 0.135 | -0.158 | 0.432 | 1.62 | 0.653 | 0.375 | 0.841 | 0.0173 | 0.393 | 0.442 |
Download Data |
Period Mean (original grids) [%] |
Model Period Mean (intersection) [%] |
Model Period Mean (complement) [%] |
Benchmark Period Mean (intersection) [%] |
Benchmark Period Mean (complement) [%] |
Bias [%] |
RMSE [%] |
Phase Shift [months] |
Bias Score [1] |
RMSE Score [1] |
Seasonal Cycle Score [1] |
Spatial Distribution Score [1] |
Interannual Variability Score [1] |
Overall Score [1] |
|||
|---|---|---|---|---|---|---|---|---|---|---|---|---|---|---|---|---|---|
| Benchmark | [-] | 0.236 | |||||||||||||||
| HARDCODEP2000 | [-] | 0.585 | 0.577 | 0.283 | 0.232 | 0.298 | 1.51 | 1.49 | 0.623 | 0.261 | 0.795 | 0.521 | 0.489 | 0.492 |
Download Data |
Period Mean (original grids) [%] |
Model Period Mean (intersection) [%] |
Model Period Mean (complement) [%] |
Benchmark Period Mean (intersection) [%] |
Benchmark Period Mean (complement) [%] |
Bias [%] |
RMSE [%] |
Phase Shift [months] |
Bias Score [1] |
RMSE Score [1] |
Seasonal Cycle Score [1] |
Spatial Distribution Score [1] |
Interannual Variability Score [1] |
Overall Score [1] |
|||
|---|---|---|---|---|---|---|---|---|---|---|---|---|---|---|---|---|---|
| Benchmark | [-] | 0.0314 | |||||||||||||||
| HARDCODEP2000 | [-] | 0.0435 | 0.0524 | 0.000690 | 0.0417 | 0.0304 | 0.00427 | 0.242 | 1.91 | 0.798 | 0.351 | 0.853 | 0.467 | 0.391 | 0.535 |
Temporally integrated period mean