Mean State
Download Data |
Period Mean (original grids) [1] |
Model Period Mean (intersection) [1] |
Model Period Mean (complement) [1] |
Benchmark Period Mean (intersection) [1] |
Benchmark Period Mean (complement) [1] |
Bias [1] |
RMSE [1] |
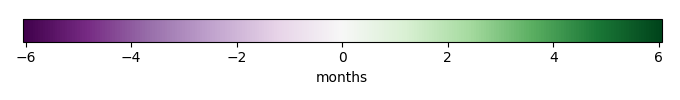
Phase Shift [months] |
Bias Score [1] |
RMSE Score [1] |
Seasonal Cycle Score [1] |
Spatial Distribution Score [1] |
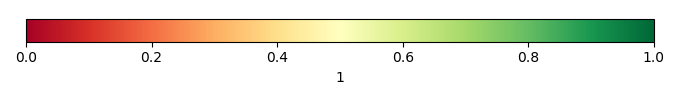
Overall Score [1] |
|||
|---|---|---|---|---|---|---|---|---|---|---|---|---|---|---|---|---|
| Benchmark | [-] | 2.83 | ||||||||||||||
| HARDCODEP2000 | [-] | 3.61 | 3.46 | 3.36 | 2.78 | 0.125 | 0.967 | 3.00 | 0.204 | 0.164 | 0.531 | 0.982 | 0.409 |
Download Data |
Period Mean (original grids) [1] |
Model Period Mean (intersection) [1] |
Model Period Mean (complement) [1] |
Benchmark Period Mean (intersection) [1] |
Benchmark Period Mean (complement) [1] |
Bias [1] |
RMSE [1] |
Phase Shift [months] |
Bias Score [1] |
RMSE Score [1] |
Seasonal Cycle Score [1] |
Spatial Distribution Score [1] |
Overall Score [1] |
|||
|---|---|---|---|---|---|---|---|---|---|---|---|---|---|---|---|---|
| Benchmark | [-] | 1.03 | ||||||||||||||
| HARDCODEP2000 | [-] | 1.28 | 1.18 | 0.484 | 1.19 | 1.01 | -0.0117 | 1.28 | 1.99 | 0.278 | 0.339 | 0.589 | 0.687 | 0.446 |
Download Data |
Period Mean (original grids) [1] |
Model Period Mean (intersection) [1] |
Model Period Mean (complement) [1] |
Benchmark Period Mean (intersection) [1] |
Benchmark Period Mean (complement) [1] |
Bias [1] |
RMSE [1] |
Phase Shift [months] |
Bias Score [1] |
RMSE Score [1] |
Seasonal Cycle Score [1] |
Spatial Distribution Score [1] |
Overall Score [1] |
|||
|---|---|---|---|---|---|---|---|---|---|---|---|---|---|---|---|---|
| Benchmark | [-] | 1.40 | ||||||||||||||
| HARDCODEP2000 | [-] | 0.812 | 0.807 | 2.58 | 1.44 | 1.40 | -0.635 | 0.957 | 1.98 | 0.249 | 0.360 | 0.651 | 0.903 | 0.504 |
Download Data |
Period Mean (original grids) [1] |
Model Period Mean (intersection) [1] |
Model Period Mean (complement) [1] |
Benchmark Period Mean (intersection) [1] |
Benchmark Period Mean (complement) [1] |
Bias [1] |
RMSE [1] |
Phase Shift [months] |
Bias Score [1] |
RMSE Score [1] |
Seasonal Cycle Score [1] |
Spatial Distribution Score [1] |
Overall Score [1] |
|||
|---|---|---|---|---|---|---|---|---|---|---|---|---|---|---|---|---|
| Benchmark | [-] | 0.602 | ||||||||||||||
| HARDCODEP2000 | [-] | 1.92 | 1.82 | 0.635 | 0.601 | 1.18 | 2.12 | 0.319 | 0.364 | 0.230 | 0.976 | 0.115 | 0.383 |
Download Data |
Period Mean (original grids) [1] |
Model Period Mean (intersection) [1] |
Model Period Mean (complement) [1] |
Benchmark Period Mean (intersection) [1] |
Benchmark Period Mean (complement) [1] |
Bias [1] |
RMSE [1] |
Phase Shift [months] |
Bias Score [1] |
RMSE Score [1] |
Seasonal Cycle Score [1] |
Spatial Distribution Score [1] |
Overall Score [1] |
|||
|---|---|---|---|---|---|---|---|---|---|---|---|---|---|---|---|---|
| Benchmark | [-] | 4.00 | ||||||||||||||
| HARDCODEP2000 | [-] | 4.79 | 4.79 | 4.06 | 4.00 | 0.727 | 0.825 | 4.58 | 0.153 | 0.329 | 0.226 | 0.305 | 0.269 |
Download Data |
Period Mean (original grids) [1] |
Model Period Mean (intersection) [1] |
Model Period Mean (complement) [1] |
Benchmark Period Mean (intersection) [1] |
Benchmark Period Mean (complement) [1] |
Bias [1] |
RMSE [1] |
Phase Shift [months] |
Bias Score [1] |
RMSE Score [1] |
Seasonal Cycle Score [1] |
Spatial Distribution Score [1] |
Overall Score [1] |
|||
|---|---|---|---|---|---|---|---|---|---|---|---|---|---|---|---|---|
| Benchmark | [-] | 2.00 | ||||||||||||||
| HARDCODEP2000 | [-] | 2.37 | 2.40 | 2.87 | 2.02 | 2.00 | 0.361 | 1.11 | 1.50 | 0.419 | 0.360 | 0.765 | 0.825 | 0.546 |
Download Data |
Period Mean (original grids) [1] |
Model Period Mean (intersection) [1] |
Model Period Mean (complement) [1] |
Benchmark Period Mean (intersection) [1] |
Benchmark Period Mean (complement) [1] |
Bias [1] |
RMSE [1] |
Phase Shift [months] |
Bias Score [1] |
RMSE Score [1] |
Seasonal Cycle Score [1] |
Spatial Distribution Score [1] |
Overall Score [1] |
|||
|---|---|---|---|---|---|---|---|---|---|---|---|---|---|---|---|---|
| Benchmark | [-] | 0.758 | ||||||||||||||
| HARDCODEP2000 | [-] | 0.990 | 1.07 | 0.356 | 0.645 | 0.770 | 0.419 | 0.831 | 1.94 | 0.366 | 0.341 | 0.752 | 0.789 | 0.518 |
Download Data |
Period Mean (original grids) [1] |
Model Period Mean (intersection) [1] |
Model Period Mean (complement) [1] |
Benchmark Period Mean (intersection) [1] |
Benchmark Period Mean (complement) [1] |
Bias [1] |
RMSE [1] |
Phase Shift [months] |
Bias Score [1] |
RMSE Score [1] |
Seasonal Cycle Score [1] |
Spatial Distribution Score [1] |
Overall Score [1] |
|||
|---|---|---|---|---|---|---|---|---|---|---|---|---|---|---|---|---|
| Benchmark | [-] | 1.71 | ||||||||||||||
| HARDCODEP2000 | [-] | 1.70 | 1.64 | 1.48 | 1.74 | 0.156 | 0.978 | 2.31 | 0.176 | 0.270 | 0.585 | 0.880 | 0.436 |
Download Data |
Period Mean (original grids) [1] |
Model Period Mean (intersection) [1] |
Model Period Mean (complement) [1] |
Benchmark Period Mean (intersection) [1] |
Benchmark Period Mean (complement) [1] |
Bias [1] |
RMSE [1] |
Phase Shift [months] |
Bias Score [1] |
RMSE Score [1] |
Seasonal Cycle Score [1] |
Spatial Distribution Score [1] |
Overall Score [1] |
|||
|---|---|---|---|---|---|---|---|---|---|---|---|---|---|---|---|---|
| Benchmark | [-] | 0.648 | ||||||||||||||
| HARDCODEP2000 | [-] | 2.56 | 2.59 | 1.03 | 0.637 | 1.57 | 2.07 | 1.52 | 0.192 | 0.296 | 0.803 | 0.733 | 0.464 |
Download Data |
Period Mean (original grids) [1] |
Model Period Mean (intersection) [1] |
Model Period Mean (complement) [1] |
Benchmark Period Mean (intersection) [1] |
Benchmark Period Mean (complement) [1] |
Bias [1] |
RMSE [1] |
Phase Shift [months] |
Bias Score [1] |
RMSE Score [1] |
Seasonal Cycle Score [1] |
Spatial Distribution Score [1] |
Overall Score [1] |
|||
|---|---|---|---|---|---|---|---|---|---|---|---|---|---|---|---|---|
| Benchmark | [-] | 0.762 | ||||||||||||||
| HARDCODEP2000 | [-] | 0.598 | 0.595 | 1.11 | 0.545 | 0.782 | 0.0491 | 0.421 | 2.39 | 0.314 | 0.122 | 0.547 | 0.960 | 0.413 |
Download Data |
Period Mean (original grids) [1] |
Model Period Mean (intersection) [1] |
Model Period Mean (complement) [1] |
Benchmark Period Mean (intersection) [1] |
Benchmark Period Mean (complement) [1] |
Bias [1] |
RMSE [1] |
Phase Shift [months] |
Bias Score [1] |
RMSE Score [1] |
Seasonal Cycle Score [1] |
Spatial Distribution Score [1] |
Overall Score [1] |
|||
|---|---|---|---|---|---|---|---|---|---|---|---|---|---|---|---|---|
| Benchmark | [-] | 1.52 | ||||||||||||||
| HARDCODEP2000 | [-] | 2.85 | 2.83 | 1.78 | 1.50 | 1.05 | 1.46 | 3.11 | 0.260 | 0.255 | 0.531 | 0.953 | 0.451 |
Download Data |
Period Mean (original grids) [1] |
Model Period Mean (intersection) [1] |
Model Period Mean (complement) [1] |
Benchmark Period Mean (intersection) [1] |
Benchmark Period Mean (complement) [1] |
Bias [1] |
RMSE [1] |
Phase Shift [months] |
Bias Score [1] |
RMSE Score [1] |
Seasonal Cycle Score [1] |
Spatial Distribution Score [1] |
Overall Score [1] |
|||
|---|---|---|---|---|---|---|---|---|---|---|---|---|---|---|---|---|
| Benchmark | [-] | 1.36 | ||||||||||||||
| HARDCODEP2000 | [-] | 1.71 | 1.72 | 0.845 | 1.42 | 1.35 | 0.304 | 0.910 | 2.12 | 0.281 | 0.292 | 0.633 | 0.915 | 0.482 |
Download Data |
Period Mean (original grids) [1] |
Model Period Mean (intersection) [1] |
Model Period Mean (complement) [1] |
Benchmark Period Mean (intersection) [1] |
Benchmark Period Mean (complement) [1] |
Bias [1] |
RMSE [1] |
Phase Shift [months] |
Bias Score [1] |
RMSE Score [1] |
Seasonal Cycle Score [1] |
Spatial Distribution Score [1] |
Overall Score [1] |
|||
|---|---|---|---|---|---|---|---|---|---|---|---|---|---|---|---|---|
| Benchmark | [-] | 0.0908 | ||||||||||||||
| HARDCODEP2000 | [-] | 0.162 | 0.162 | 0.151 | 0.0424 | 0.0961 | 0.116 | 0.210 | 1.95 | 0.0901 | 0.0689 | 0.780 | 0.303 | 0.262 |
Download Data |
Period Mean (original grids) [1] |
Model Period Mean (intersection) [1] |
Model Period Mean (complement) [1] |
Benchmark Period Mean (intersection) [1] |
Benchmark Period Mean (complement) [1] |
Bias [1] |
RMSE [1] |
Phase Shift [months] |
Bias Score [1] |
RMSE Score [1] |
Seasonal Cycle Score [1] |
Spatial Distribution Score [1] |
Overall Score [1] |
|||
|---|---|---|---|---|---|---|---|---|---|---|---|---|---|---|---|---|
| Benchmark | [-] | 0.650 | ||||||||||||||
| HARDCODEP2000 | [-] | 2.57 | 2.51 | 2.82 | 1.56 | 0.637 | 0.957 | 1.60 | 2.04 | 0.285 | 0.127 | 0.746 | 0.521 | 0.361 |
Download Data |
Period Mean (original grids) [1] |
Model Period Mean (intersection) [1] |
Model Period Mean (complement) [1] |
Benchmark Period Mean (intersection) [1] |
Benchmark Period Mean (complement) [1] |
Bias [1] |
RMSE [1] |
Phase Shift [months] |
Bias Score [1] |
RMSE Score [1] |
Seasonal Cycle Score [1] |
Spatial Distribution Score [1] |
Overall Score [1] |
|||
|---|---|---|---|---|---|---|---|---|---|---|---|---|---|---|---|---|
| Benchmark | [-] | 2.08 | ||||||||||||||
| HARDCODEP2000 | [-] | 1.41 | 1.56 | 0.395 | 2.04 | 2.09 | -0.443 | 0.922 | 1.48 | 0.116 | 0.344 | 0.892 | 0.821 | 0.503 |
Download Data |
Period Mean (original grids) [1] |
Model Period Mean (intersection) [1] |
Model Period Mean (complement) [1] |
Benchmark Period Mean (intersection) [1] |
Benchmark Period Mean (complement) [1] |
Bias [1] |
RMSE [1] |
Phase Shift [months] |
Bias Score [1] |
RMSE Score [1] |
Seasonal Cycle Score [1] |
Spatial Distribution Score [1] |
Overall Score [1] |
|||
|---|---|---|---|---|---|---|---|---|---|---|---|---|---|---|---|---|
| Benchmark | [-] | 1.99 | ||||||||||||||
| HARDCODEP2000 | [-] | 2.14 | 2.18 | 1.87 | 1.57 | 2.03 | 0.594 | 1.26 | 1.91 | 0.454 | 0.408 | 0.762 | 0.955 | 0.597 |
Download Data |
Period Mean (original grids) [1] |
Model Period Mean (intersection) [1] |
Model Period Mean (complement) [1] |
Benchmark Period Mean (intersection) [1] |
Benchmark Period Mean (complement) [1] |
Bias [1] |
RMSE [1] |
Phase Shift [months] |
Bias Score [1] |
RMSE Score [1] |
Seasonal Cycle Score [1] |
Spatial Distribution Score [1] |
Overall Score [1] |
|||
|---|---|---|---|---|---|---|---|---|---|---|---|---|---|---|---|---|
| Benchmark | [-] | 2.03 | ||||||||||||||
| HARDCODEP2000 | [-] | 2.82 | 2.83 | 1.87 | 1.92 | 2.04 | 0.915 | 1.33 | 1.75 | 0.318 | 0.336 | 0.743 | 0.832 | 0.513 |
Download Data |
Period Mean (original grids) [1] |
Model Period Mean (intersection) [1] |
Model Period Mean (complement) [1] |
Benchmark Period Mean (intersection) [1] |
Benchmark Period Mean (complement) [1] |
Bias [1] |
RMSE [1] |
Phase Shift [months] |
Bias Score [1] |
RMSE Score [1] |
Seasonal Cycle Score [1] |
Spatial Distribution Score [1] |
Overall Score [1] |
|||
|---|---|---|---|---|---|---|---|---|---|---|---|---|---|---|---|---|
| Benchmark | [-] | 0.769 | ||||||||||||||
| HARDCODEP2000 | [-] | 0.513 | 0.516 | 0.668 | 0.779 | -0.158 | 0.639 | 2.24 | 0.173 | 0.274 | 0.633 | 0.589 | 0.388 |
Download Data |
Period Mean (original grids) [1] |
Model Period Mean (intersection) [1] |
Model Period Mean (complement) [1] |
Benchmark Period Mean (intersection) [1] |
Benchmark Period Mean (complement) [1] |
Bias [1] |
RMSE [1] |
Phase Shift [months] |
Bias Score [1] |
RMSE Score [1] |
Seasonal Cycle Score [1] |
Spatial Distribution Score [1] |
Overall Score [1] |
|||
|---|---|---|---|---|---|---|---|---|---|---|---|---|---|---|---|---|
| Benchmark | [-] | 3.88 | ||||||||||||||
| HARDCODEP2000 | [-] | 4.53 | 4.57 | 4.10 | 3.85 | 0.477 | 0.807 | 2.64 | 0.270 | 0.291 | 0.572 | 0.837 | 0.452 |
Download Data |
Period Mean (original grids) [1] |
Model Period Mean (intersection) [1] |
Model Period Mean (complement) [1] |
Benchmark Period Mean (intersection) [1] |
Benchmark Period Mean (complement) [1] |
Bias [1] |
RMSE [1] |
Phase Shift [months] |
Bias Score [1] |
RMSE Score [1] |
Seasonal Cycle Score [1] |
Spatial Distribution Score [1] |
Overall Score [1] |
|||
|---|---|---|---|---|---|---|---|---|---|---|---|---|---|---|---|---|
| Benchmark | [-] | 1.92 | ||||||||||||||
| HARDCODEP2000 | [-] | 3.02 | 3.04 | 2.08 | 1.90 | 0.957 | 1.60 | 2.51 | 0.243 | 0.184 | 0.598 | 0.604 | 0.363 |
Download Data |
Period Mean (original grids) [1] |
Model Period Mean (intersection) [1] |
Model Period Mean (complement) [1] |
Benchmark Period Mean (intersection) [1] |
Benchmark Period Mean (complement) [1] |
Bias [1] |
RMSE [1] |
Phase Shift [months] |
Bias Score [1] |
RMSE Score [1] |
Seasonal Cycle Score [1] |
Spatial Distribution Score [1] |
Overall Score [1] |
|||
|---|---|---|---|---|---|---|---|---|---|---|---|---|---|---|---|---|
| Benchmark | [-] | 0.692 | ||||||||||||||
| HARDCODEP2000 | [-] | 2.15 | 1.60 | 0.698 | 0.692 | 0.947 | 1.08 | 2.54 | 0.0655 | 0.214 | 0.530 | 0.579 | 0.321 |
Temporally integrated period mean