Mean State
Download Data |
Period Mean (original grids) [mm d-1] |
Bias [mm d-1] |
RMSE [mm d-1] |
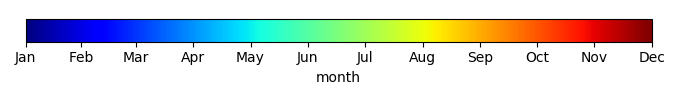
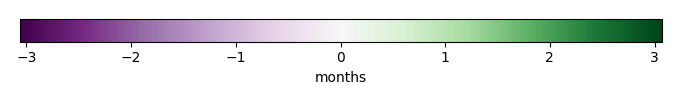
Phase Shift [months] |
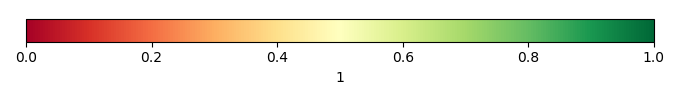
Bias Score [1] |
RMSE Score [1] |
Seasonal Cycle Score [1] |
Interannual Variability Score [1] |
Overall Score [1] |
|||
|---|---|---|---|---|---|---|---|---|---|---|---|---|
| Benchmark | [-] | 0.000892 | ||||||||||
| HARDCODEP2000 | [-] | nan | nan | nan | nan | nan | nan | nan | nan | nan |
Download Data |
Period Mean (original grids) [mm d-1] |
Bias [mm d-1] |
RMSE [mm d-1] |
Phase Shift [months] |
Bias Score [1] |
RMSE Score [1] |
Seasonal Cycle Score [1] |
Interannual Variability Score [1] |
Overall Score [1] |
|||
|---|---|---|---|---|---|---|---|---|---|---|---|---|
| Benchmark | [-] | 0.000513 | ||||||||||
| HARDCODEP2000 | [-] | nan | nan | nan | nan | nan | nan | nan | nan | nan |
Download Data |
Period Mean (original grids) [mm d-1] |
Bias [mm d-1] |
RMSE [mm d-1] |
Phase Shift [months] |
Bias Score [1] |
RMSE Score [1] |
Seasonal Cycle Score [1] |
Interannual Variability Score [1] |
Overall Score [1] |
|||
|---|---|---|---|---|---|---|---|---|---|---|---|---|
| Benchmark | [-] | 0.00569 | ||||||||||
| HARDCODEP2000 | [-] | nan | nan | nan | nan | nan | nan | nan | nan | nan |
Download Data |
Period Mean (original grids) [mm d-1] |
Bias [mm d-1] |
RMSE [mm d-1] |
Phase Shift [months] |
Bias Score [1] |
RMSE Score [1] |
Seasonal Cycle Score [1] |
Interannual Variability Score [1] |
Overall Score [1] |
|||
|---|---|---|---|---|---|---|---|---|---|---|---|---|
| Benchmark | [-] | 0.00102 | ||||||||||
| HARDCODEP2000 | [-] | nan | nan | nan | nan | nan | nan | nan | nan | nan |
Download Data |
Period Mean (original grids) [mm d-1] |
Bias [mm d-1] |
RMSE [mm d-1] |
Phase Shift [months] |
Bias Score [1] |
RMSE Score [1] |
Seasonal Cycle Score [1] |
Interannual Variability Score [1] |
Overall Score [1] |
|||
|---|---|---|---|---|---|---|---|---|---|---|---|---|
| Benchmark | [-] | 0.00411 | ||||||||||
| HARDCODEP2000 | [-] | nan | nan | nan | nan | nan | nan | nan | nan | nan |
Download Data |
Period Mean (original grids) [mm d-1] |
Bias [mm d-1] |
RMSE [mm d-1] |
Phase Shift [months] |
Bias Score [1] |
RMSE Score [1] |
Seasonal Cycle Score [1] |
Interannual Variability Score [1] |
Overall Score [1] |
|||
|---|---|---|---|---|---|---|---|---|---|---|---|---|
| Benchmark | [-] | 0.00424 | ||||||||||
| HARDCODEP2000 | [-] | 0.00305 | 0.000531 | 0.00189 | 3.02 | 0.817 | 0.412 | 0.449 | 0.986 | 0.615 |
Download Data |
Period Mean (original grids) [mm d-1] |
Bias [mm d-1] |
RMSE [mm d-1] |
Phase Shift [months] |
Bias Score [1] |
RMSE Score [1] |
Seasonal Cycle Score [1] |
Interannual Variability Score [1] |
Overall Score [1] |
|||
|---|---|---|---|---|---|---|---|---|---|---|---|---|
| Benchmark | [-] | 0.00308 | ||||||||||
| HARDCODEP2000 | [-] | 0.00262 | 0.000427 | 0.00189 | 2.03 | 0.794 | 0.421 | 0.658 | 0.826 | 0.624 |
Download Data |
Period Mean (original grids) [mm d-1] |
Bias [mm d-1] |
RMSE [mm d-1] |
Phase Shift [months] |
Bias Score [1] |
RMSE Score [1] |
Seasonal Cycle Score [1] |
Interannual Variability Score [1] |
Overall Score [1] |
|||
|---|---|---|---|---|---|---|---|---|---|---|---|---|
| Benchmark | [-] | 0.000883 | ||||||||||
| HARDCODEP2000 | [-] | nan | nan | nan | nan | nan | nan | nan | nan | nan |
Download Data |
Period Mean (original grids) [mm d-1] |
Bias [mm d-1] |
RMSE [mm d-1] |
Phase Shift [months] |
Bias Score [1] |
RMSE Score [1] |
Seasonal Cycle Score [1] |
Interannual Variability Score [1] |
Overall Score [1] |
|||
|---|---|---|---|---|---|---|---|---|---|---|---|---|
| Benchmark | [-] | 0.00229 | ||||||||||
| HARDCODEP2000 | [-] | 0.00253 | 0.000404 | 0.00188 | 1.81 | 0.787 | 0.423 | 0.712 | 0.784 | 0.626 |
Download Data |
Period Mean (original grids) [mm d-1] |
Bias [mm d-1] |
RMSE [mm d-1] |
Phase Shift [months] |
Bias Score [1] |
RMSE Score [1] |
Seasonal Cycle Score [1] |
Interannual Variability Score [1] |
Overall Score [1] |
|||
|---|---|---|---|---|---|---|---|---|---|---|---|---|
| Benchmark | [-] | 0.00124 | ||||||||||
| HARDCODEP2000 | [-] | nan | nan | nan | nan | nan | nan | nan | nan | nan |
Download Data |
Period Mean (original grids) [mm d-1] |
Bias [mm d-1] |
RMSE [mm d-1] |
Phase Shift [months] |
Bias Score [1] |
RMSE Score [1] |
Seasonal Cycle Score [1] |
Interannual Variability Score [1] |
Overall Score [1] |
|||
|---|---|---|---|---|---|---|---|---|---|---|---|---|
| Benchmark | [-] | 0.00165 | ||||||||||
| HARDCODEP2000 | [-] | nan | nan | nan | nan | nan | nan | nan | nan | nan |
Download Data |
Period Mean (original grids) [mm d-1] |
Bias [mm d-1] |
RMSE [mm d-1] |
Phase Shift [months] |
Bias Score [1] |
RMSE Score [1] |
Seasonal Cycle Score [1] |
Interannual Variability Score [1] |
Overall Score [1] |
|||
|---|---|---|---|---|---|---|---|---|---|---|---|---|
| Benchmark | [-] | 0.00319 | ||||||||||
| HARDCODEP2000 | [-] | nan | nan | nan | nan | nan | nan | nan | nan | nan |
Temporally integrated period mean