Mean State
Download Data |
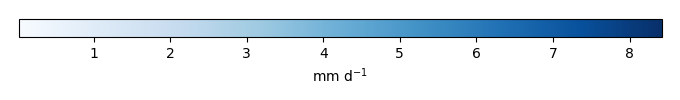
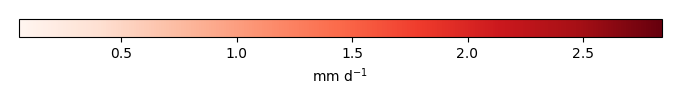
Period Mean (original grids) [mm d-1] |
Model Period Mean (intersection) [mm d-1] |
Model Period Mean (complement) [mm d-1] |
Benchmark Period Mean (intersection) [mm d-1] |
Benchmark Period Mean (complement) [mm d-1] |
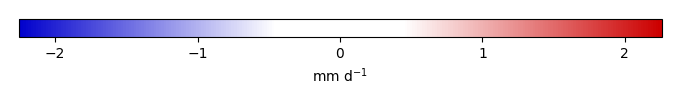
Bias [mm d-1] |
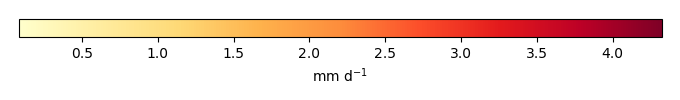
RMSE [mm d-1] |
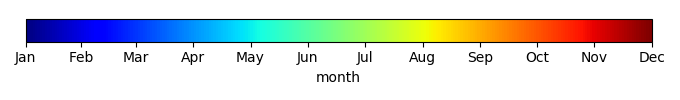
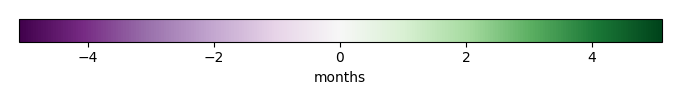
Phase Shift [months] |
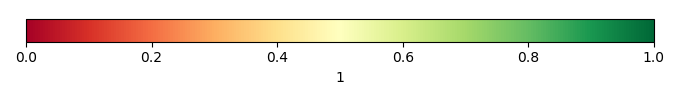
Bias Score [1] |
RMSE Score [1] |
Seasonal Cycle Score [1] |
Spatial Distribution Score [1] |
Interannual Variability Score [1] |
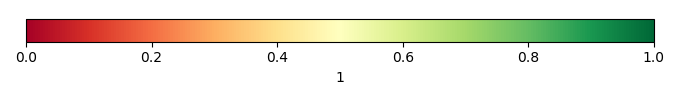
Overall Score [1] |
|||
|---|---|---|---|---|---|---|---|---|---|---|---|---|---|---|---|---|---|
| Benchmark | [-] | 3.65 | |||||||||||||||
| HARDCODEP2000 | [-] | 3.67 | 3.57 | 3.89 | 3.62 | -0.320 | 1.72 | 1.57 | 0.758 | 0.446 | 0.901 | 0.977 | 0.644 | 0.695 |
Download Data |
Period Mean (original grids) [mm d-1] |
Model Period Mean (intersection) [mm d-1] |
Model Period Mean (complement) [mm d-1] |
Benchmark Period Mean (intersection) [mm d-1] |
Benchmark Period Mean (complement) [mm d-1] |
Bias [mm d-1] |
RMSE [mm d-1] |
Phase Shift [months] |
Bias Score [1] |
RMSE Score [1] |
Seasonal Cycle Score [1] |
Spatial Distribution Score [1] |
Interannual Variability Score [1] |
Overall Score [1] |
|||
|---|---|---|---|---|---|---|---|---|---|---|---|---|---|---|---|---|---|
| Benchmark | [-] | 2.54 | |||||||||||||||
| HARDCODEP2000 | [-] | 2.82 | 2.76 | 2.84 | 2.50 | -0.0711 | 1.41 | 0.535 | 0.819 | 0.623 | 0.930 | 0.980 | 0.717 | 0.782 |
Download Data |
Period Mean (original grids) [mm d-1] |
Model Period Mean (intersection) [mm d-1] |
Model Period Mean (complement) [mm d-1] |
Benchmark Period Mean (intersection) [mm d-1] |
Benchmark Period Mean (complement) [mm d-1] |
Bias [mm d-1] |
RMSE [mm d-1] |
Phase Shift [months] |
Bias Score [1] |
RMSE Score [1] |
Seasonal Cycle Score [1] |
Spatial Distribution Score [1] |
Interannual Variability Score [1] |
Overall Score [1] |
|||
|---|---|---|---|---|---|---|---|---|---|---|---|---|---|---|---|---|---|
| Benchmark | [-] | 2.41 | |||||||||||||||
| HARDCODEP2000 | [-] | 2.40 | 2.44 | 2.47 | 2.40 | -0.0303 | 1.26 | 0.787 | 0.857 | 0.626 | 0.915 | 0.989 | 0.785 | 0.800 |
Download Data |
Period Mean (original grids) [mm d-1] |
Model Period Mean (intersection) [mm d-1] |
Model Period Mean (complement) [mm d-1] |
Benchmark Period Mean (intersection) [mm d-1] |
Benchmark Period Mean (complement) [mm d-1] |
Bias [mm d-1] |
RMSE [mm d-1] |
Phase Shift [months] |
Bias Score [1] |
RMSE Score [1] |
Seasonal Cycle Score [1] |
Spatial Distribution Score [1] |
Interannual Variability Score [1] |
Overall Score [1] |
|||
|---|---|---|---|---|---|---|---|---|---|---|---|---|---|---|---|---|---|
| Benchmark | [-] | 1.32 | |||||||||||||||
| HARDCODEP2000 | [-] | 1.02 | 0.994 | 1.06 | 1.32 | -0.0682 | 0.340 | 0.218 | 0.847 | 0.654 | 0.989 | 0.943 | 0.883 | 0.829 |
Download Data |
Period Mean (original grids) [mm d-1] |
Model Period Mean (intersection) [mm d-1] |
Model Period Mean (complement) [mm d-1] |
Benchmark Period Mean (intersection) [mm d-1] |
Benchmark Period Mean (complement) [mm d-1] |
Bias [mm d-1] |
RMSE [mm d-1] |
Phase Shift [months] |
Bias Score [1] |
RMSE Score [1] |
Seasonal Cycle Score [1] |
Spatial Distribution Score [1] |
Interannual Variability Score [1] |
Overall Score [1] |
|||
|---|---|---|---|---|---|---|---|---|---|---|---|---|---|---|---|---|---|
| Benchmark | [-] | 6.84 | |||||||||||||||
| HARDCODEP2000 | [-] | 9.84 | 9.84 | 9.85 | 6.78 | -0.0524 | 3.01 | 2.24 | 0.694 | 0.415 | 0.665 | 0.525 | 0.725 | 0.573 |
Download Data |
Period Mean (original grids) [mm d-1] |
Model Period Mean (intersection) [mm d-1] |
Model Period Mean (complement) [mm d-1] |
Benchmark Period Mean (intersection) [mm d-1] |
Benchmark Period Mean (complement) [mm d-1] |
Bias [mm d-1] |
RMSE [mm d-1] |
Phase Shift [months] |
Bias Score [1] |
RMSE Score [1] |
Seasonal Cycle Score [1] |
Spatial Distribution Score [1] |
Interannual Variability Score [1] |
Overall Score [1] |
|||
|---|---|---|---|---|---|---|---|---|---|---|---|---|---|---|---|---|---|
| Benchmark | [-] | 1.72 | |||||||||||||||
| HARDCODEP2000 | [-] | 1.49 | 1.50 | 1.68 | 1.72 | -0.181 | 0.581 | 0.786 | 0.765 | 0.586 | 0.863 | 0.955 | 0.886 | 0.773 |
Download Data |
Period Mean (original grids) [mm d-1] |
Model Period Mean (intersection) [mm d-1] |
Model Period Mean (complement) [mm d-1] |
Benchmark Period Mean (intersection) [mm d-1] |
Benchmark Period Mean (complement) [mm d-1] |
Bias [mm d-1] |
RMSE [mm d-1] |
Phase Shift [months] |
Bias Score [1] |
RMSE Score [1] |
Seasonal Cycle Score [1] |
Spatial Distribution Score [1] |
Interannual Variability Score [1] |
Overall Score [1] |
|||
|---|---|---|---|---|---|---|---|---|---|---|---|---|---|---|---|---|---|
| Benchmark | [-] | 1.76 | |||||||||||||||
| HARDCODEP2000 | [-] | 1.26 | 1.28 | 1.54 | 1.79 | -0.262 | 0.748 | 0.940 | 0.760 | 0.594 | 0.897 | 0.981 | 0.848 | 0.779 |
Download Data |
Period Mean (original grids) [mm d-1] |
Model Period Mean (intersection) [mm d-1] |
Model Period Mean (complement) [mm d-1] |
Benchmark Period Mean (intersection) [mm d-1] |
Benchmark Period Mean (complement) [mm d-1] |
Bias [mm d-1] |
RMSE [mm d-1] |
Phase Shift [months] |
Bias Score [1] |
RMSE Score [1] |
Seasonal Cycle Score [1] |
Spatial Distribution Score [1] |
Interannual Variability Score [1] |
Overall Score [1] |
|||
|---|---|---|---|---|---|---|---|---|---|---|---|---|---|---|---|---|---|
| Benchmark | [-] | 3.99 | |||||||||||||||
| HARDCODEP2000 | [-] | 3.23 | 3.21 | 3.44 | 4.03 | -0.249 | 2.36 | 0.975 | 0.769 | 0.584 | 0.921 | 0.954 | 0.814 | 0.771 |
Download Data |
Period Mean (original grids) [mm d-1] |
Model Period Mean (intersection) [mm d-1] |
Model Period Mean (complement) [mm d-1] |
Benchmark Period Mean (intersection) [mm d-1] |
Benchmark Period Mean (complement) [mm d-1] |
Bias [mm d-1] |
RMSE [mm d-1] |
Phase Shift [months] |
Bias Score [1] |
RMSE Score [1] |
Seasonal Cycle Score [1] |
Spatial Distribution Score [1] |
Interannual Variability Score [1] |
Overall Score [1] |
|||
|---|---|---|---|---|---|---|---|---|---|---|---|---|---|---|---|---|---|
| Benchmark | [-] | 1.56 | |||||||||||||||
| HARDCODEP2000 | [-] | 1.43 | 1.54 | 1.79 | 1.55 | -0.256 | 0.537 | 0.517 | 0.656 | 0.582 | 0.923 | 0.956 | 0.902 | 0.767 |
Download Data |
Period Mean (original grids) [mm d-1] |
Model Period Mean (intersection) [mm d-1] |
Model Period Mean (complement) [mm d-1] |
Benchmark Period Mean (intersection) [mm d-1] |
Benchmark Period Mean (complement) [mm d-1] |
Bias [mm d-1] |
RMSE [mm d-1] |
Phase Shift [months] |
Bias Score [1] |
RMSE Score [1] |
Seasonal Cycle Score [1] |
Spatial Distribution Score [1] |
Interannual Variability Score [1] |
Overall Score [1] |
|||
|---|---|---|---|---|---|---|---|---|---|---|---|---|---|---|---|---|---|
| Benchmark | [-] | 1.76 | |||||||||||||||
| HARDCODEP2000 | [-] | 1.35 | 1.35 | 1.42 | 1.79 | -0.0676 | 0.830 | 0.403 | 0.907 | 0.635 | 0.942 | 0.988 | 0.876 | 0.830 |
Download Data |
Period Mean (original grids) [mm d-1] |
Model Period Mean (intersection) [mm d-1] |
Model Period Mean (complement) [mm d-1] |
Benchmark Period Mean (intersection) [mm d-1] |
Benchmark Period Mean (complement) [mm d-1] |
Bias [mm d-1] |
RMSE [mm d-1] |
Phase Shift [months] |
Bias Score [1] |
RMSE Score [1] |
Seasonal Cycle Score [1] |
Spatial Distribution Score [1] |
Interannual Variability Score [1] |
Overall Score [1] |
|||
|---|---|---|---|---|---|---|---|---|---|---|---|---|---|---|---|---|---|
| Benchmark | [-] | 2.59 | |||||||||||||||
| HARDCODEP2000 | [-] | 2.49 | 2.50 | 2.65 | 2.59 | -0.137 | 0.957 | 0.902 | 0.734 | 0.563 | 0.847 | 0.990 | 0.900 | 0.766 |
Download Data |
Period Mean (original grids) [mm d-1] |
Model Period Mean (intersection) [mm d-1] |
Model Period Mean (complement) [mm d-1] |
Benchmark Period Mean (intersection) [mm d-1] |
Benchmark Period Mean (complement) [mm d-1] |
Bias [mm d-1] |
RMSE [mm d-1] |
Phase Shift [months] |
Bias Score [1] |
RMSE Score [1] |
Seasonal Cycle Score [1] |
Spatial Distribution Score [1] |
Interannual Variability Score [1] |
Overall Score [1] |
|||
|---|---|---|---|---|---|---|---|---|---|---|---|---|---|---|---|---|---|
| Benchmark | [-] | 2.68 | |||||||||||||||
| HARDCODEP2000 | [-] | 2.19 | 2.19 | 2.36 | 2.69 | -0.169 | 1.10 | 0.867 | 0.778 | 0.560 | 0.909 | 0.987 | 0.779 | 0.762 |
Download Data |
Period Mean (original grids) [mm d-1] |
Model Period Mean (intersection) [mm d-1] |
Model Period Mean (complement) [mm d-1] |
Benchmark Period Mean (intersection) [mm d-1] |
Benchmark Period Mean (complement) [mm d-1] |
Bias [mm d-1] |
RMSE [mm d-1] |
Phase Shift [months] |
Bias Score [1] |
RMSE Score [1] |
Seasonal Cycle Score [1] |
Spatial Distribution Score [1] |
Interannual Variability Score [1] |
Overall Score [1] |
|||
|---|---|---|---|---|---|---|---|---|---|---|---|---|---|---|---|---|---|
| Benchmark | [-] | 0.448 | |||||||||||||||
| HARDCODEP2000 | [-] | 0.275 | 0.275 | 0.331 | 0.459 | -0.0571 | 0.413 | 1.43 | 0.696 | 0.463 | 0.794 | 0.919 | 0.725 | 0.677 |
Download Data |
Period Mean (original grids) [mm d-1] |
Model Period Mean (intersection) [mm d-1] |
Model Period Mean (complement) [mm d-1] |
Benchmark Period Mean (intersection) [mm d-1] |
Benchmark Period Mean (complement) [mm d-1] |
Bias [mm d-1] |
RMSE [mm d-1] |
Phase Shift [months] |
Bias Score [1] |
RMSE Score [1] |
Seasonal Cycle Score [1] |
Spatial Distribution Score [1] |
Interannual Variability Score [1] |
Overall Score [1] |
|||
|---|---|---|---|---|---|---|---|---|---|---|---|---|---|---|---|---|---|
| Benchmark | [-] | 1.25 | |||||||||||||||
| HARDCODEP2000 | [-] | 2.24 | 2.15 | 1.87 | 1.24 | 0.291 | 0.770 | 0.647 | 0.676 | 0.534 | 0.907 | 0.923 | 0.757 | 0.722 |
Download Data |
Period Mean (original grids) [mm d-1] |
Model Period Mean (intersection) [mm d-1] |
Model Period Mean (complement) [mm d-1] |
Benchmark Period Mean (intersection) [mm d-1] |
Benchmark Period Mean (complement) [mm d-1] |
Bias [mm d-1] |
RMSE [mm d-1] |
Phase Shift [months] |
Bias Score [1] |
RMSE Score [1] |
Seasonal Cycle Score [1] |
Spatial Distribution Score [1] |
Interannual Variability Score [1] |
Overall Score [1] |
|||
|---|---|---|---|---|---|---|---|---|---|---|---|---|---|---|---|---|---|
| Benchmark | [-] | 3.19 | |||||||||||||||
| HARDCODEP2000 | [-] | 1.78 | 1.81 | 2.77 | 3.21 | -0.912 | 1.97 | 0.955 | 0.686 | 0.507 | 0.975 | 0.848 | 0.679 | 0.700 |
Download Data |
Period Mean (original grids) [mm d-1] |
Model Period Mean (intersection) [mm d-1] |
Model Period Mean (complement) [mm d-1] |
Benchmark Period Mean (intersection) [mm d-1] |
Benchmark Period Mean (complement) [mm d-1] |
Bias [mm d-1] |
RMSE [mm d-1] |
Phase Shift [months] |
Bias Score [1] |
RMSE Score [1] |
Seasonal Cycle Score [1] |
Spatial Distribution Score [1] |
Interannual Variability Score [1] |
Overall Score [1] |
|||
|---|---|---|---|---|---|---|---|---|---|---|---|---|---|---|---|---|---|
| Benchmark | [-] | 3.32 | |||||||||||||||
| HARDCODEP2000 | [-] | 2.96 | 2.96 | 2.96 | 3.36 | -0.00576 | 1.06 | 0.764 | 0.810 | 0.525 | 0.902 | 0.938 | 0.854 | 0.759 |
Download Data |
Period Mean (original grids) [mm d-1] |
Model Period Mean (intersection) [mm d-1] |
Model Period Mean (complement) [mm d-1] |
Benchmark Period Mean (intersection) [mm d-1] |
Benchmark Period Mean (complement) [mm d-1] |
Bias [mm d-1] |
RMSE [mm d-1] |
Phase Shift [months] |
Bias Score [1] |
RMSE Score [1] |
Seasonal Cycle Score [1] |
Spatial Distribution Score [1] |
Interannual Variability Score [1] |
Overall Score [1] |
|||
|---|---|---|---|---|---|---|---|---|---|---|---|---|---|---|---|---|---|
| Benchmark | [-] | 2.42 | |||||||||||||||
| HARDCODEP2000 | [-] | 2.02 | 2.03 | 2.02 | 2.46 | 0.0119 | 0.719 | 0.792 | 0.773 | 0.543 | 0.873 | 0.988 | 0.830 | 0.758 |
Download Data |
Period Mean (original grids) [mm d-1] |
Model Period Mean (intersection) [mm d-1] |
Model Period Mean (complement) [mm d-1] |
Benchmark Period Mean (intersection) [mm d-1] |
Benchmark Period Mean (complement) [mm d-1] |
Bias [mm d-1] |
RMSE [mm d-1] |
Phase Shift [months] |
Bias Score [1] |
RMSE Score [1] |
Seasonal Cycle Score [1] |
Spatial Distribution Score [1] |
Interannual Variability Score [1] |
Overall Score [1] |
|||
|---|---|---|---|---|---|---|---|---|---|---|---|---|---|---|---|---|---|
| Benchmark | [-] | 1.46 | |||||||||||||||
| HARDCODEP2000 | [-] | 1.01 | 1.00 | 1.25 | 1.47 | -0.257 | 0.800 | 0.850 | 0.725 | 0.502 | 0.931 | 0.370 | 0.759 | 0.632 |
Download Data |
Period Mean (original grids) [mm d-1] |
Model Period Mean (intersection) [mm d-1] |
Model Period Mean (complement) [mm d-1] |
Benchmark Period Mean (intersection) [mm d-1] |
Benchmark Period Mean (complement) [mm d-1] |
Bias [mm d-1] |
RMSE [mm d-1] |
Phase Shift [months] |
Bias Score [1] |
RMSE Score [1] |
Seasonal Cycle Score [1] |
Spatial Distribution Score [1] |
Interannual Variability Score [1] |
Overall Score [1] |
|||
|---|---|---|---|---|---|---|---|---|---|---|---|---|---|---|---|---|---|
| Benchmark | [-] | 6.21 | |||||||||||||||
| HARDCODEP2000 | [-] | 6.26 | 6.19 | 6.52 | 6.17 | -0.308 | 2.30 | 0.413 | 0.765 | 0.541 | 0.961 | 0.979 | 0.696 | 0.747 |
Download Data |
Period Mean (original grids) [mm d-1] |
Model Period Mean (intersection) [mm d-1] |
Model Period Mean (complement) [mm d-1] |
Benchmark Period Mean (intersection) [mm d-1] |
Benchmark Period Mean (complement) [mm d-1] |
Bias [mm d-1] |
RMSE [mm d-1] |
Phase Shift [months] |
Bias Score [1] |
RMSE Score [1] |
Seasonal Cycle Score [1] |
Spatial Distribution Score [1] |
Interannual Variability Score [1] |
Overall Score [1] |
|||
|---|---|---|---|---|---|---|---|---|---|---|---|---|---|---|---|---|---|
| Benchmark | [-] | 3.45 | |||||||||||||||
| HARDCODEP2000 | [-] | 3.44 | 3.51 | 3.76 | 3.42 | -0.259 | 1.47 | 0.295 | 0.870 | 0.623 | 0.968 | 0.996 | 0.846 | 0.821 |
Download Data |
Period Mean (original grids) [mm d-1] |
Model Period Mean (intersection) [mm d-1] |
Model Period Mean (complement) [mm d-1] |
Benchmark Period Mean (intersection) [mm d-1] |
Benchmark Period Mean (complement) [mm d-1] |
Bias [mm d-1] |
RMSE [mm d-1] |
Phase Shift [months] |
Bias Score [1] |
RMSE Score [1] |
Seasonal Cycle Score [1] |
Spatial Distribution Score [1] |
Interannual Variability Score [1] |
Overall Score [1] |
|||
|---|---|---|---|---|---|---|---|---|---|---|---|---|---|---|---|---|---|
| Benchmark | [-] | 1.76 | |||||||||||||||
| HARDCODEP2000 | [-] | 1.99 | 1.43 | 1.59 | 1.77 | -0.180 | 1.33 | 0.914 | 0.515 | 0.479 | 0.870 | 0.795 | 0.733 | 0.645 |
Temporally integrated period mean