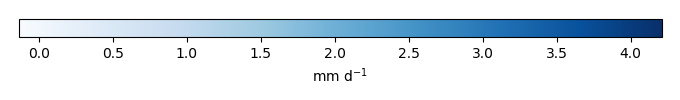
Mean State
Download Data |
Period Mean (original grids) [mm d-1] |
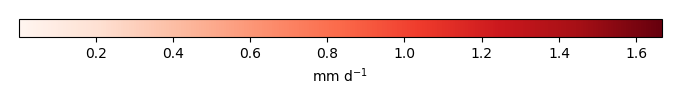
Bias [mm d-1] |
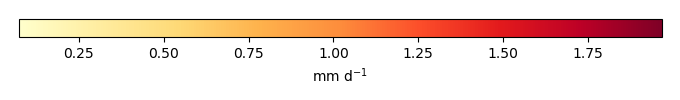
RMSE [mm d-1] |
Phase Shift [months] |
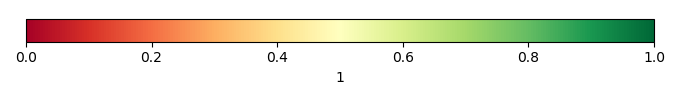
Bias Score [1] |
RMSE Score [1] |
Seasonal Cycle Score [1] |
Interannual Variability Score [1] |
Overall Score [1] |
|||
|---|---|---|---|---|---|---|---|---|---|---|---|---|
| Benchmark | [-] | 1.20 | ||||||||||
| Co2-284.7 | [-] | 1.28 | 0.0574 | 0.572 | 0.952 | 0.640 | 0.505 | 0.841 | 0.761 | 0.650 | ||
| Co2-867.2 | [-] | 1.21 | -0.0182 | 0.549 | 0.973 | 0.639 | 0.513 | 0.851 | 0.786 | 0.661 | ||
| Control | [-] | 1.28 | 0.0575 | 0.572 | 0.954 | 0.638 | 0.505 | 0.850 | 0.762 | 0.652 | ||
| GSWP3-1901-1910 | [-] | 1.24 | 0.0186 | 0.642 | 1.01 | 0.614 | 0.461 | 0.854 | 0.756 | 0.629 | ||
| Ndepp5 | [-] | 1.34 | 0.115 | 0.600 | 0.988 | 0.643 | 0.484 | 0.844 | 0.740 | 0.639 | ||
| PI-1850-1859 | [-] | 1.25 | 0.0261 | 0.589 | 1.01 | 0.637 | 0.487 | 0.828 | 0.748 | 0.637 | ||
| SSP370-2090-2099 | [-] | 1.40 | 0.179 | 0.715 | 0.960 | 0.604 | 0.438 | 0.844 | 0.722 | 0.609 | ||
| SSP370-2091-2100 | [-] | 1.39 | 0.176 | 0.645 | 1.06 | 0.614 | 0.483 | 0.819 | 0.731 | 0.626 |
Temporally integrated period mean