
s2sLandSpinup
and
s2sLandSpinup
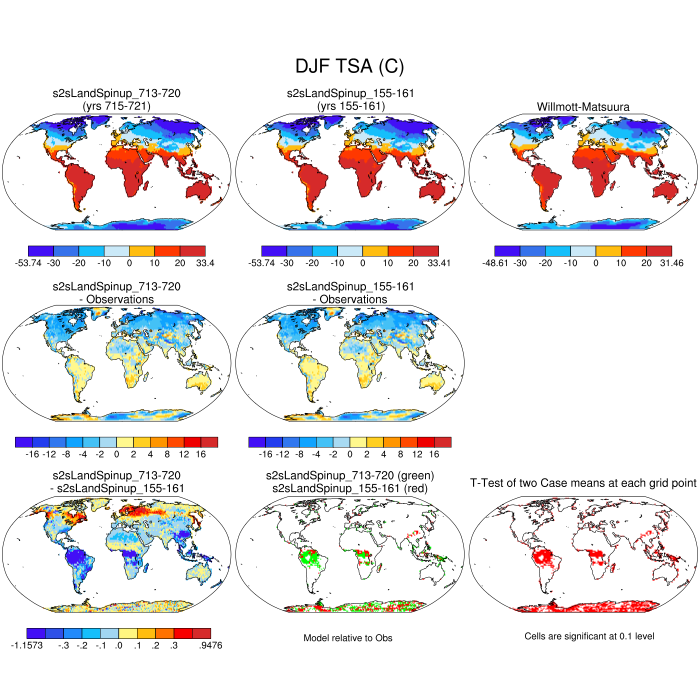
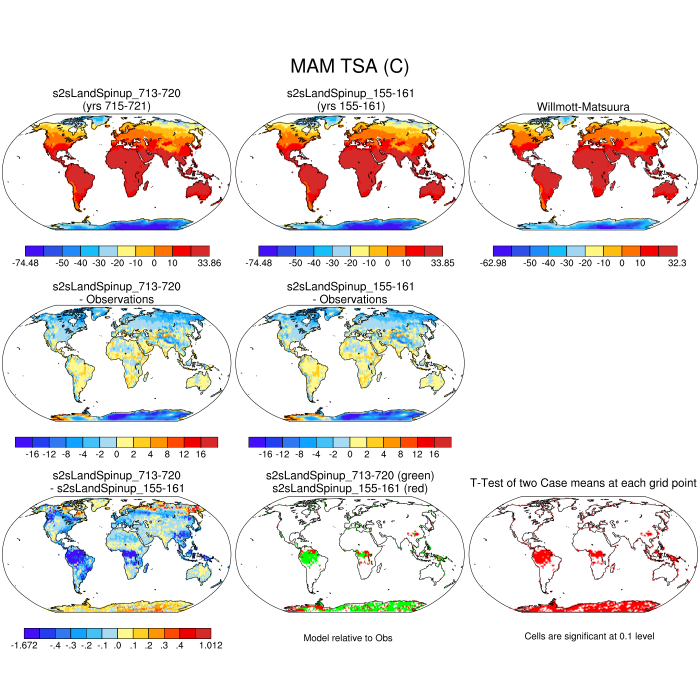
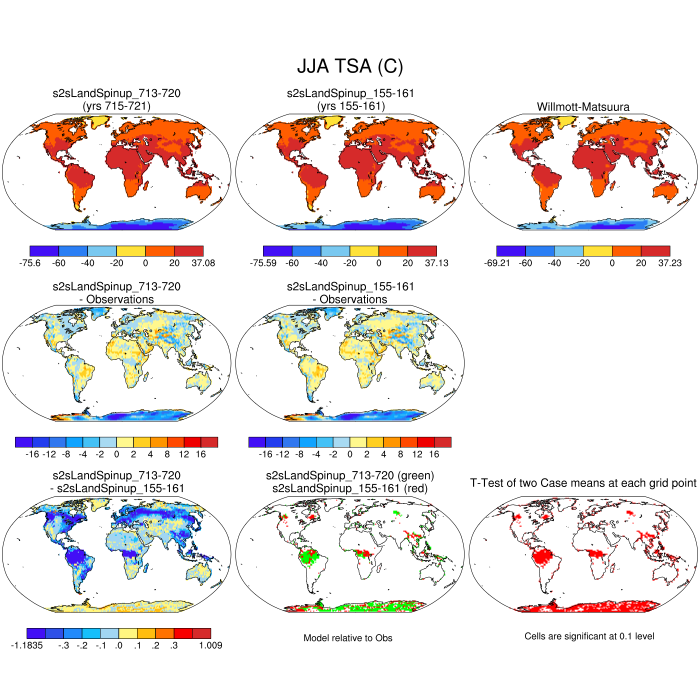
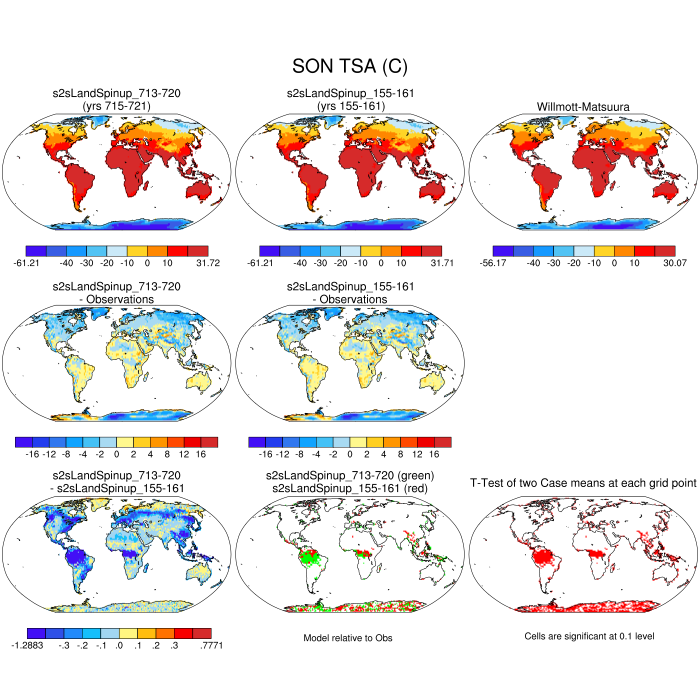
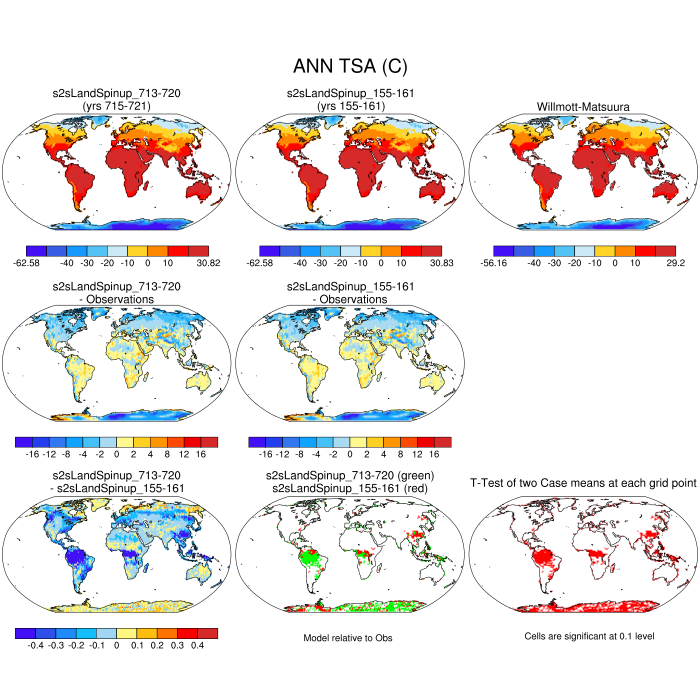
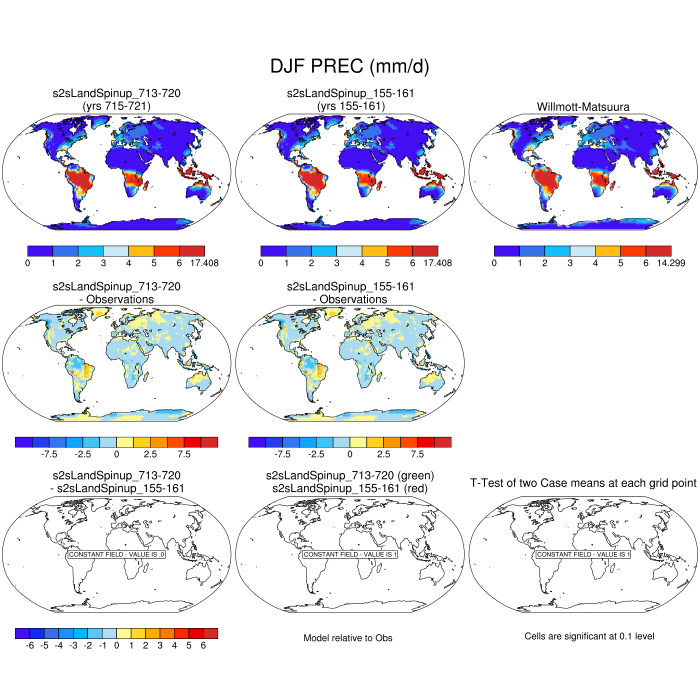
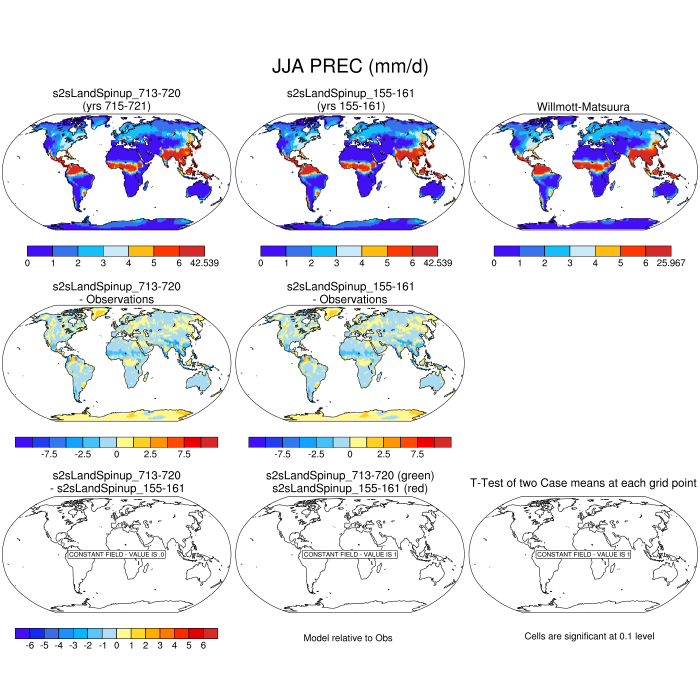
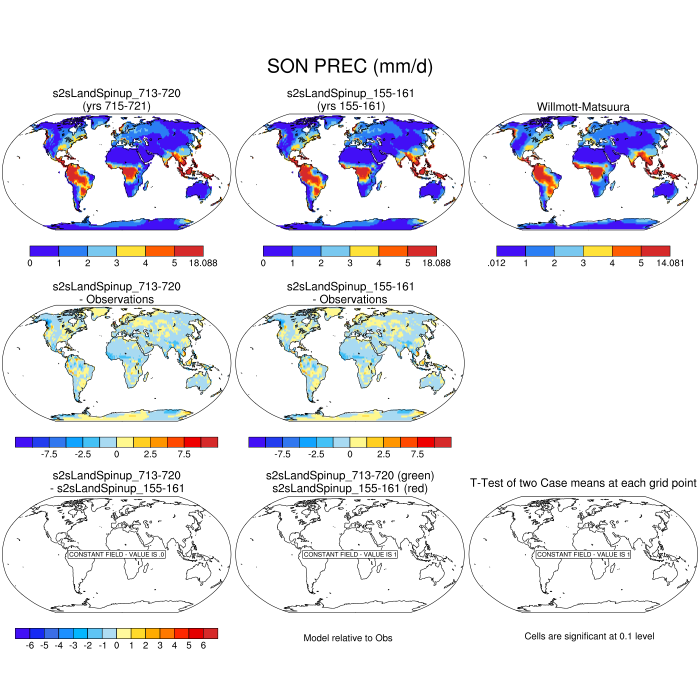
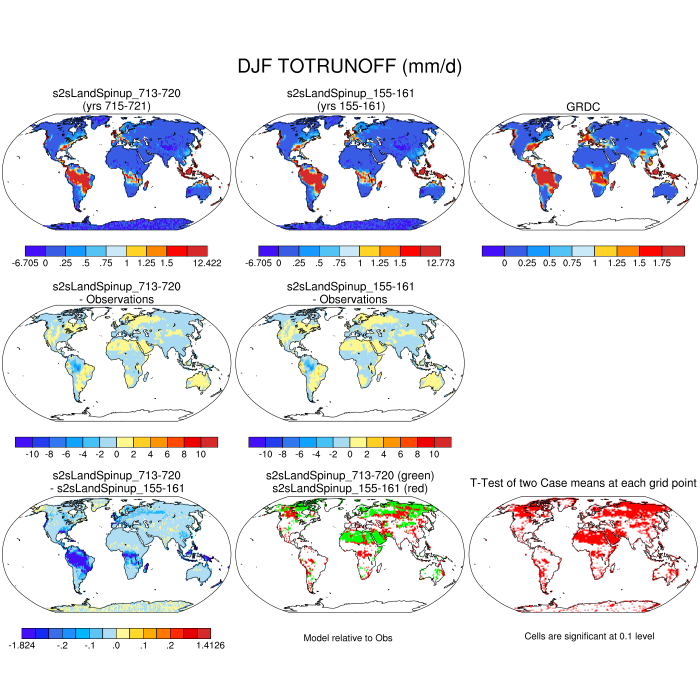
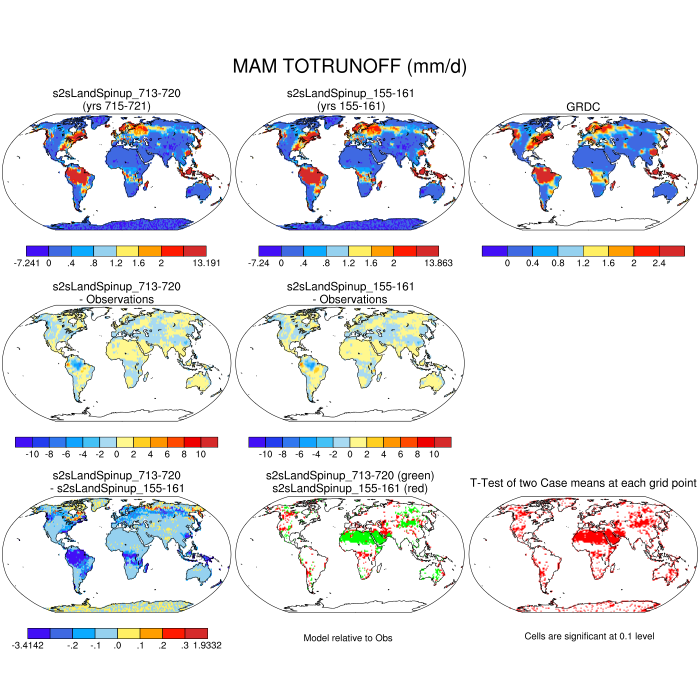
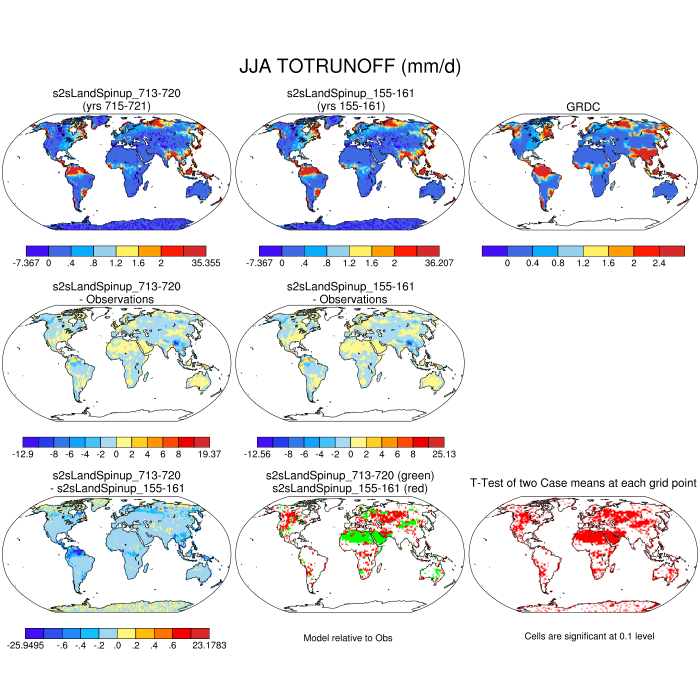
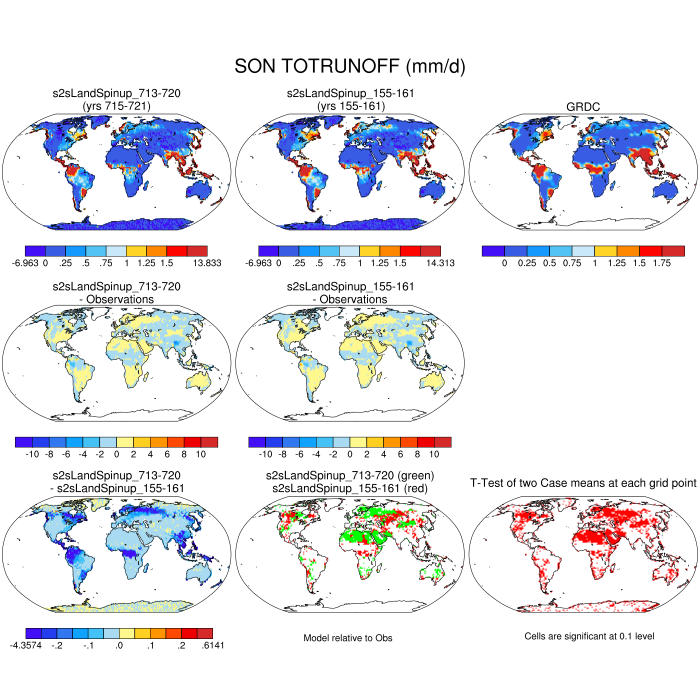
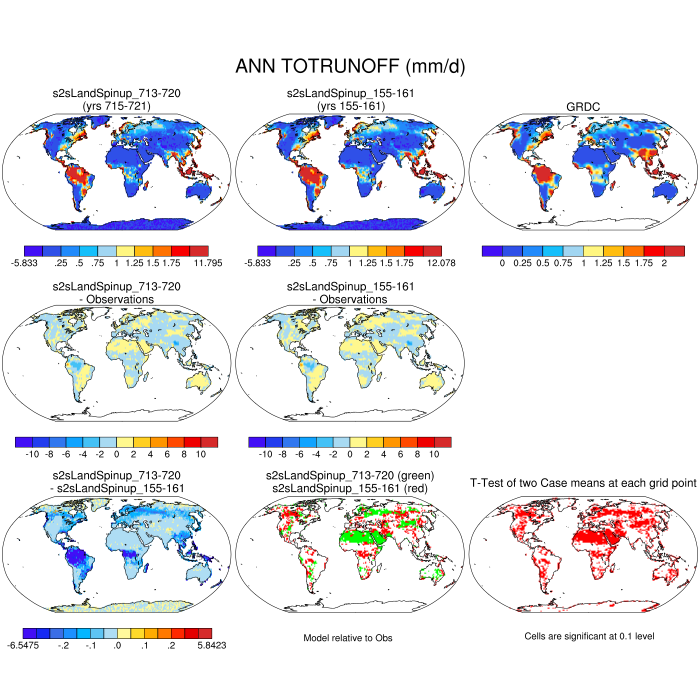
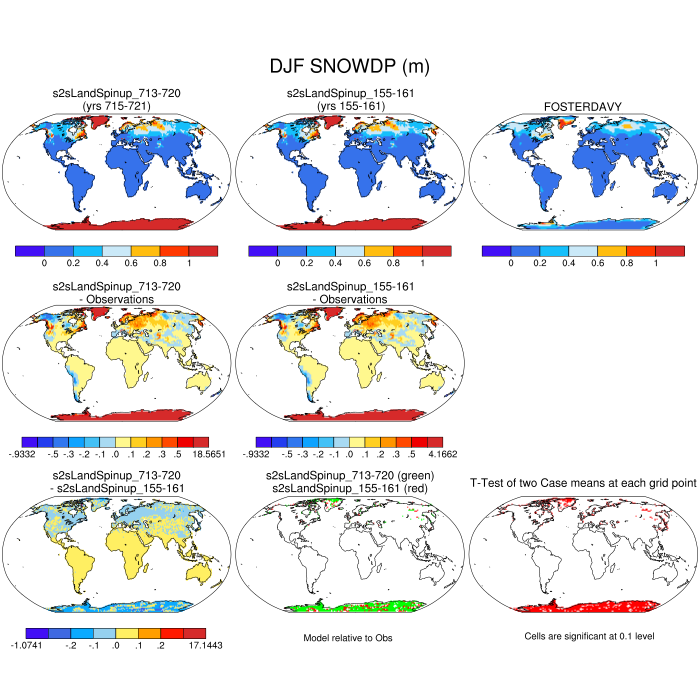
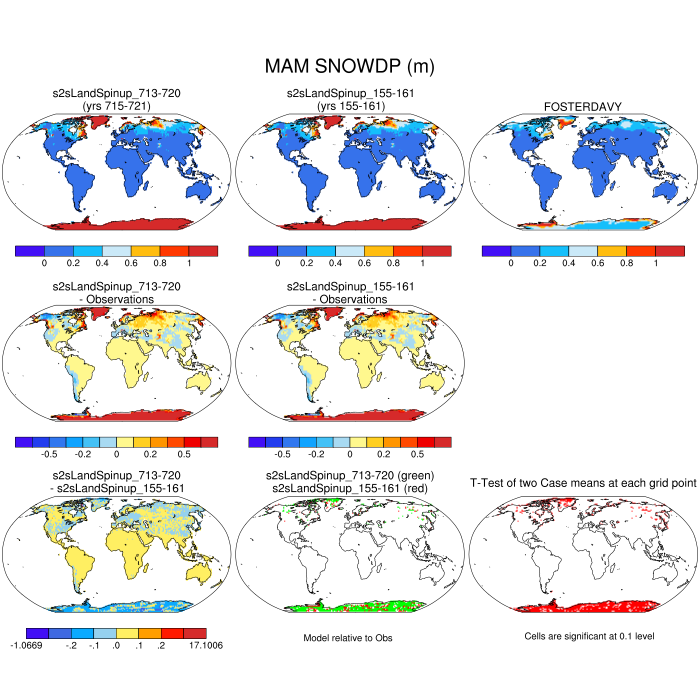
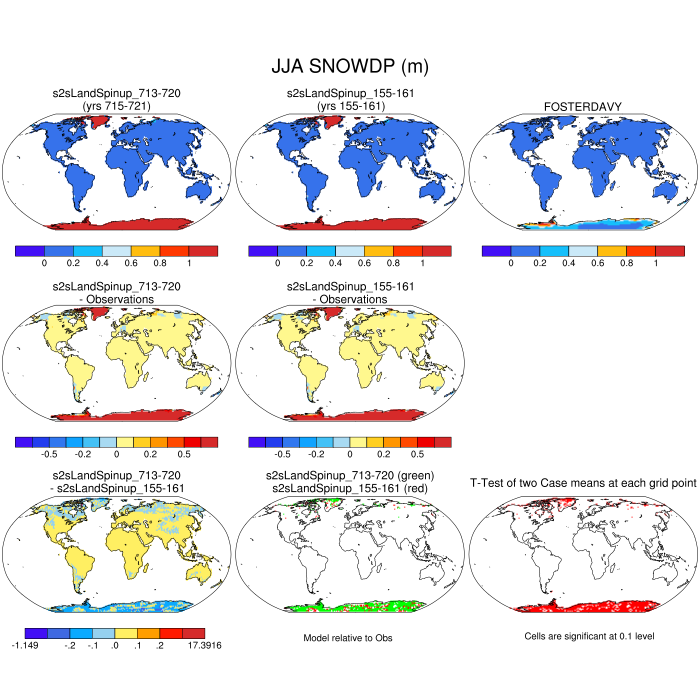
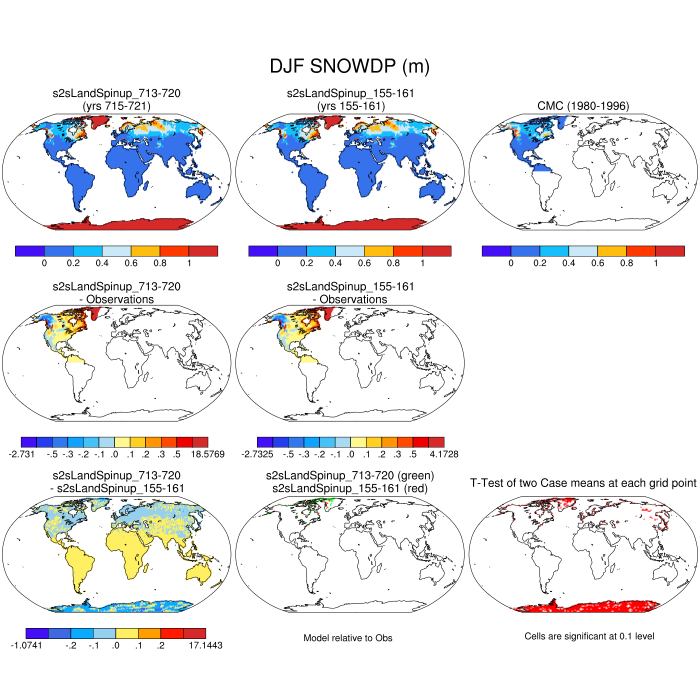
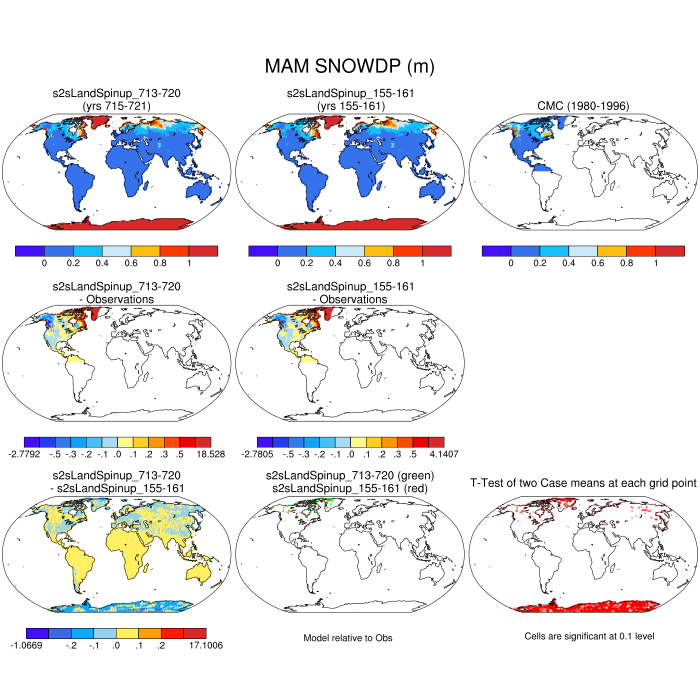
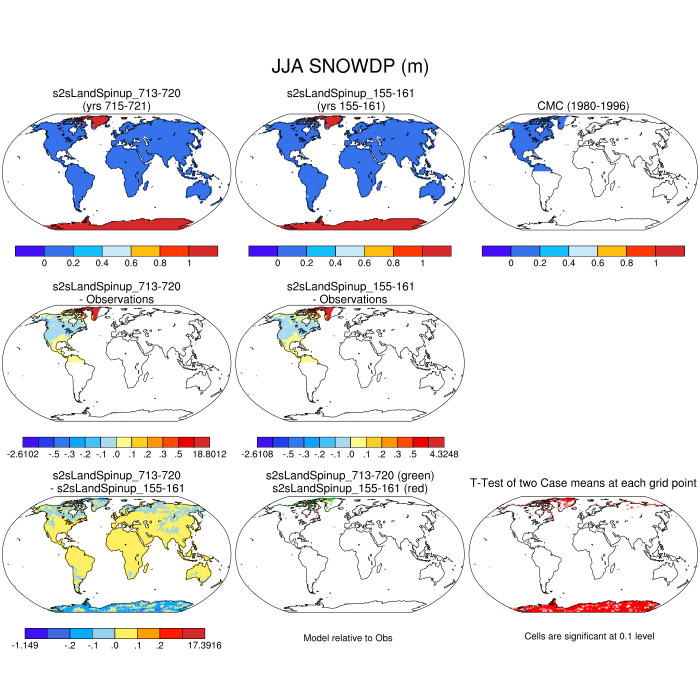
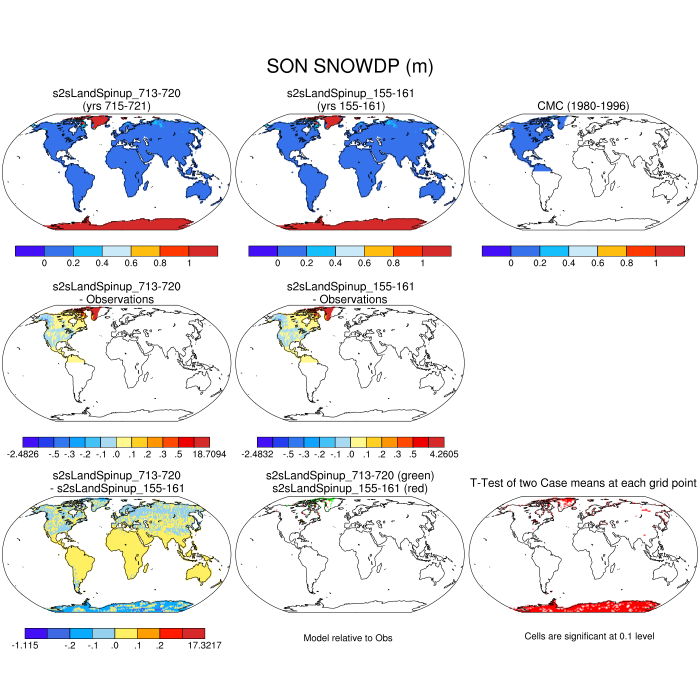
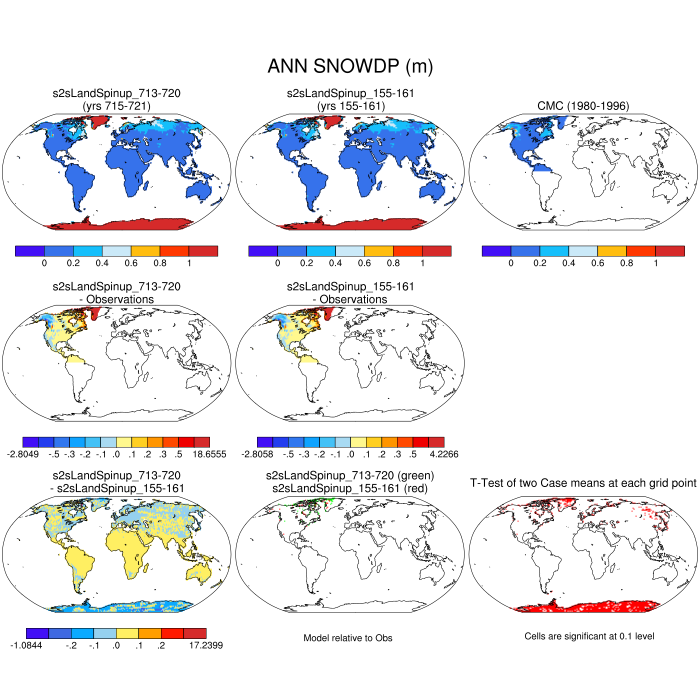
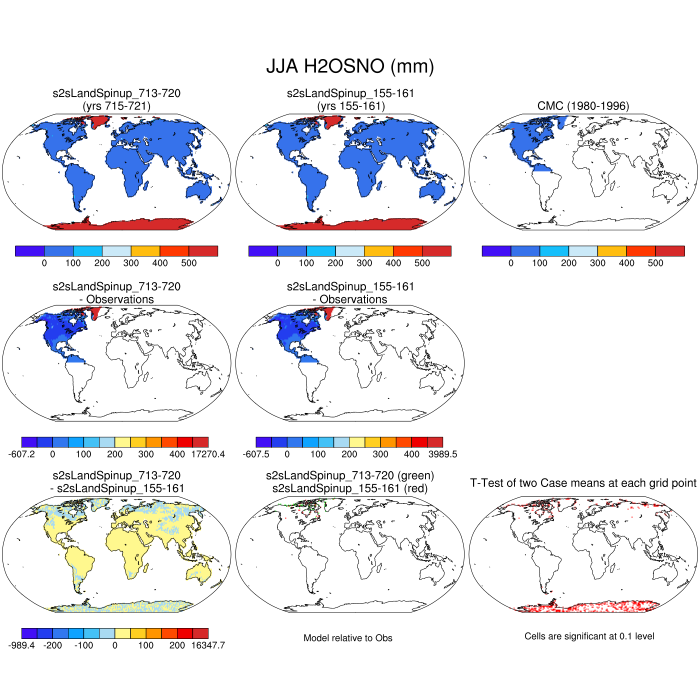
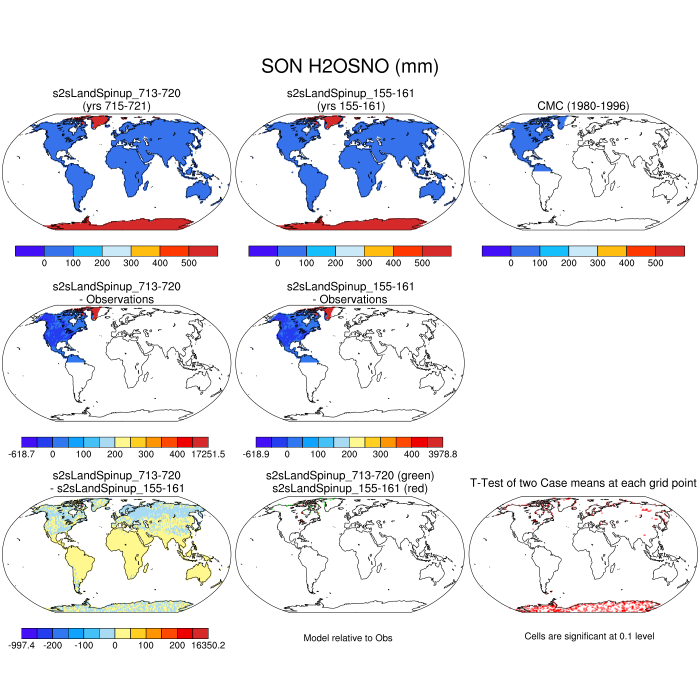
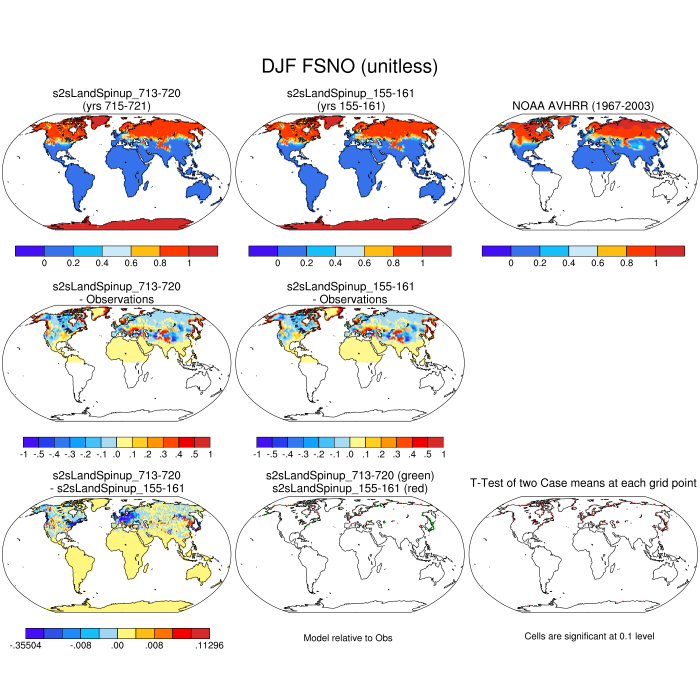
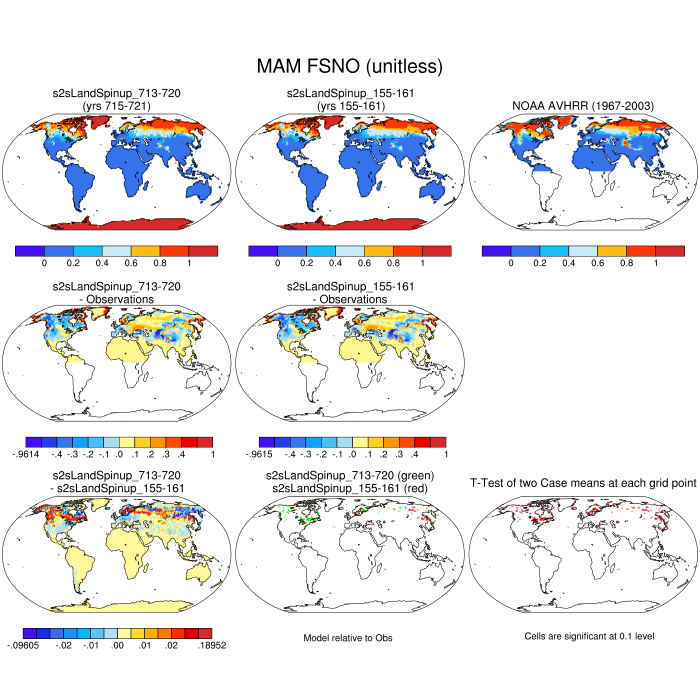
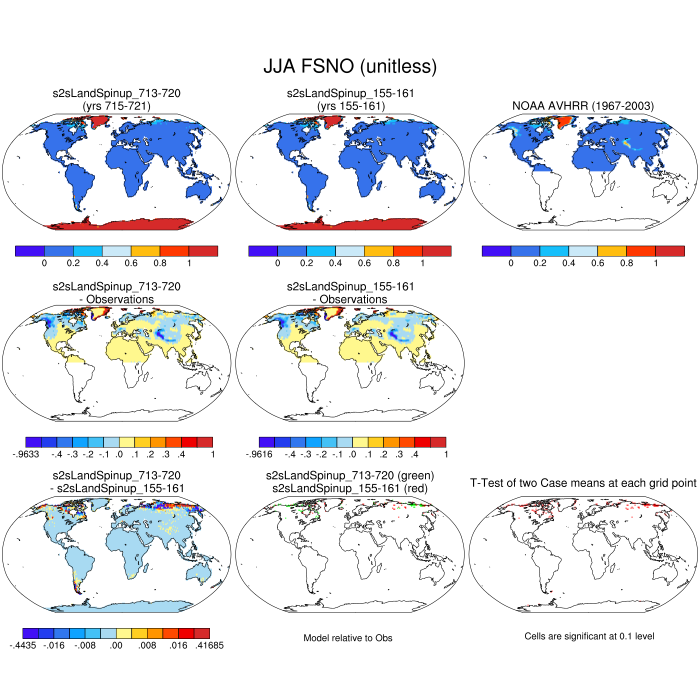
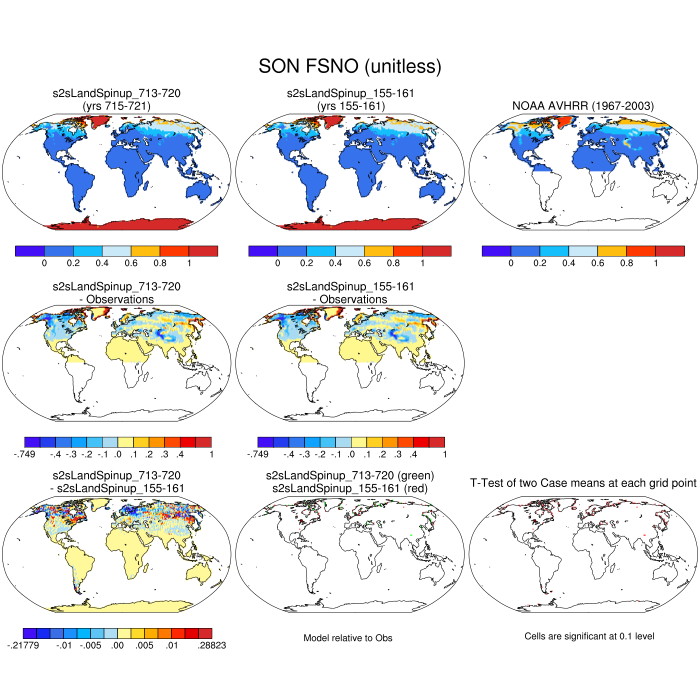
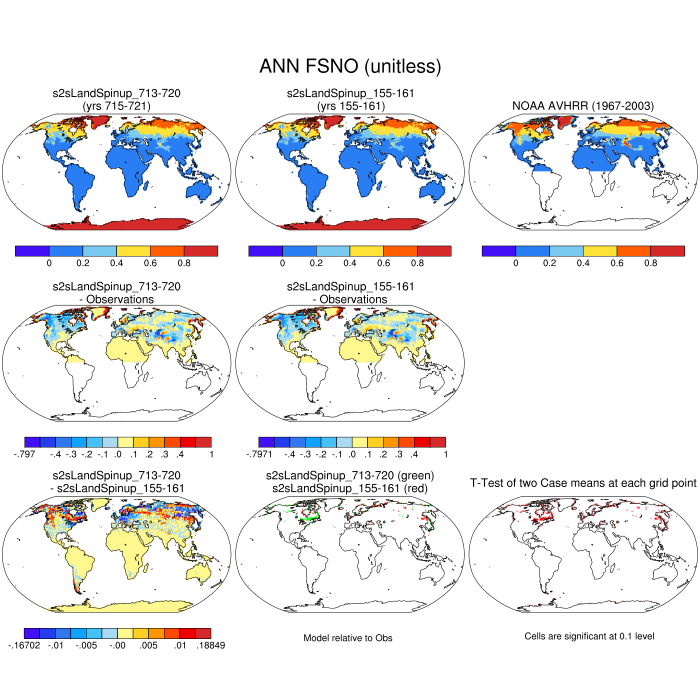
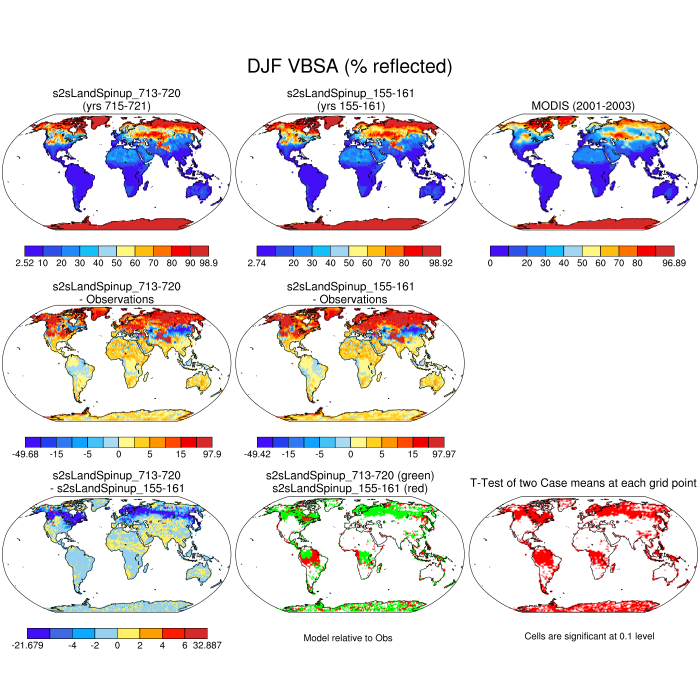
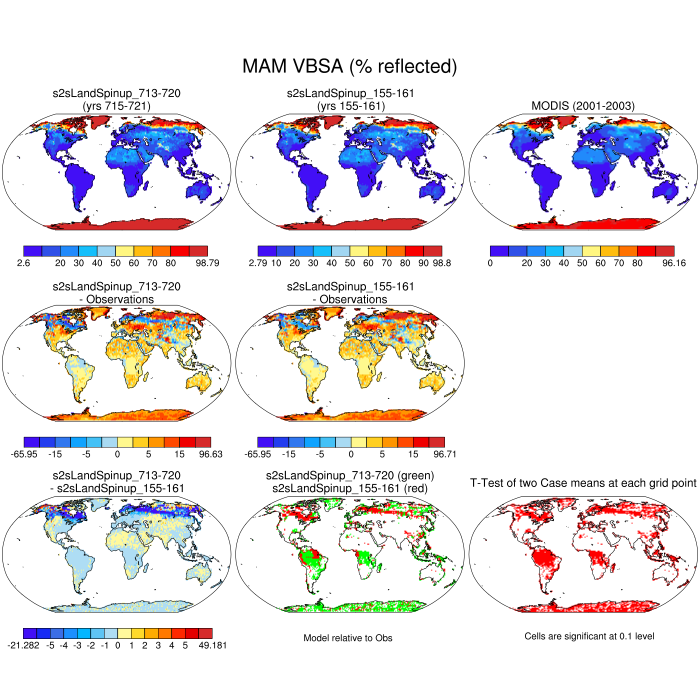
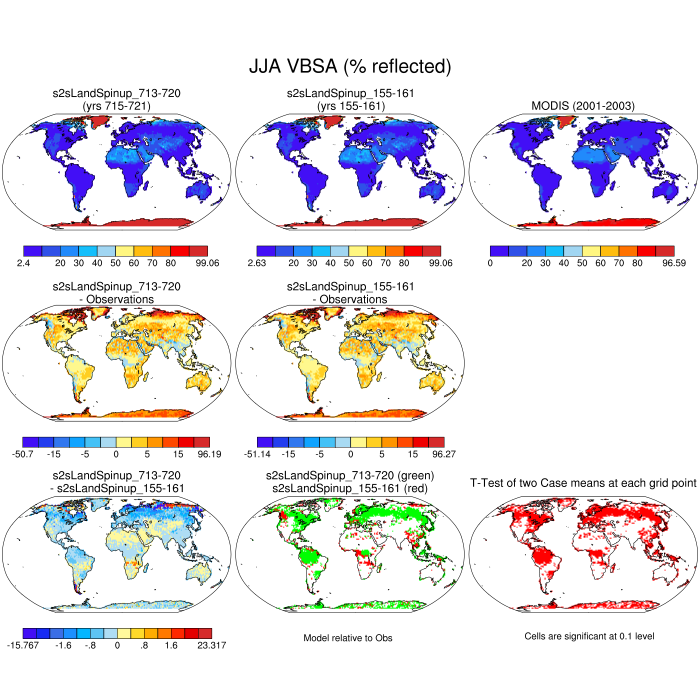
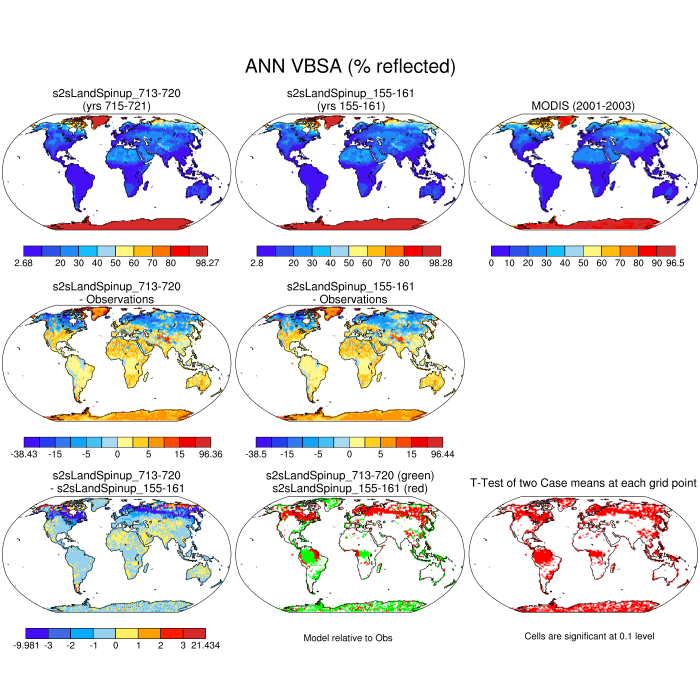
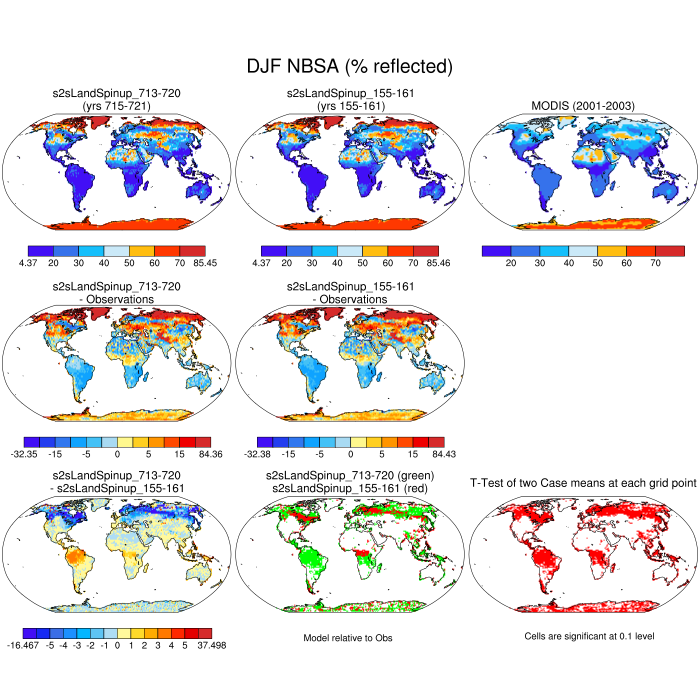
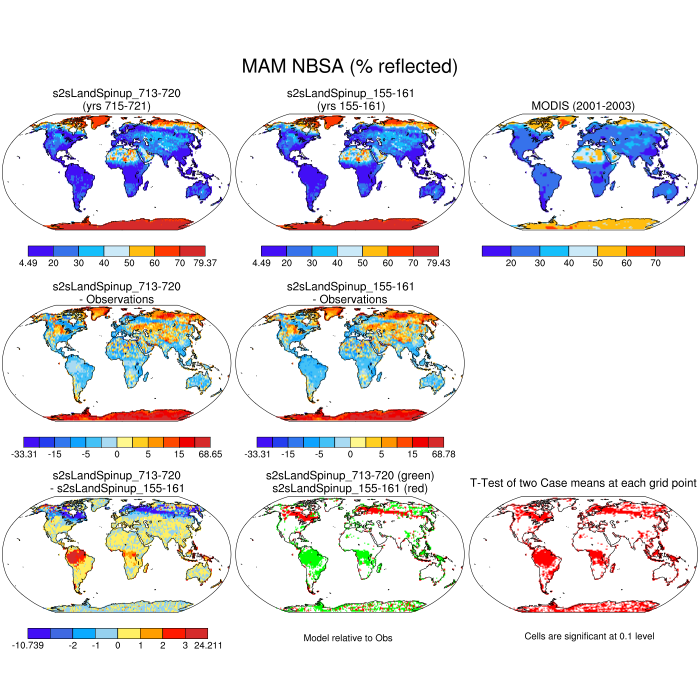
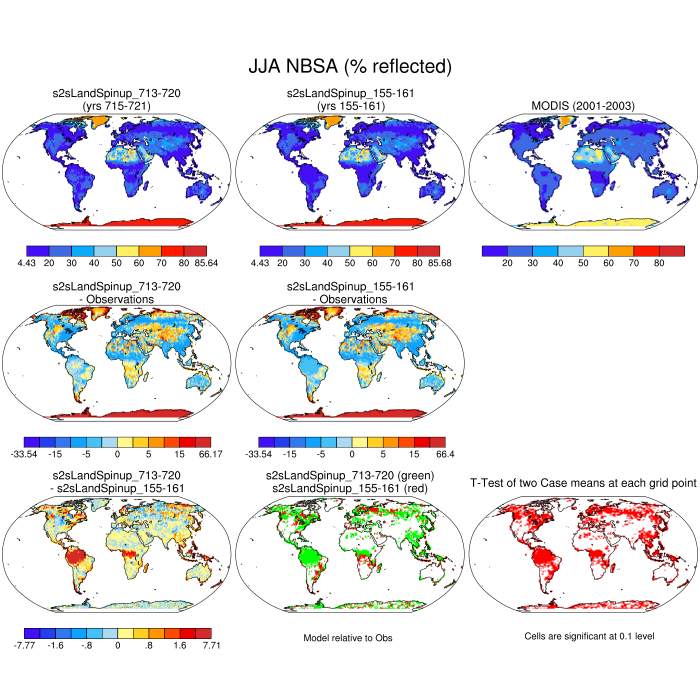
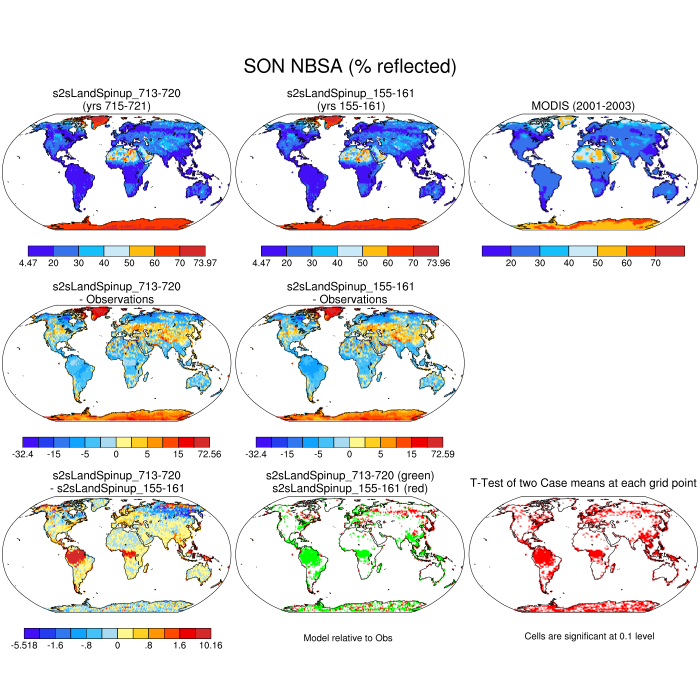
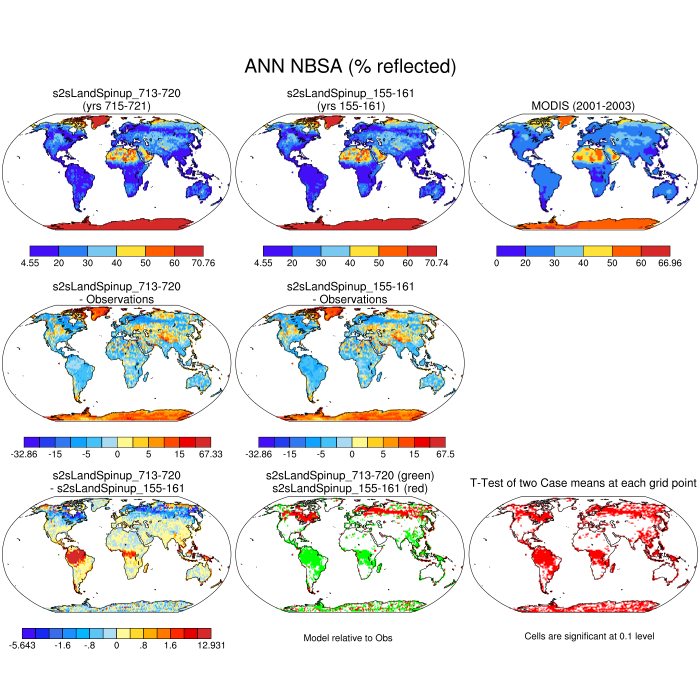
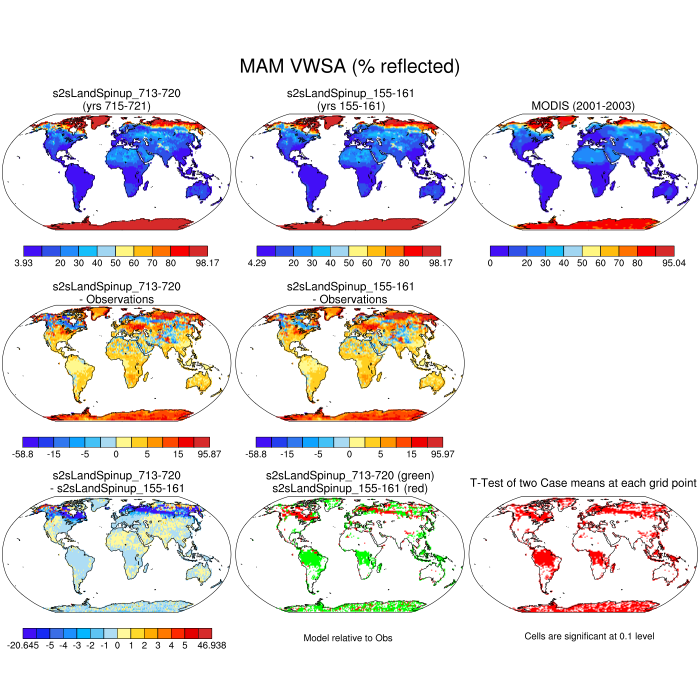
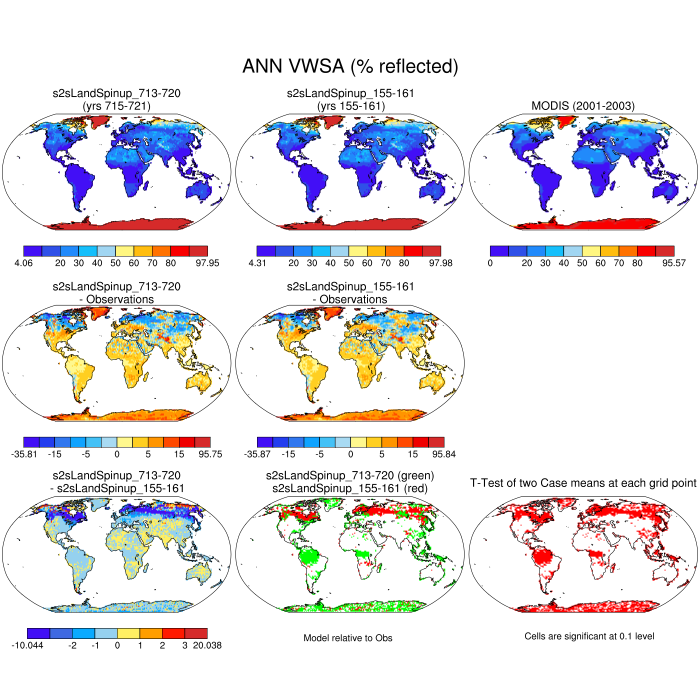
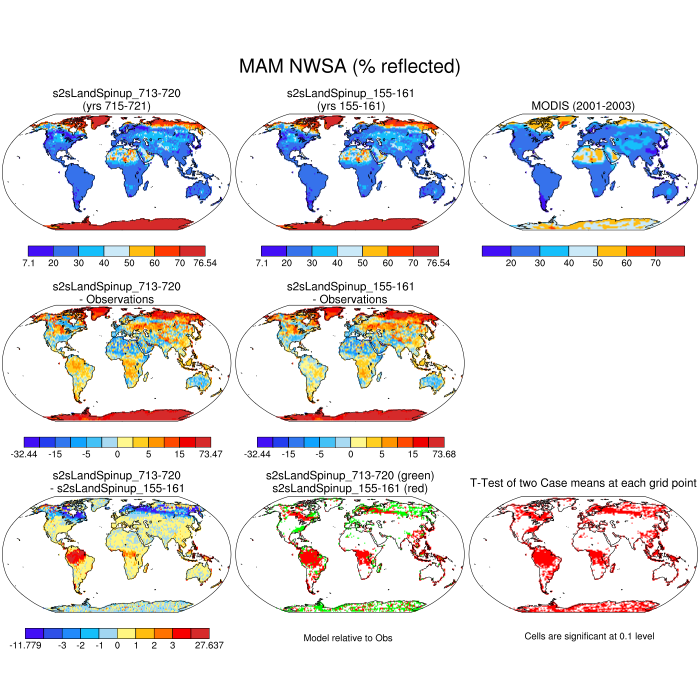
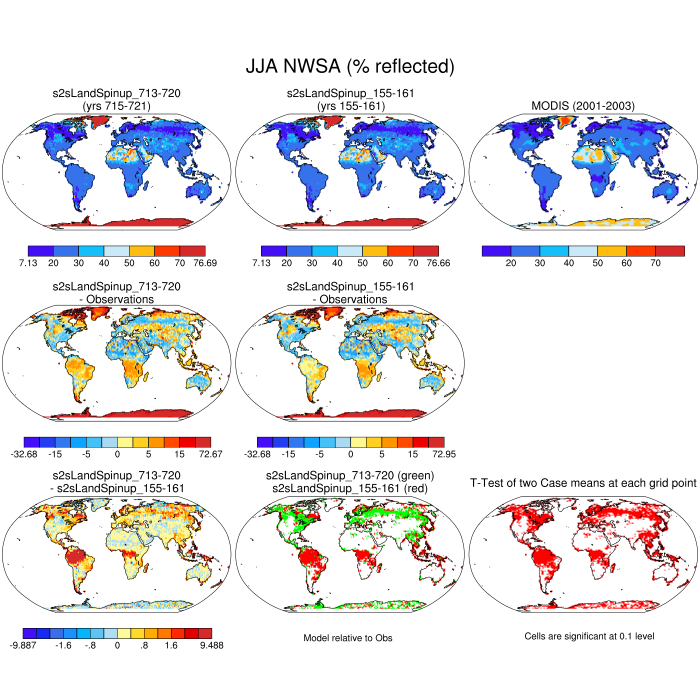
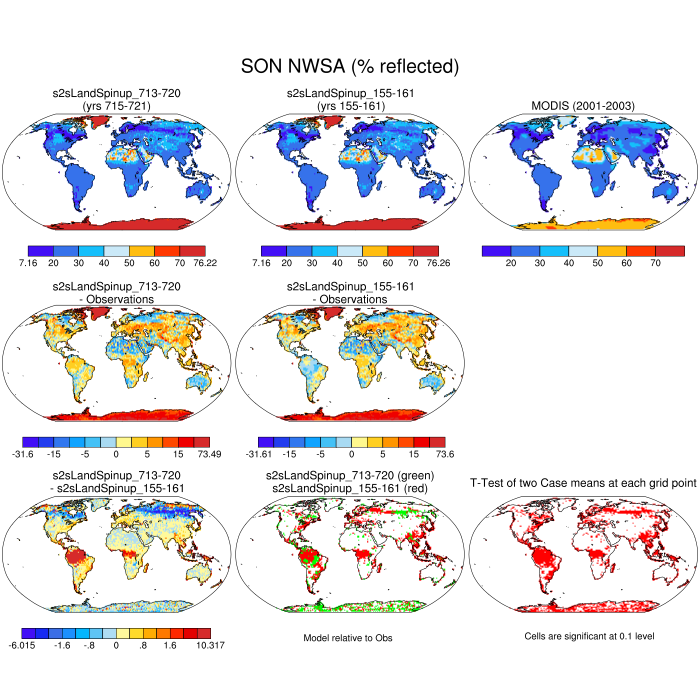
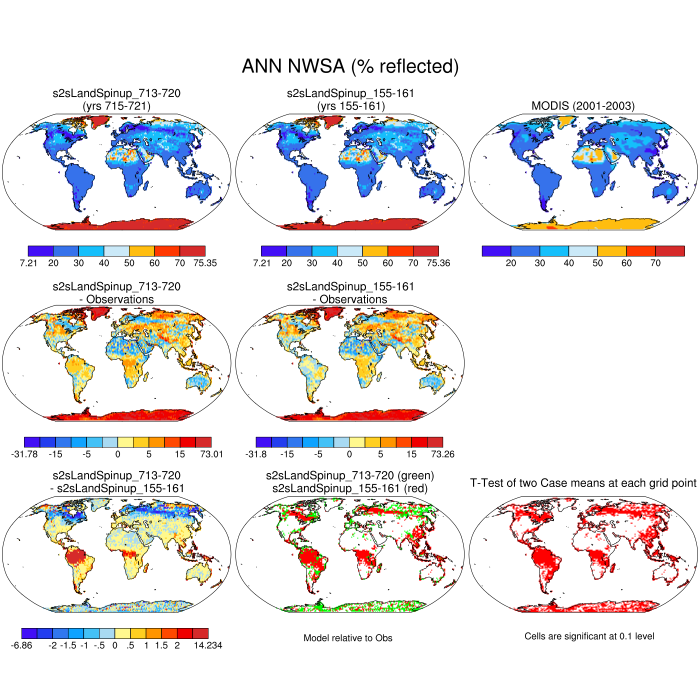
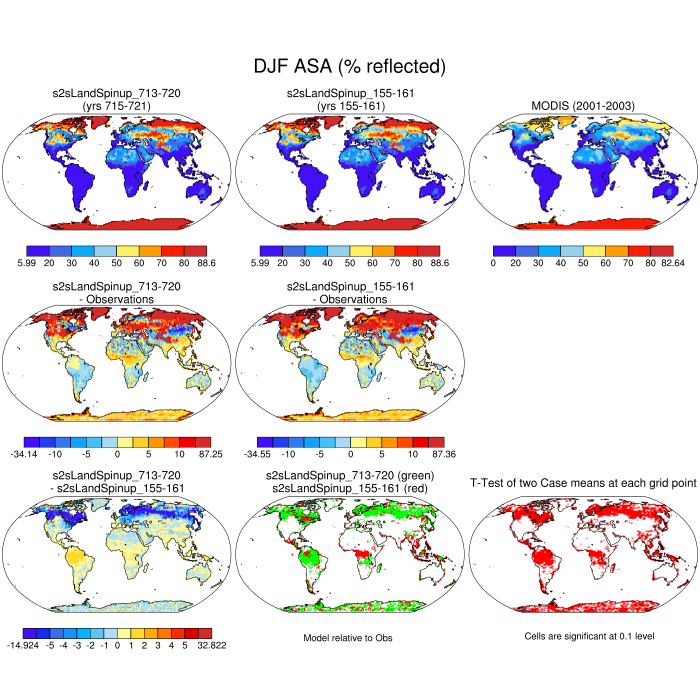
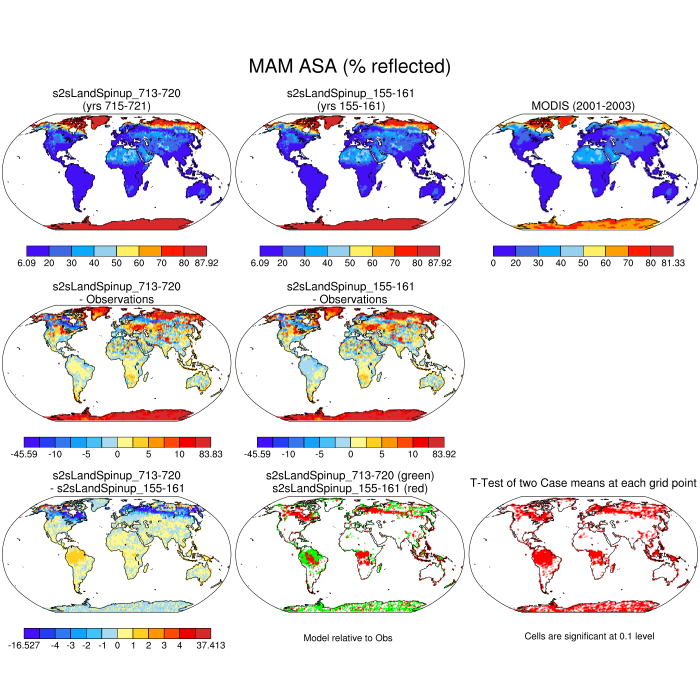
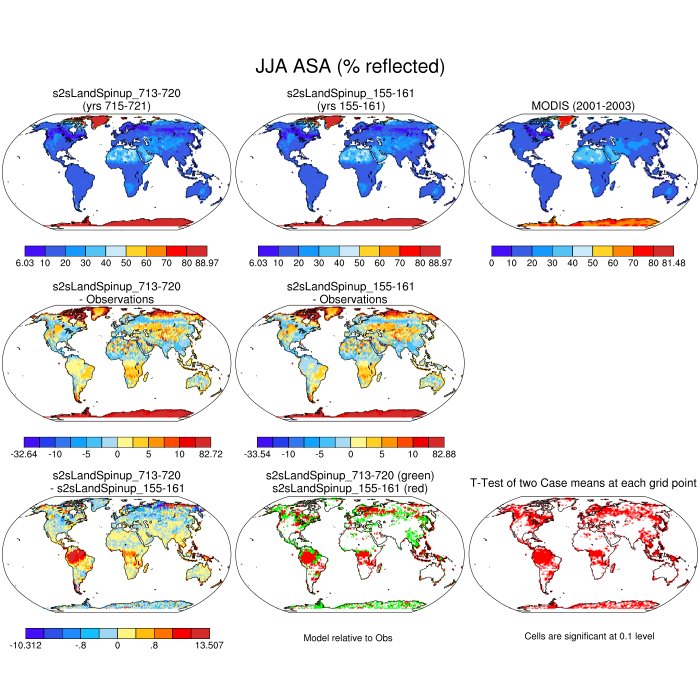
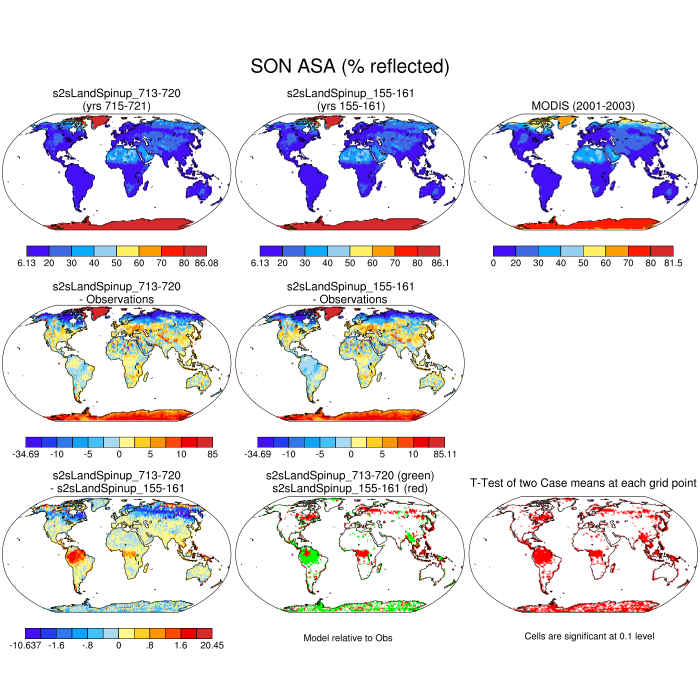
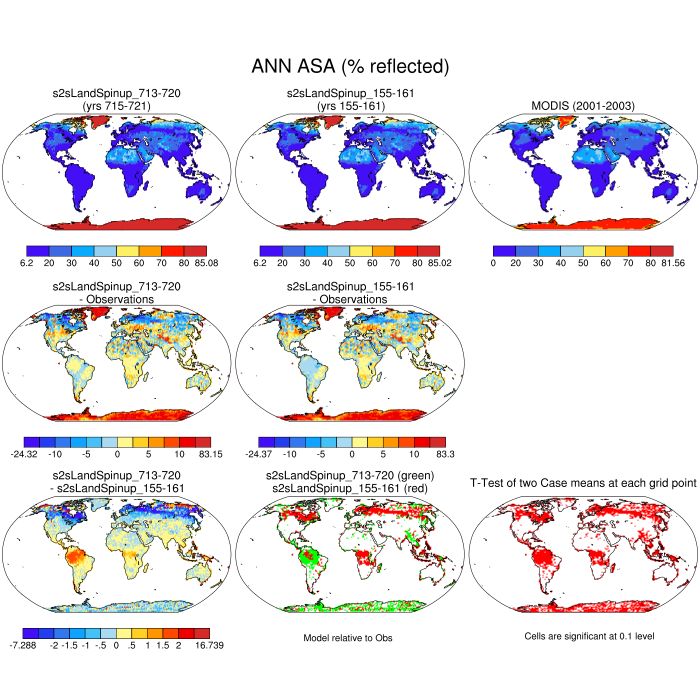
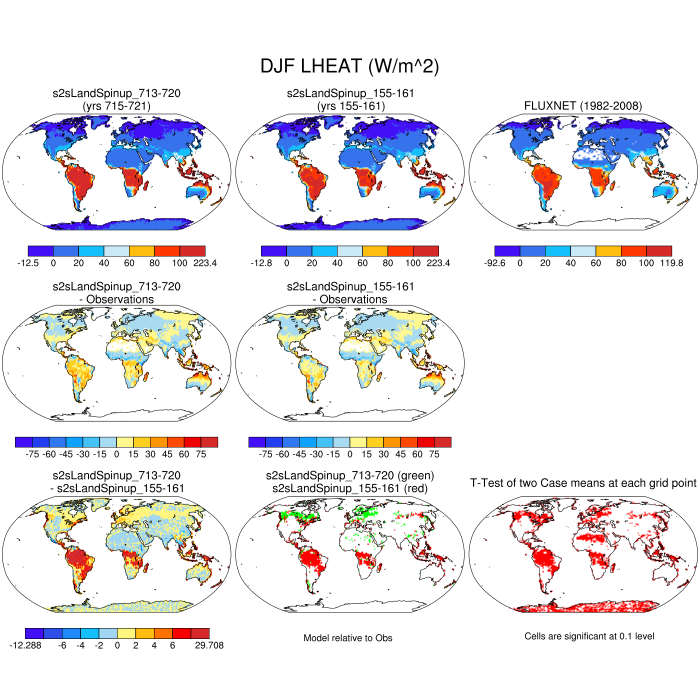
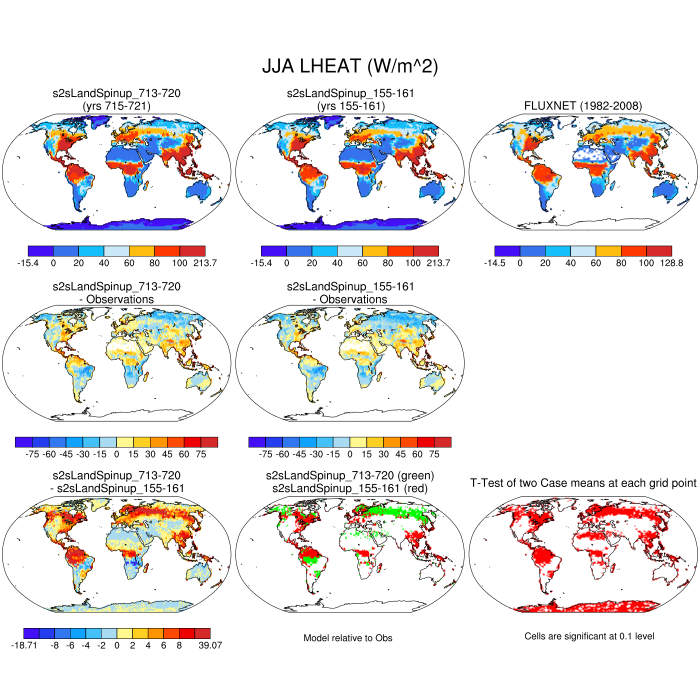
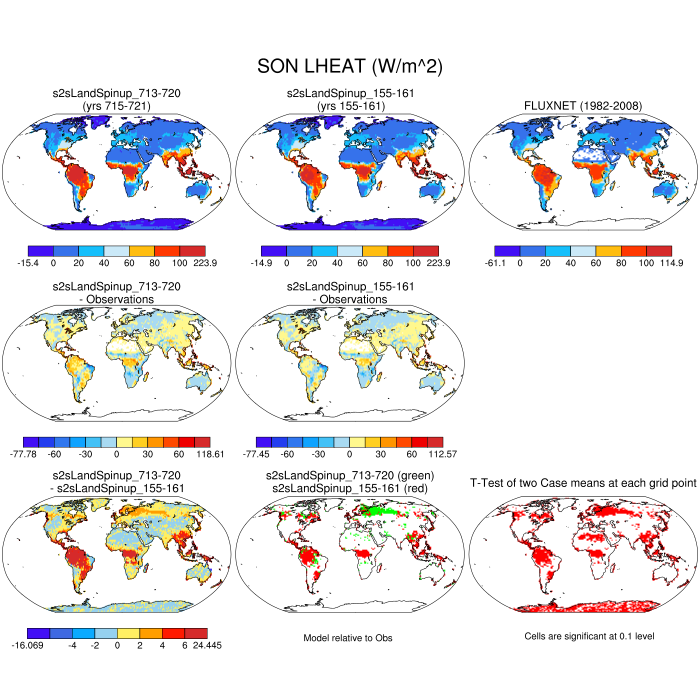
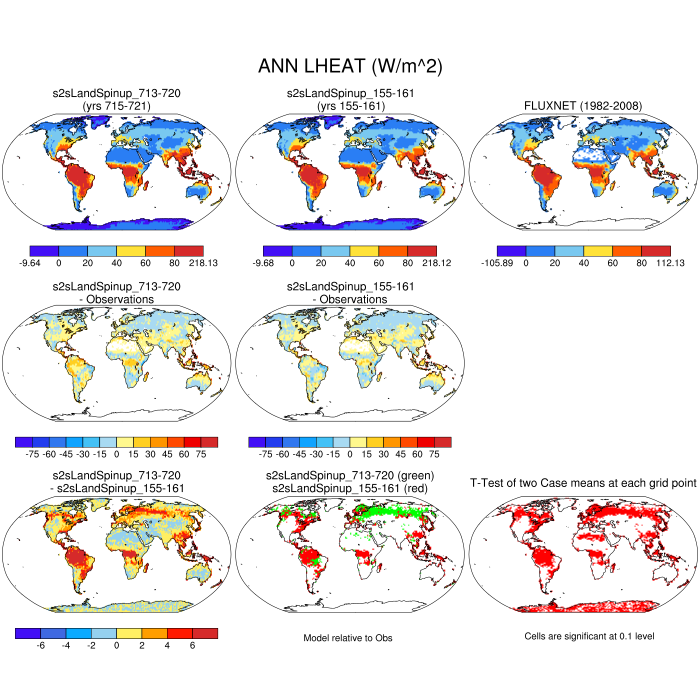
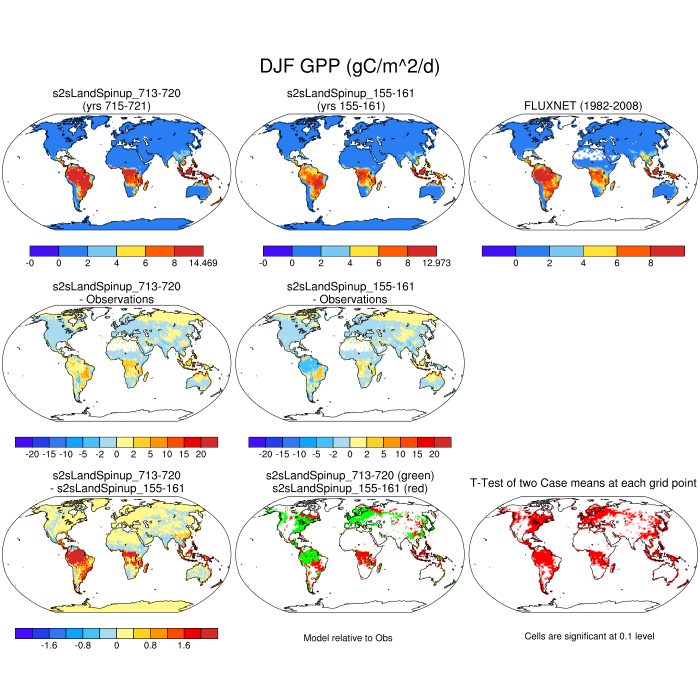
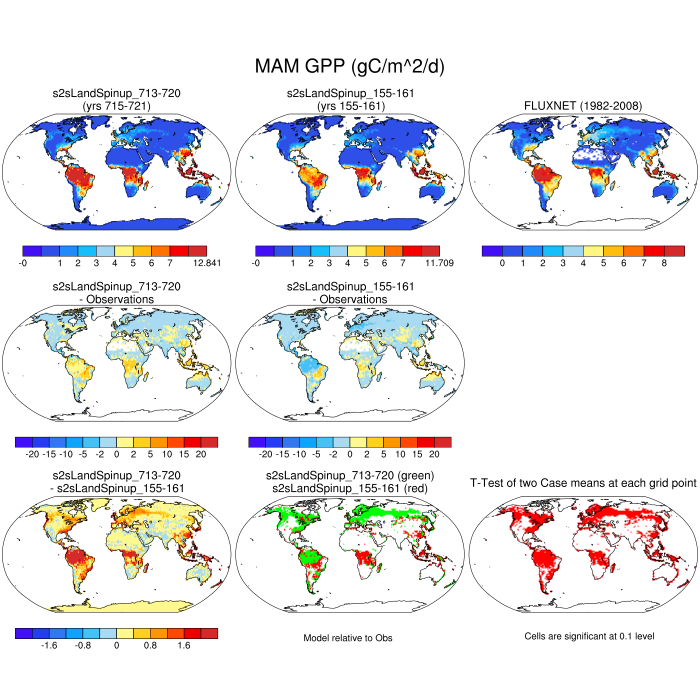
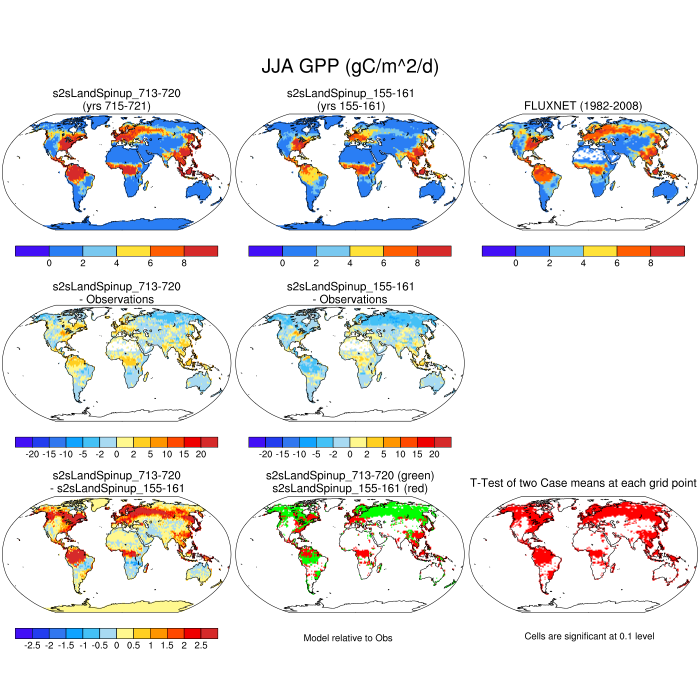
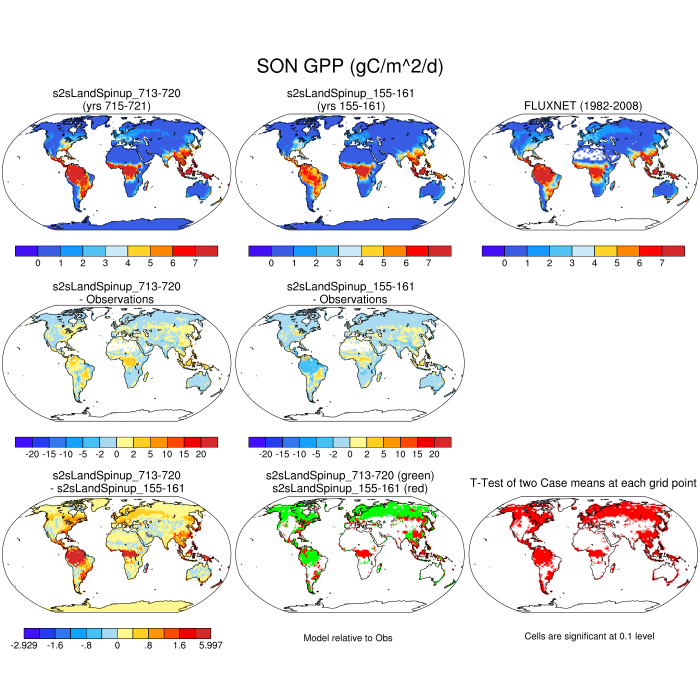
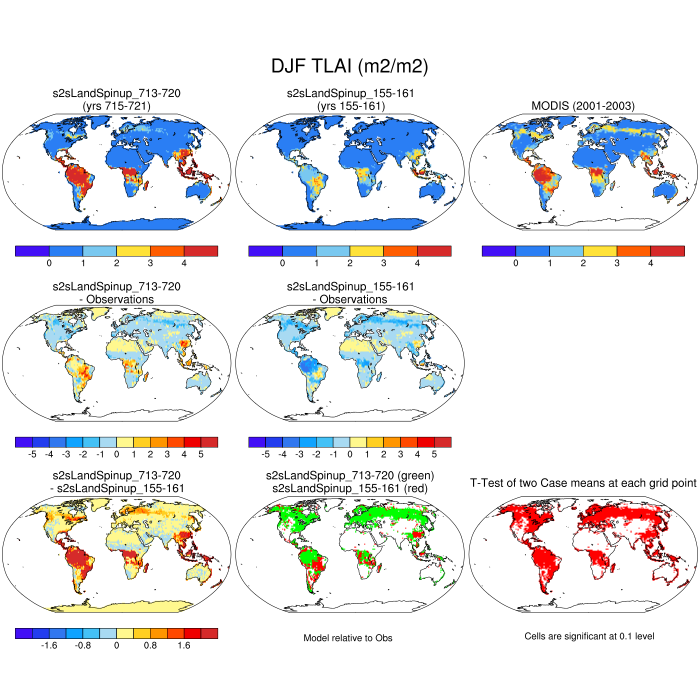
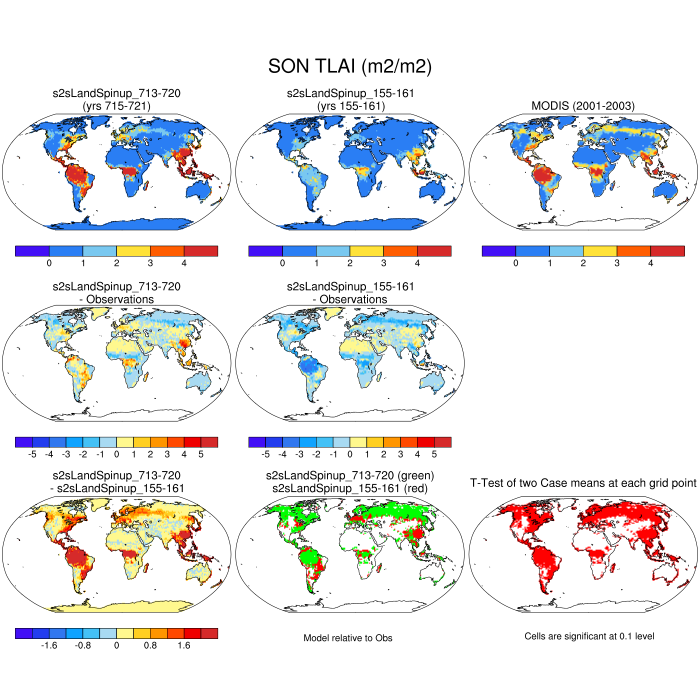
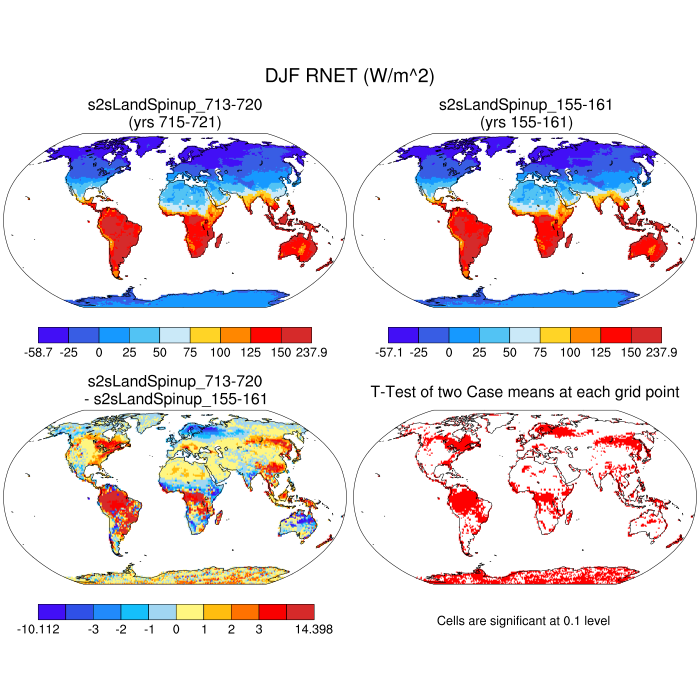
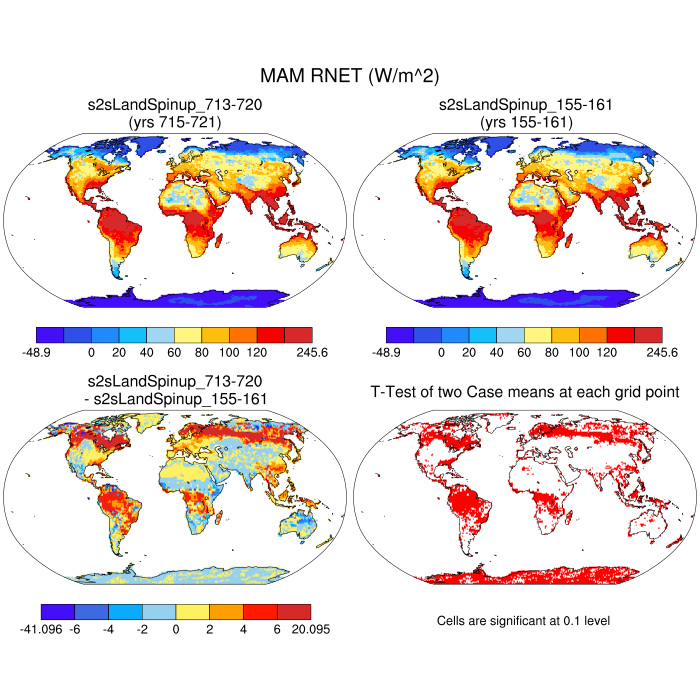
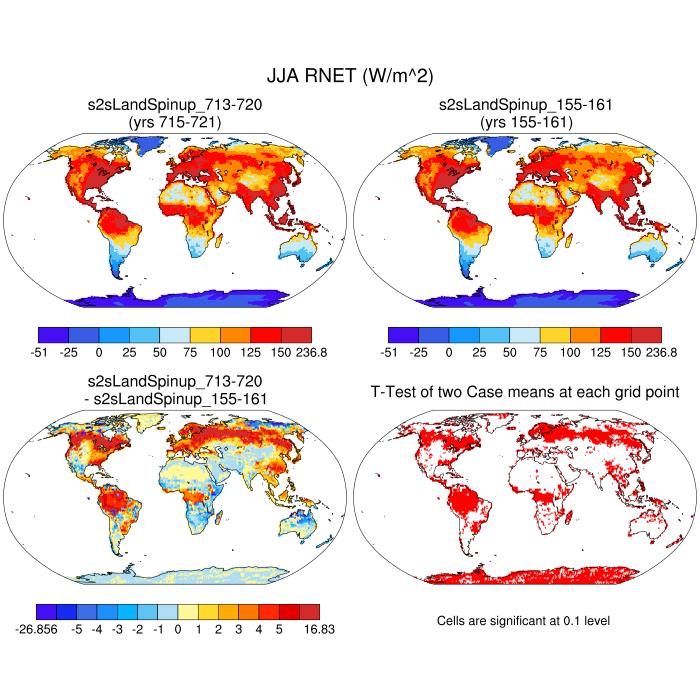
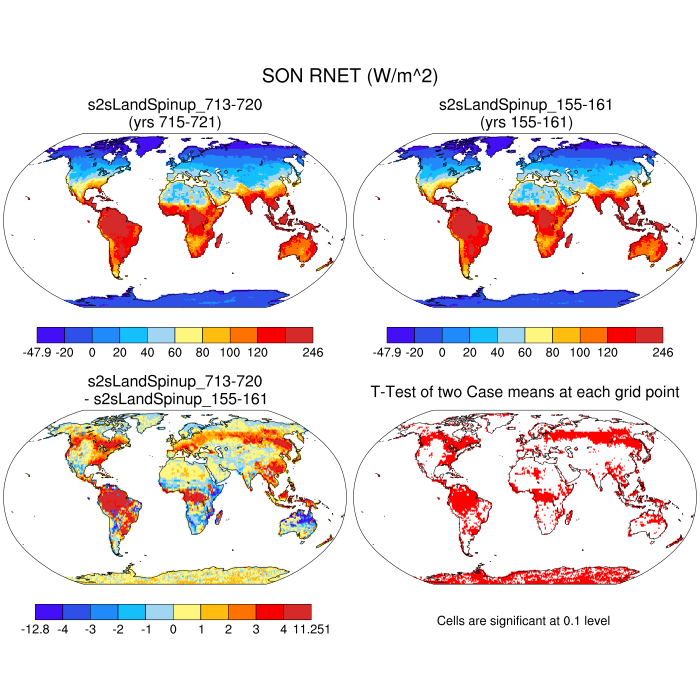
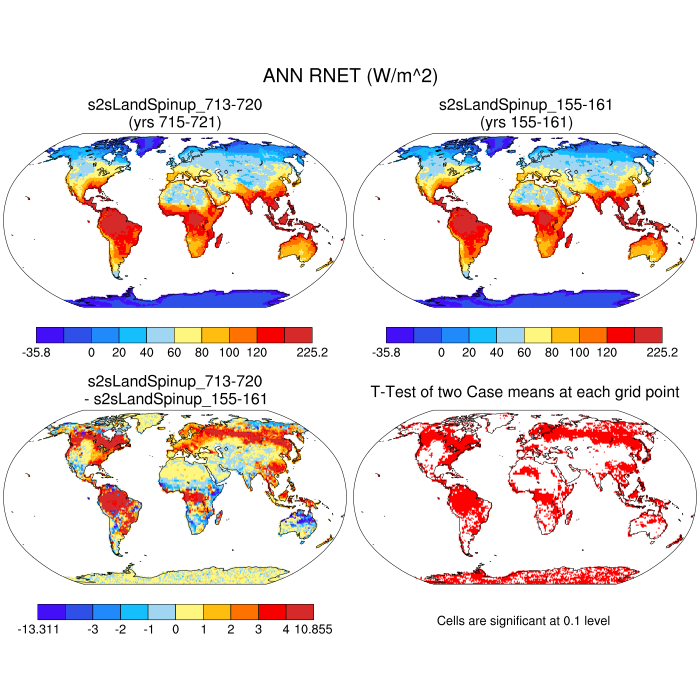
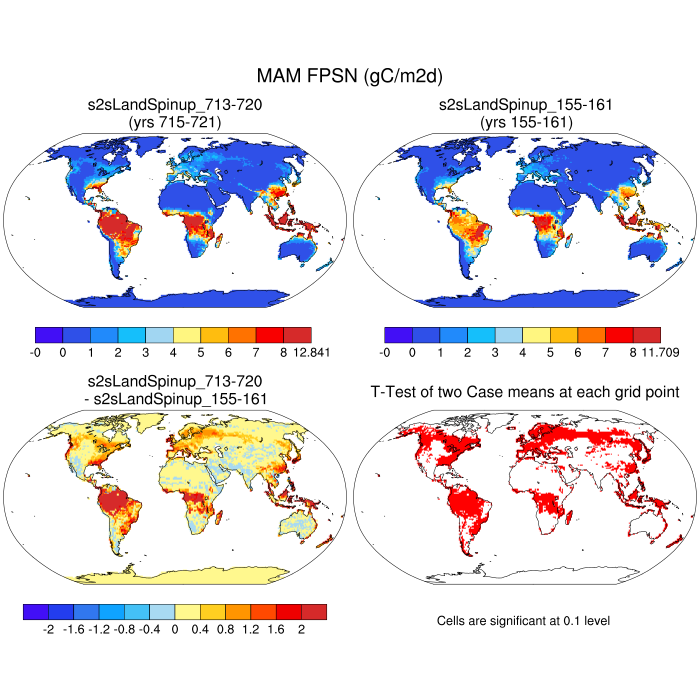
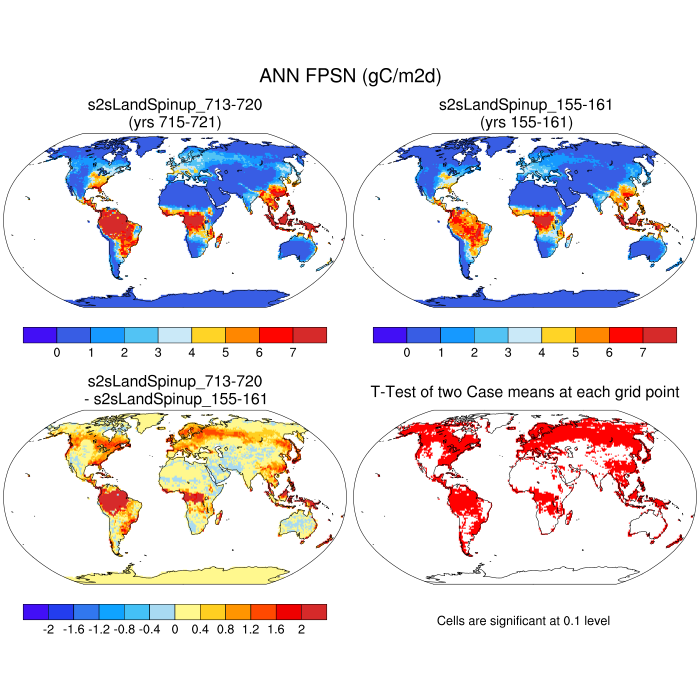
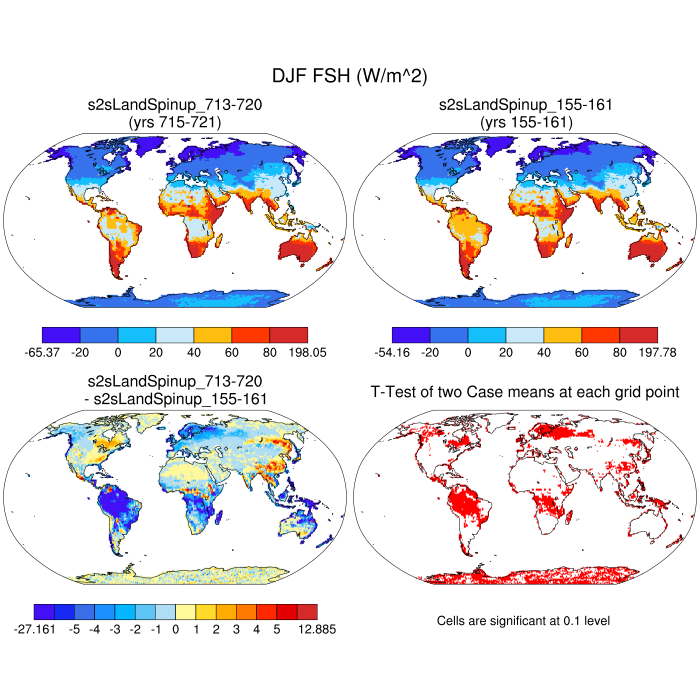
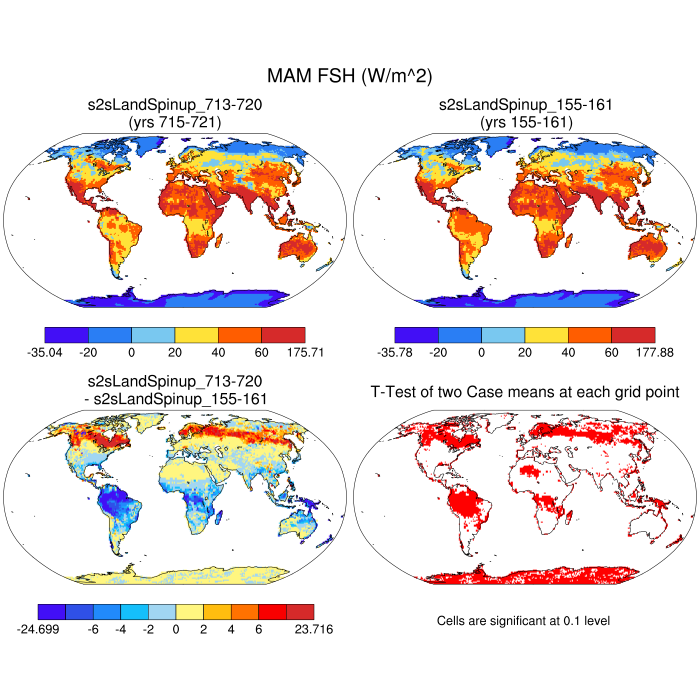
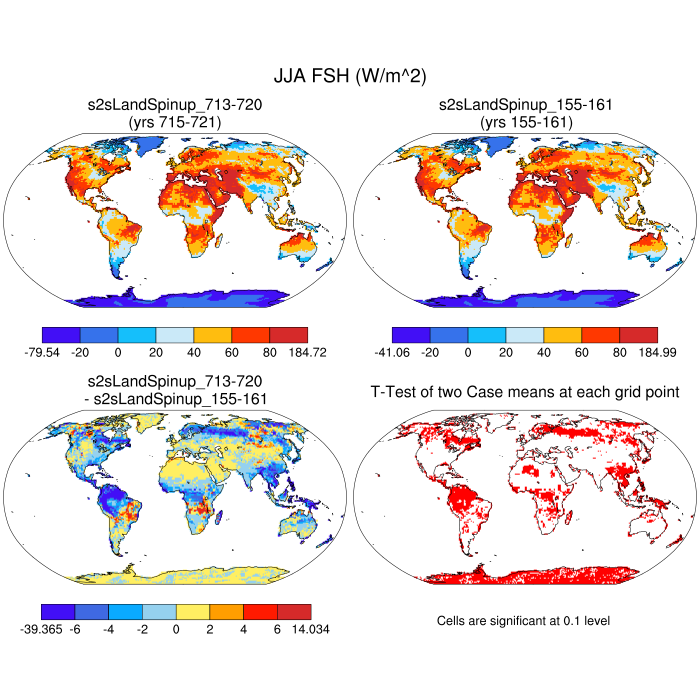
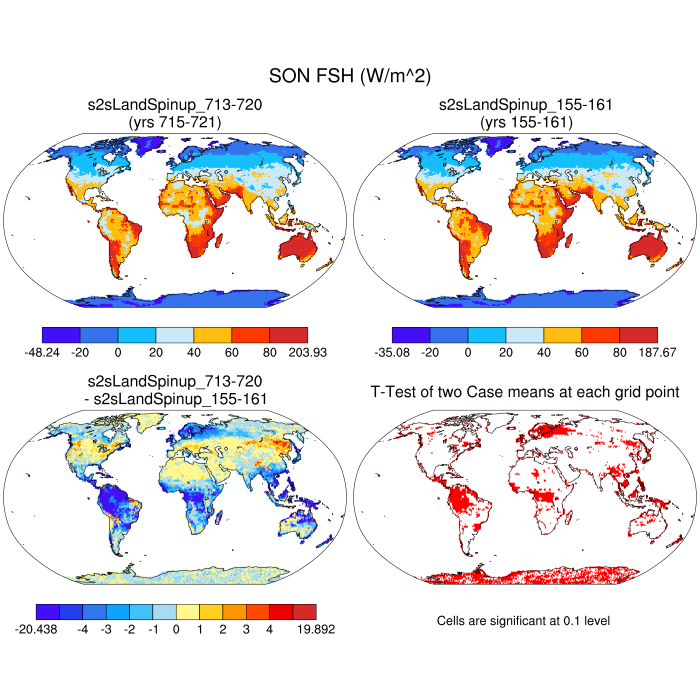
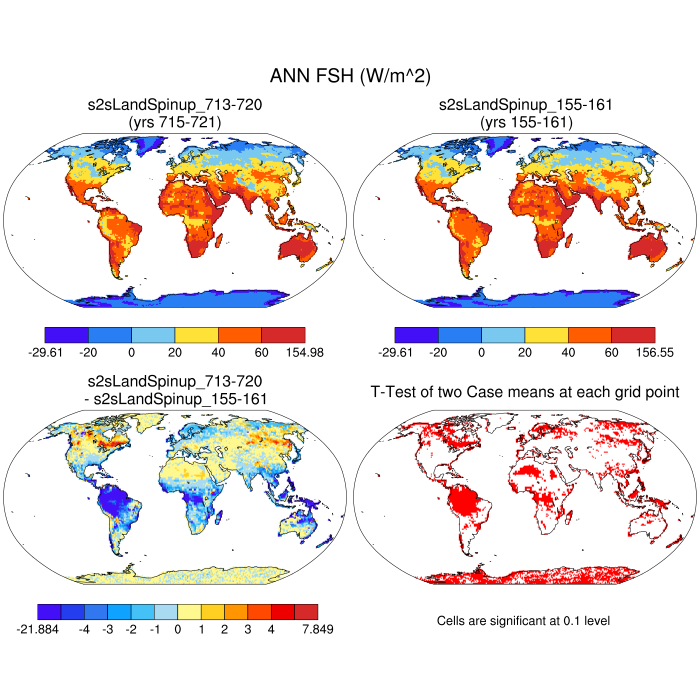
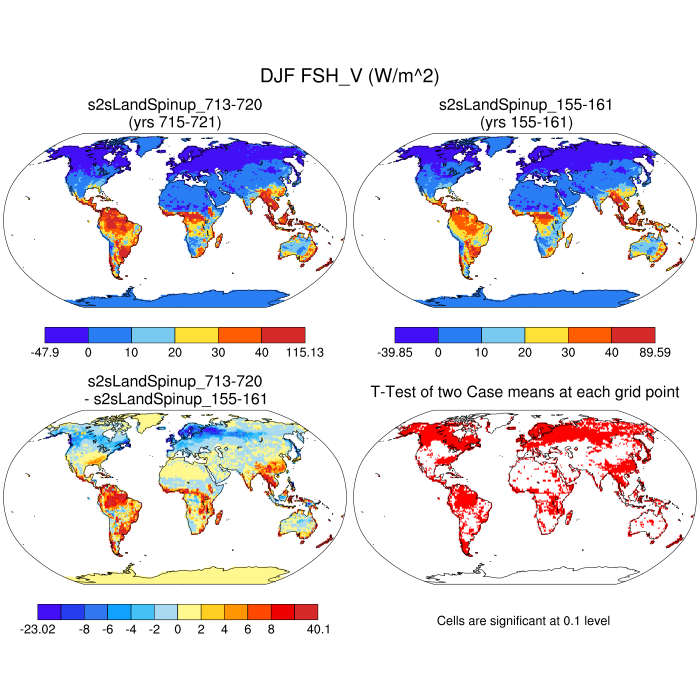
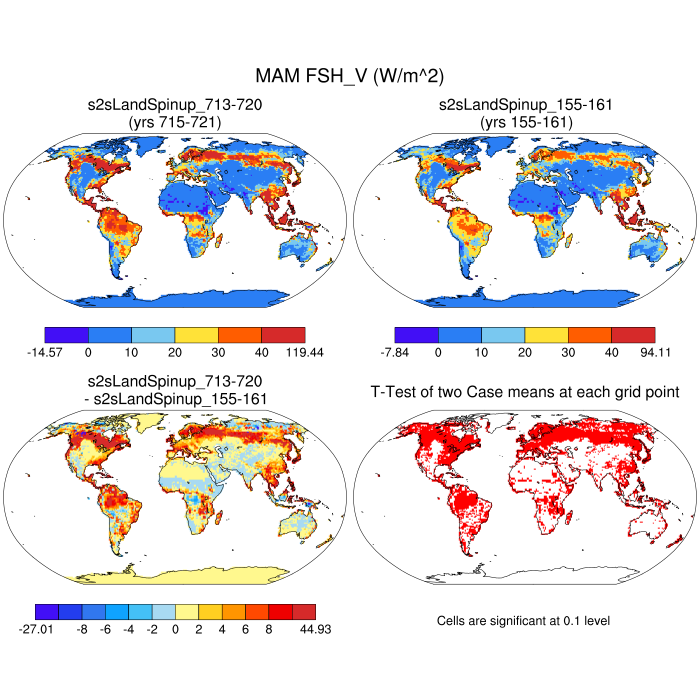
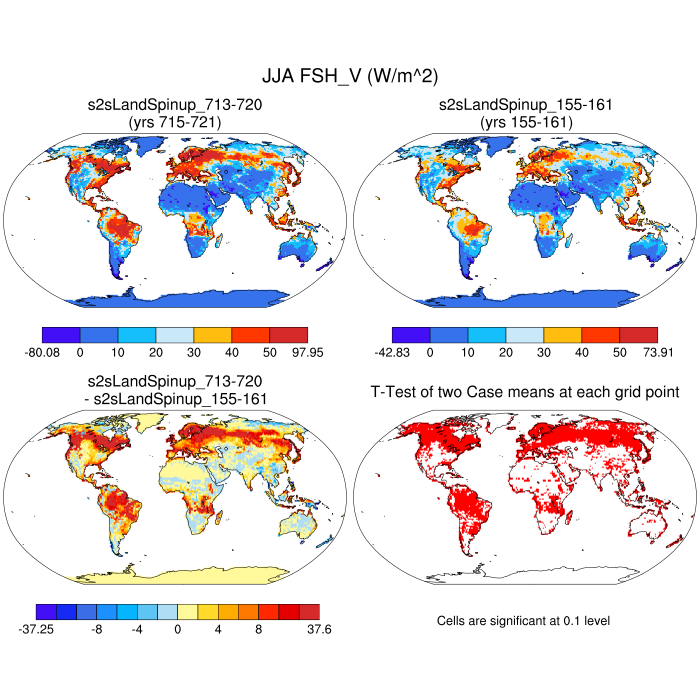
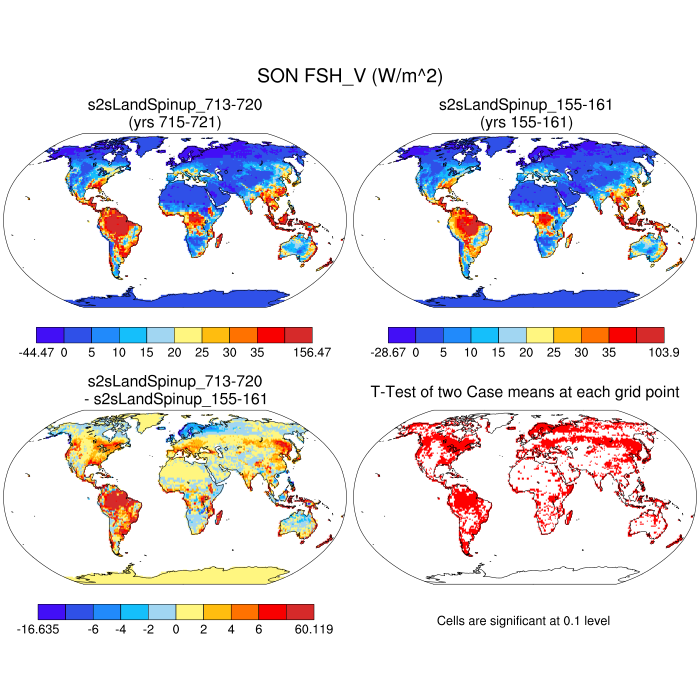
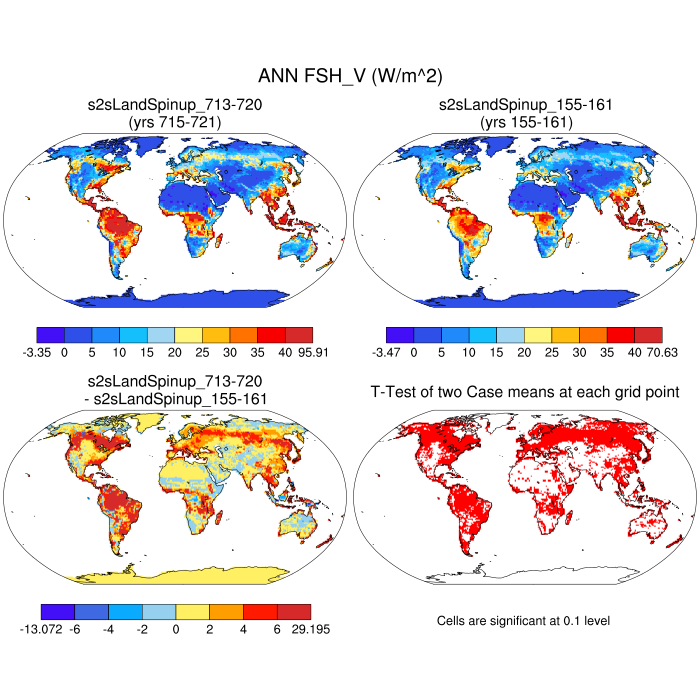
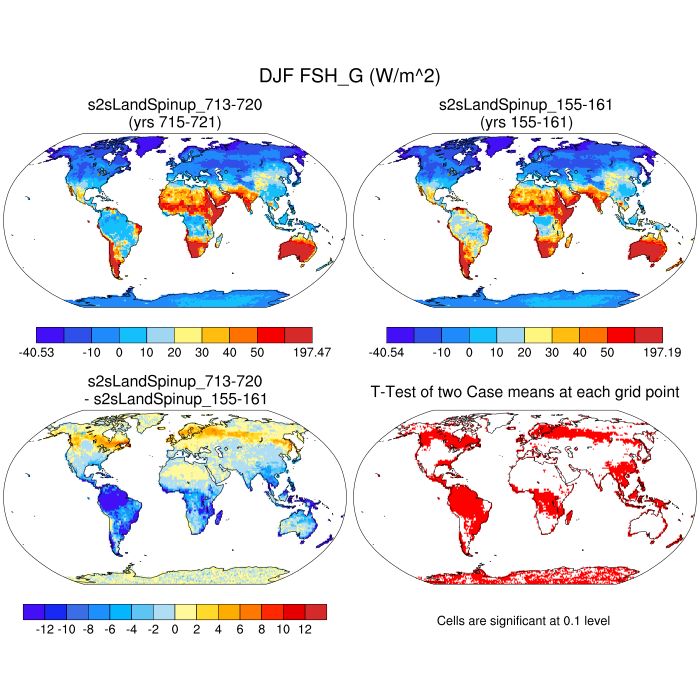
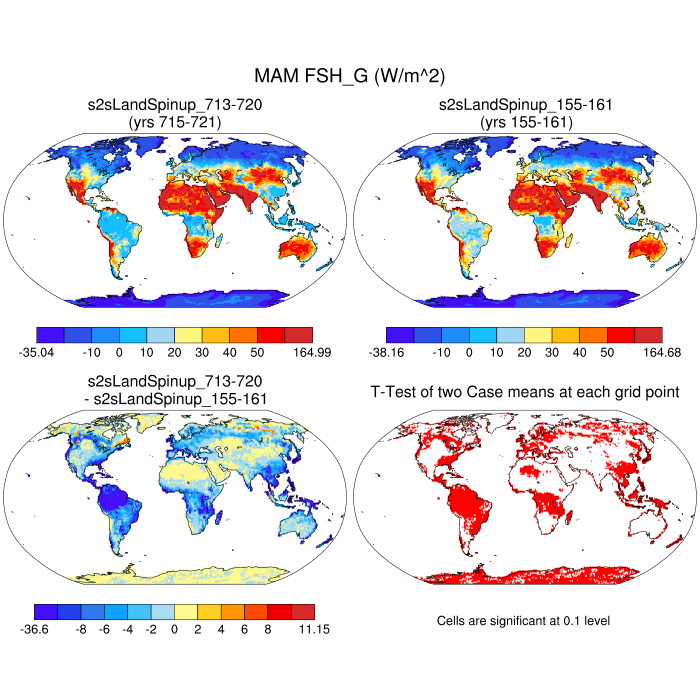
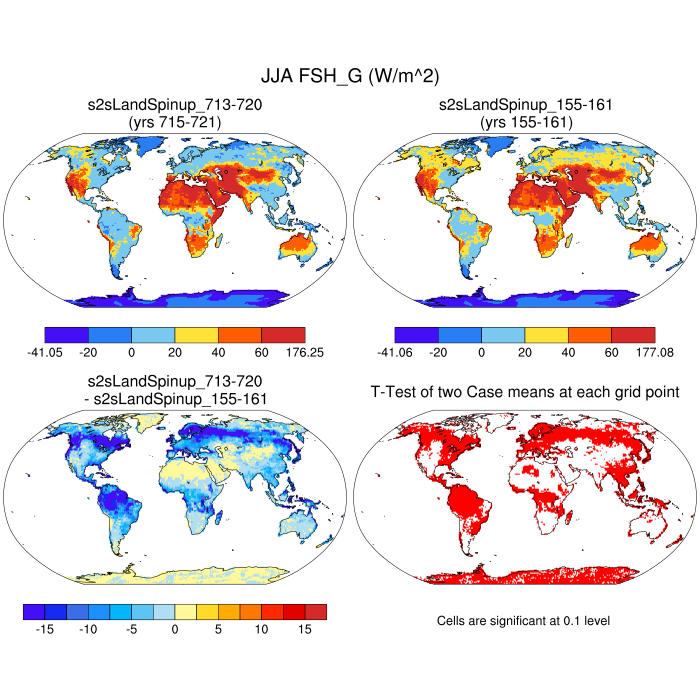
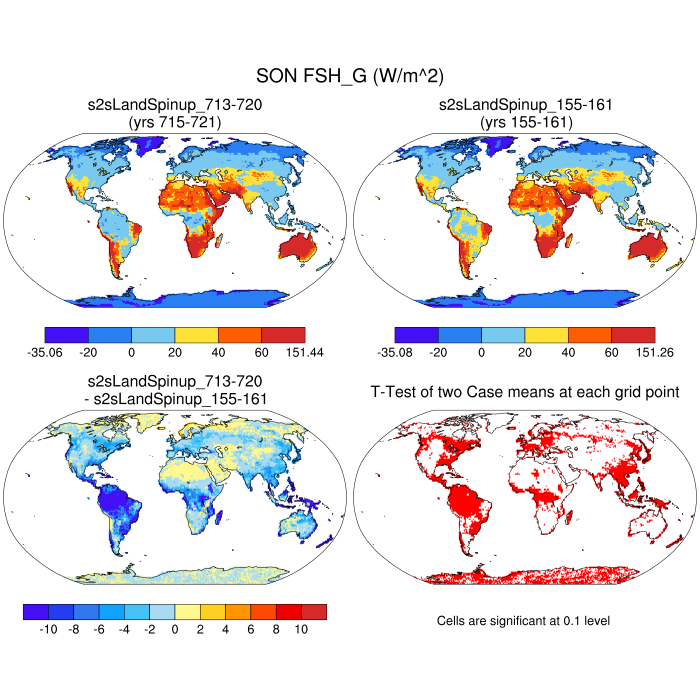
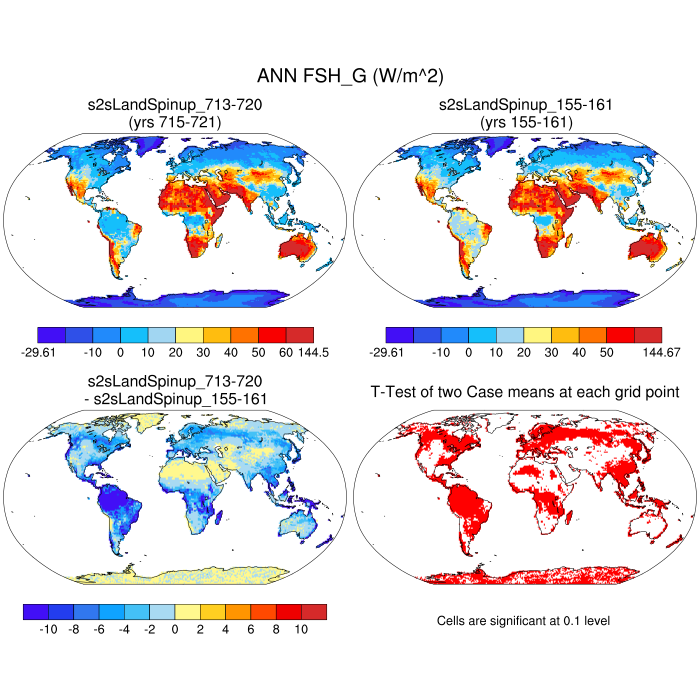
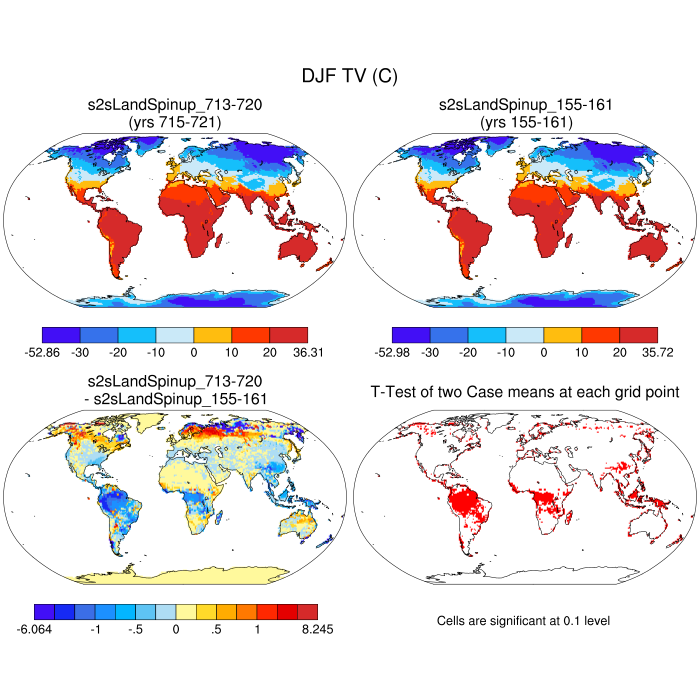
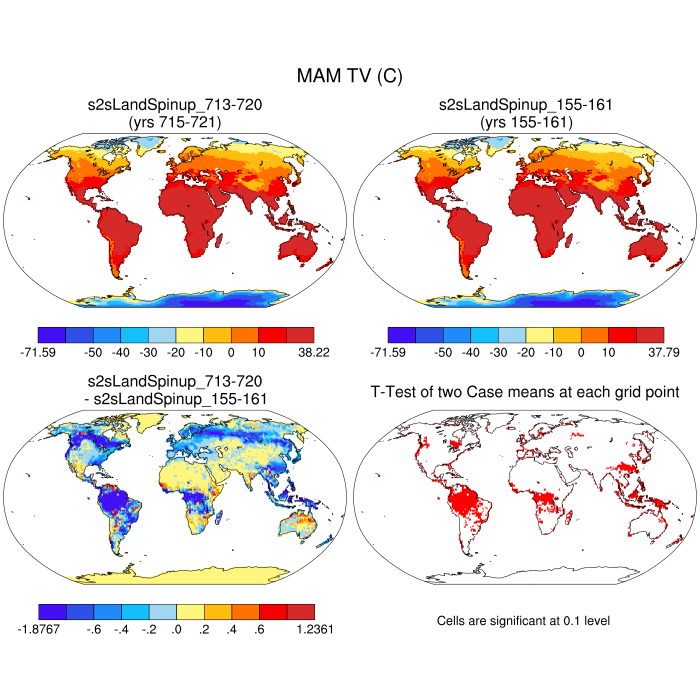
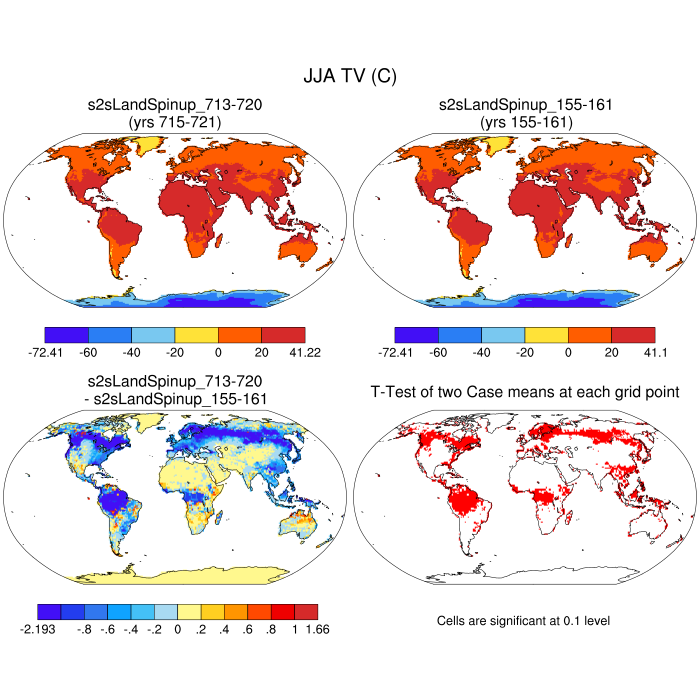
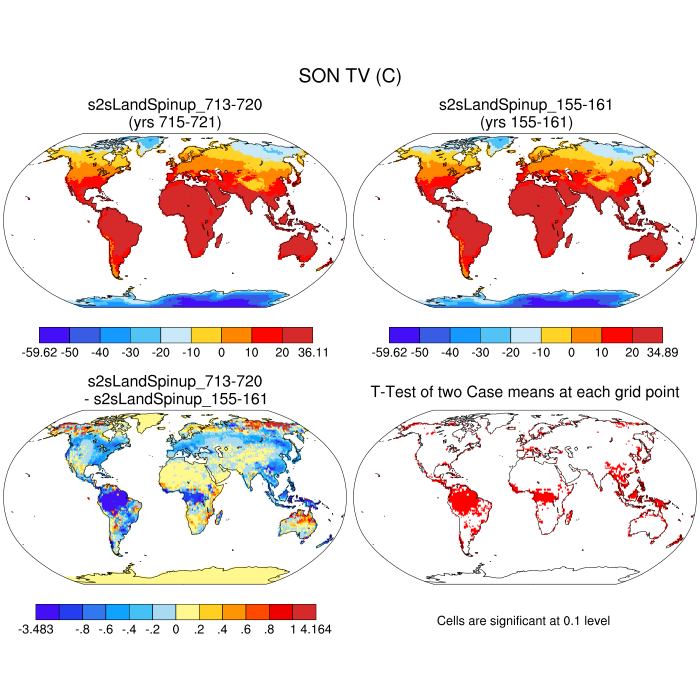
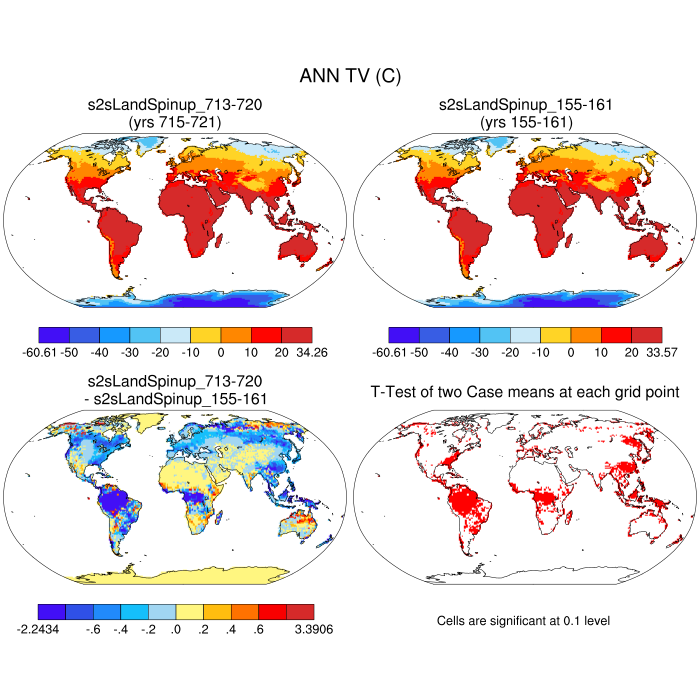
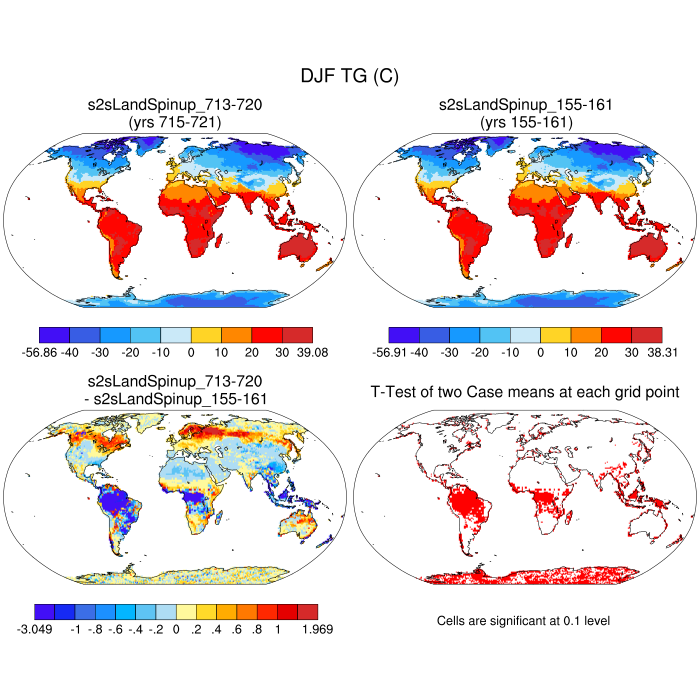
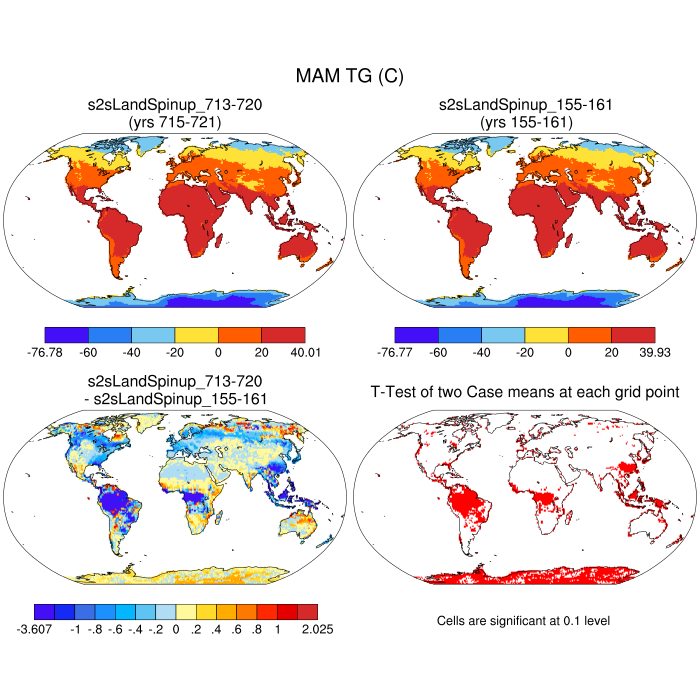
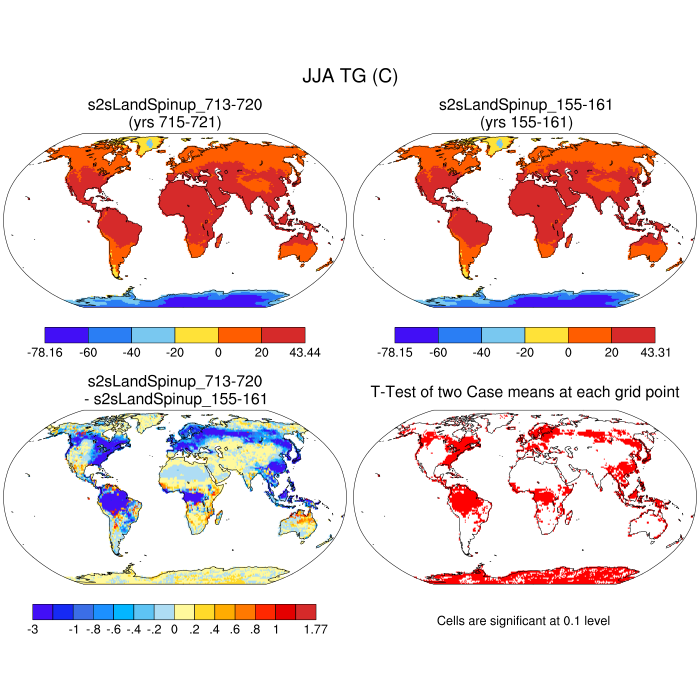
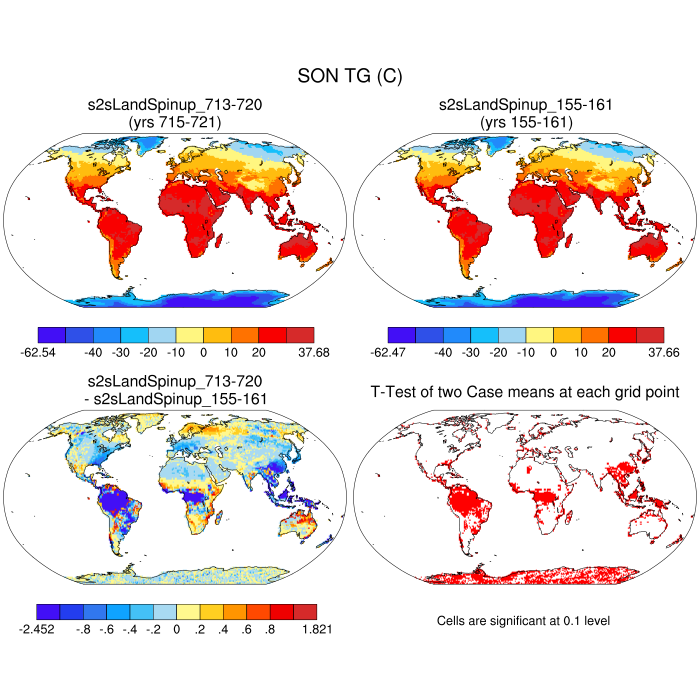
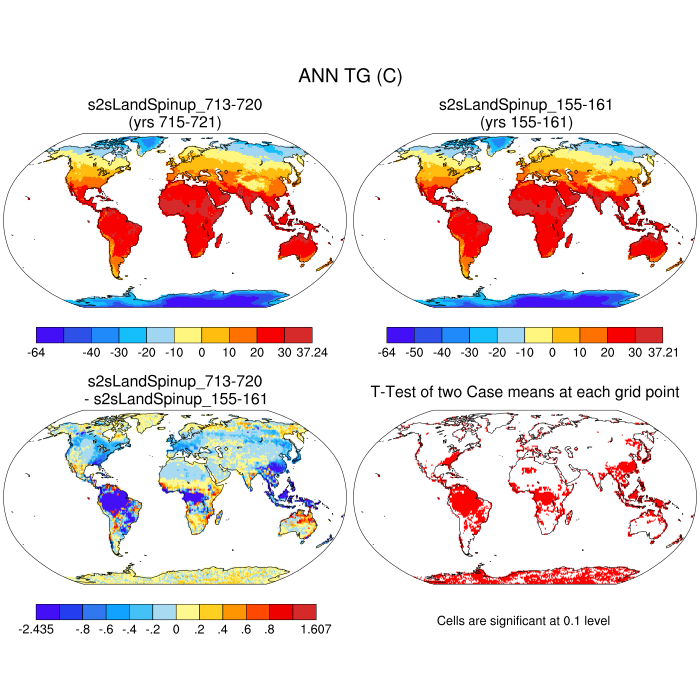
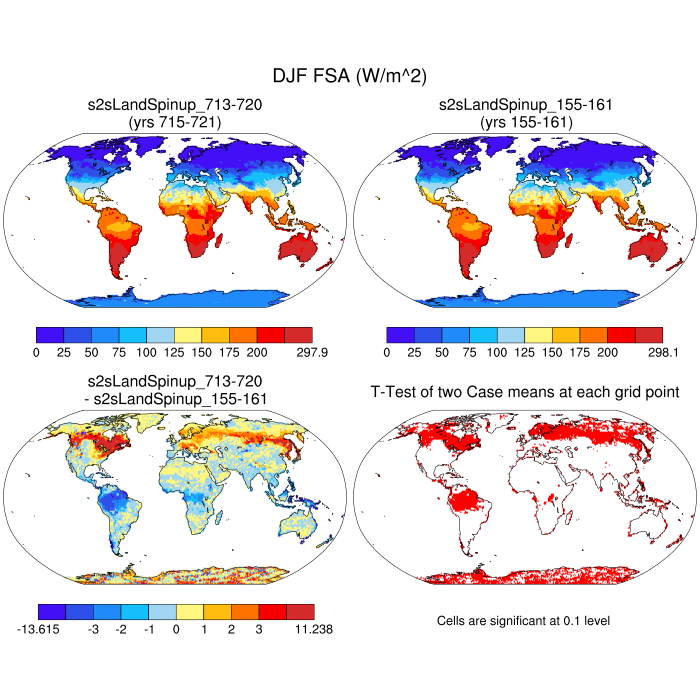
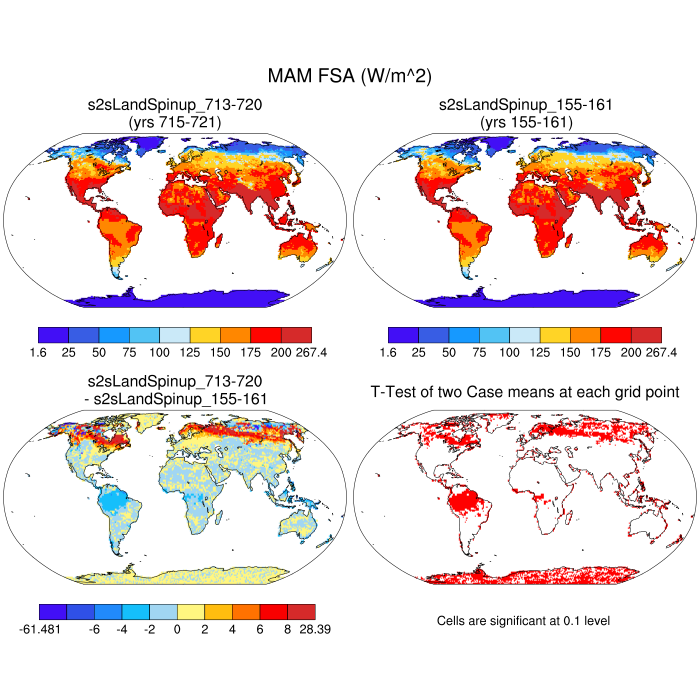
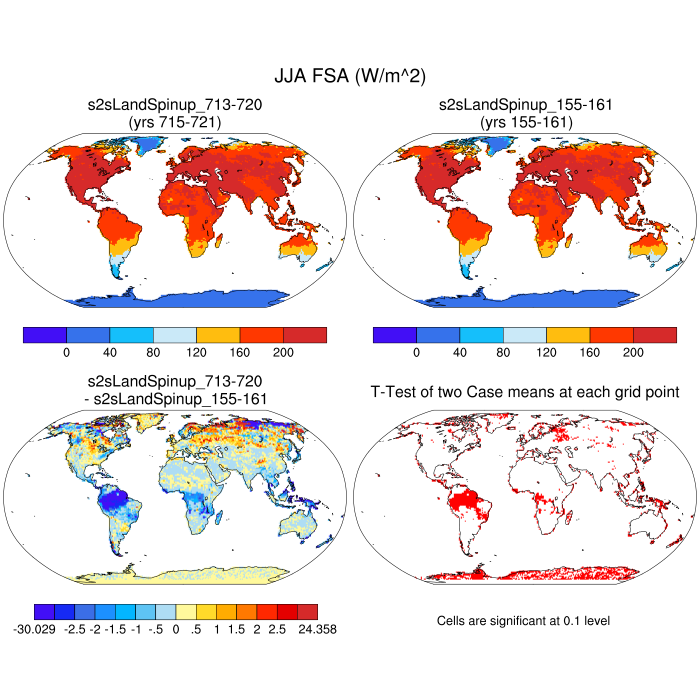
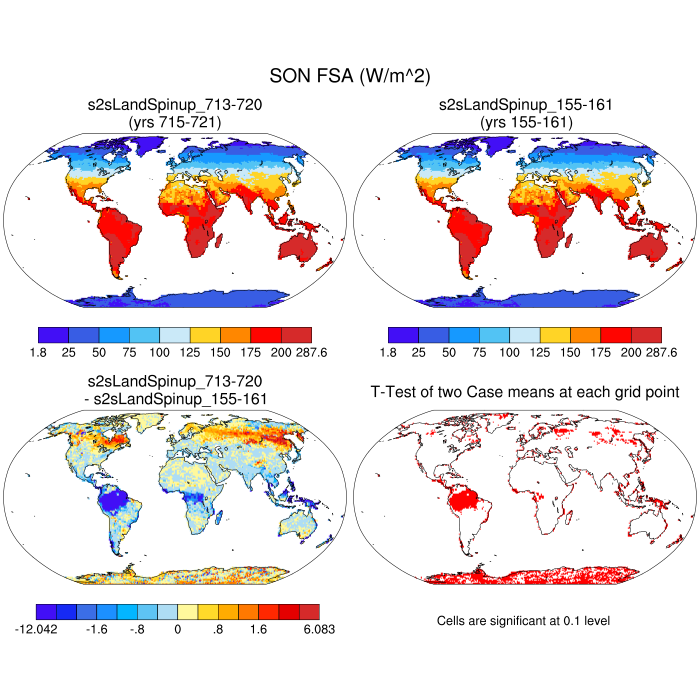
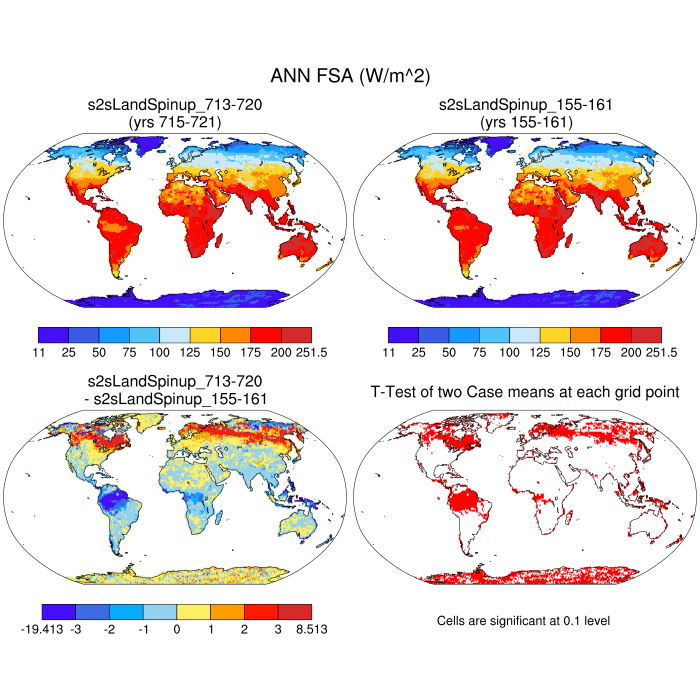
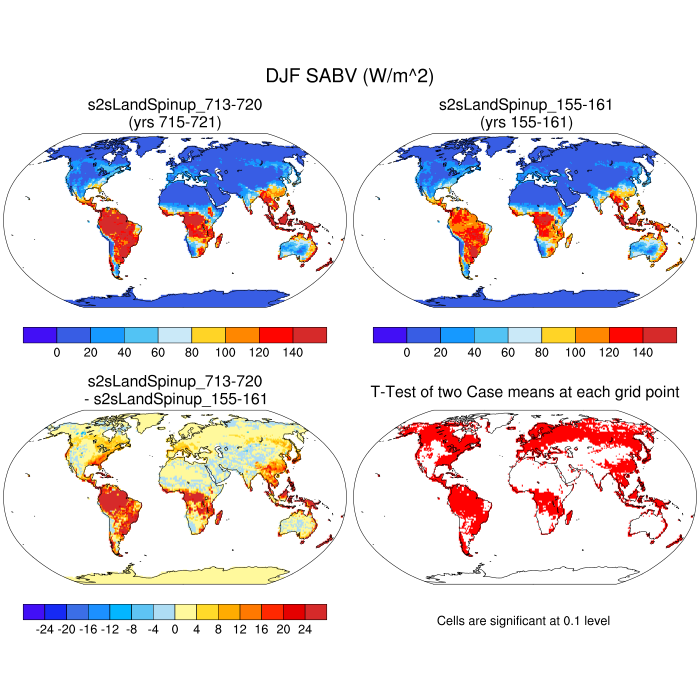
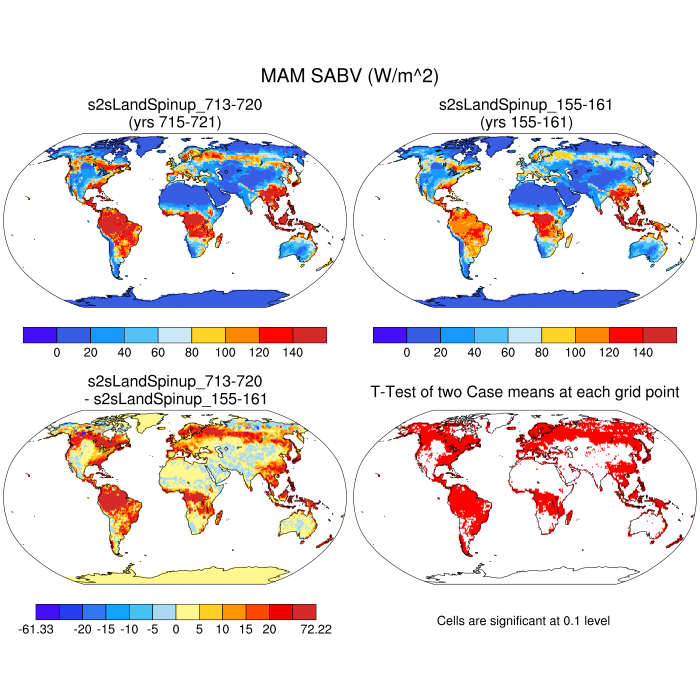
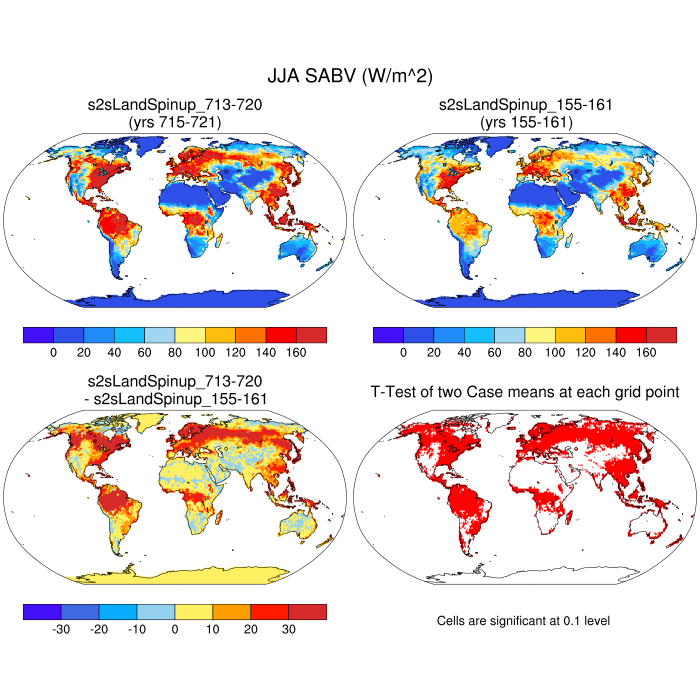
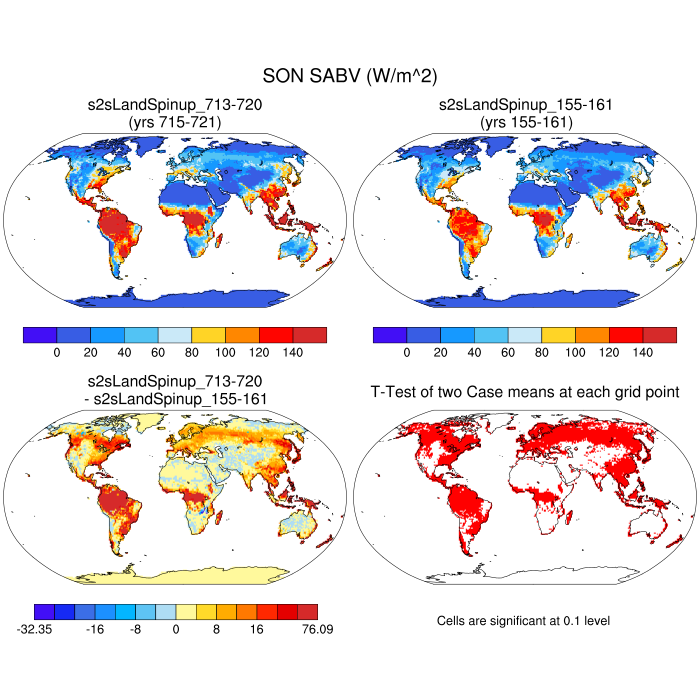
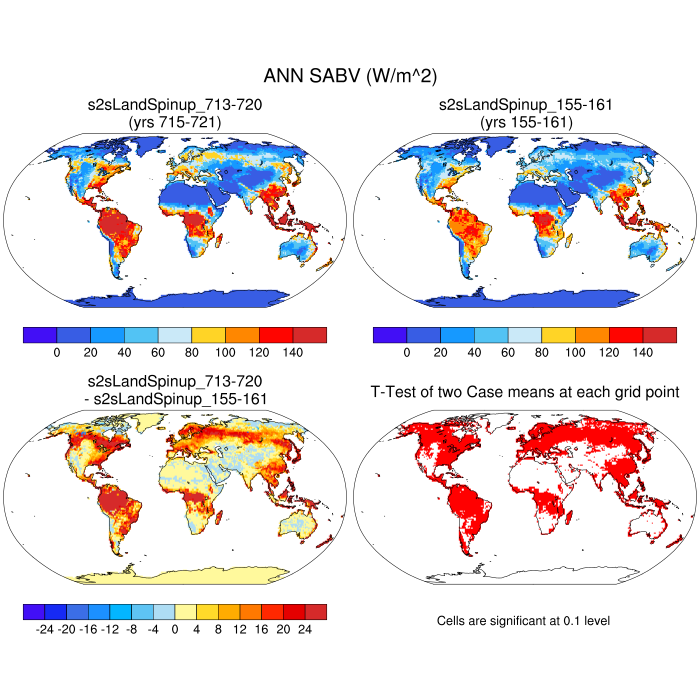
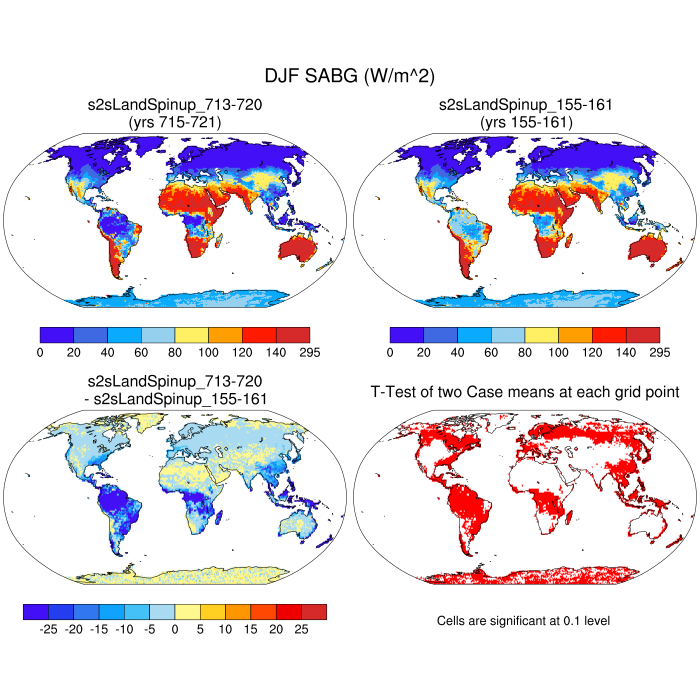
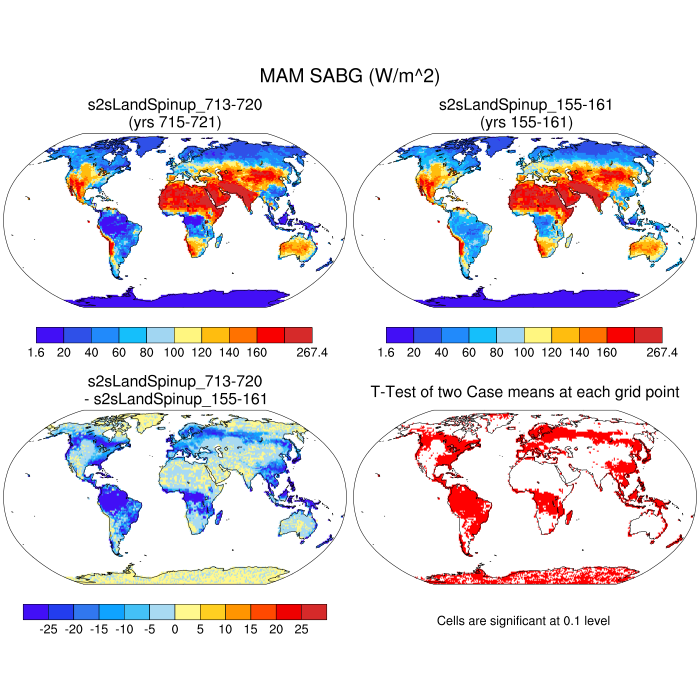
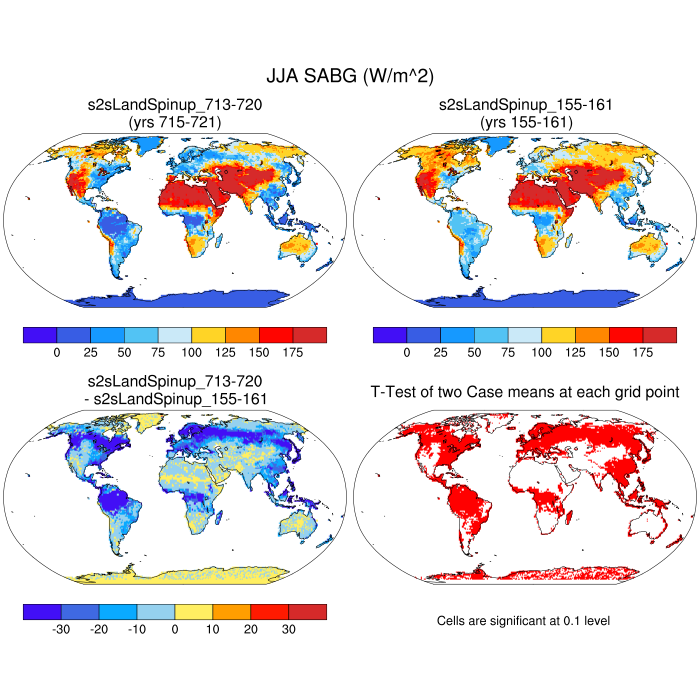
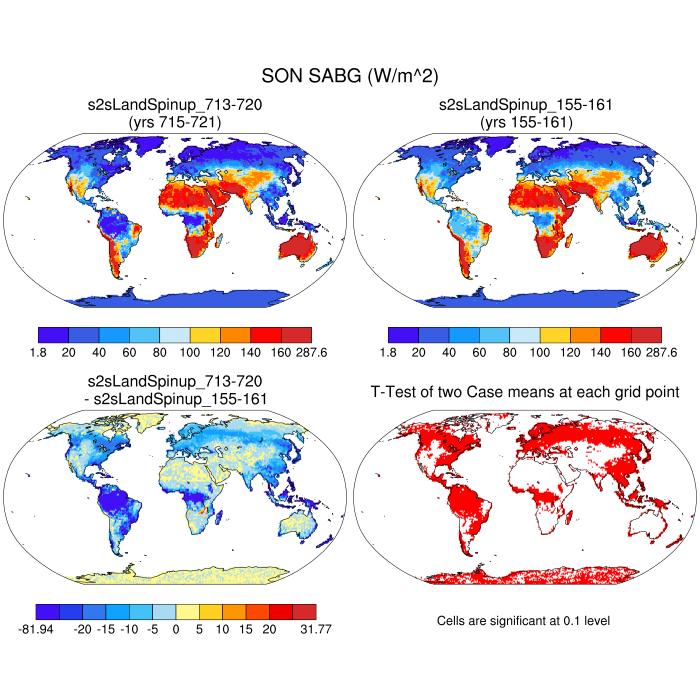
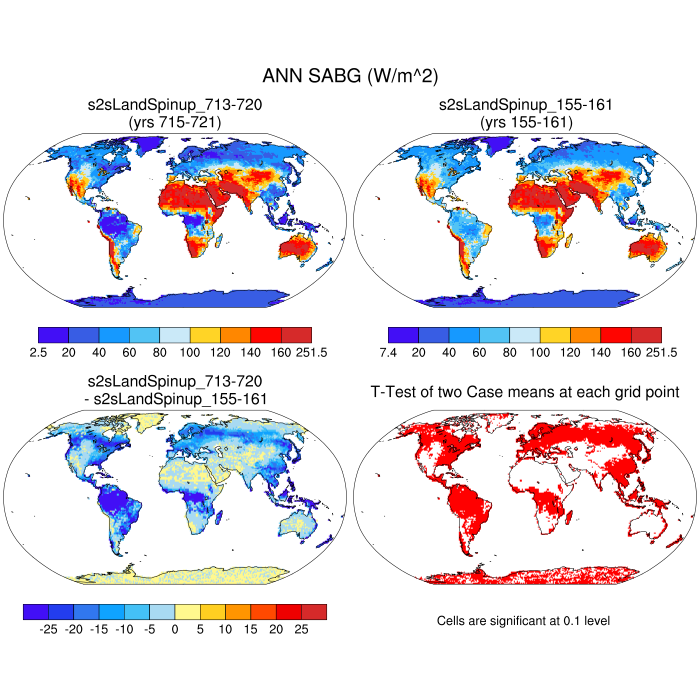
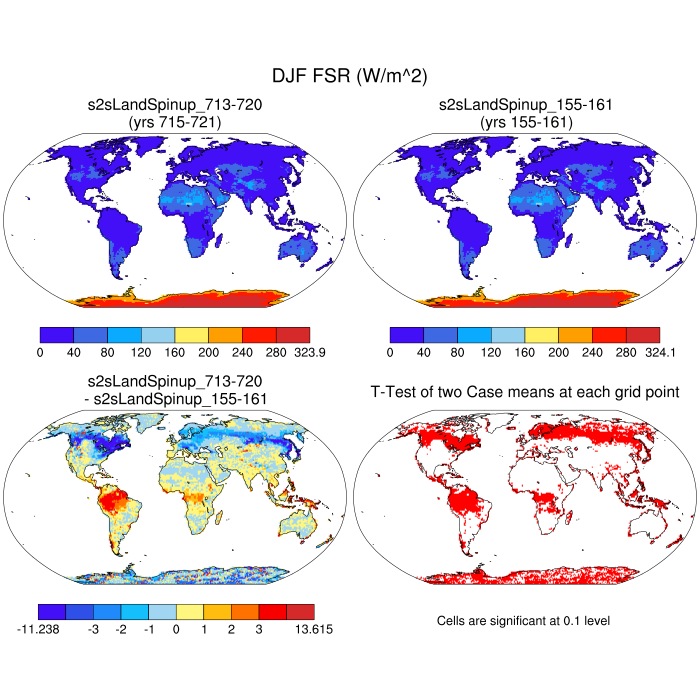
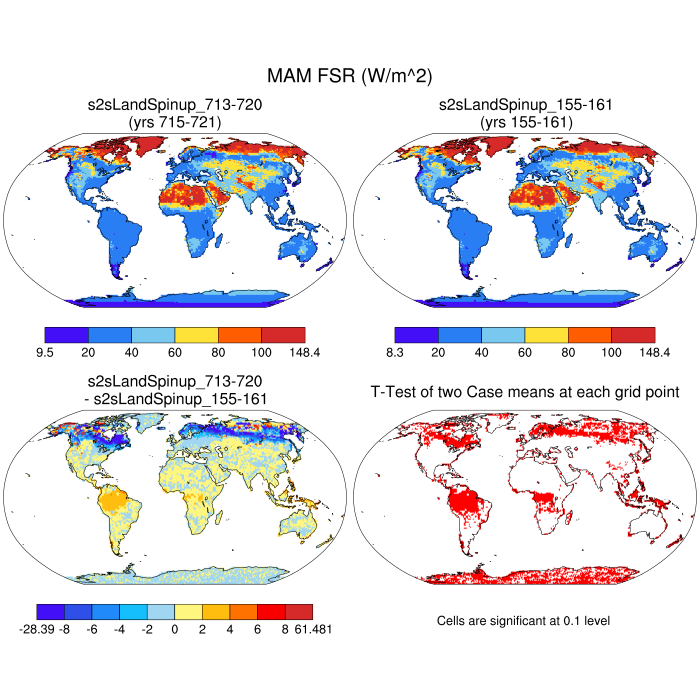
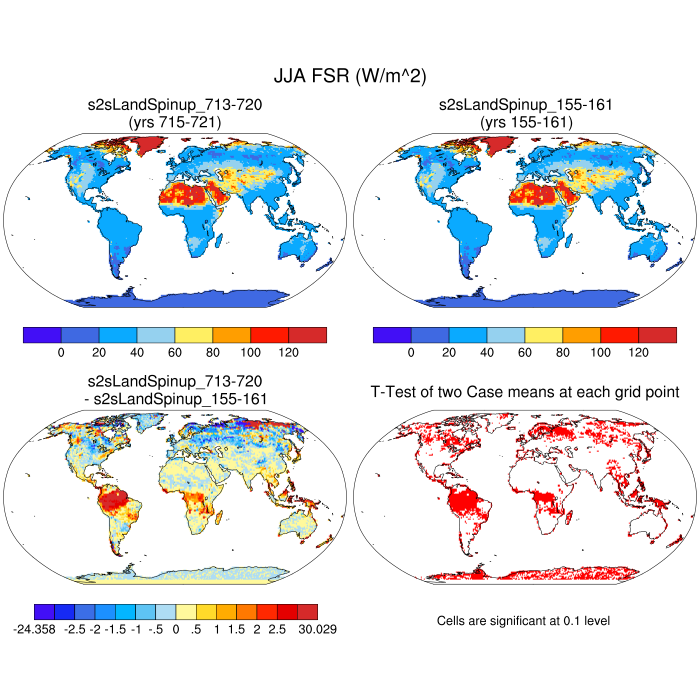
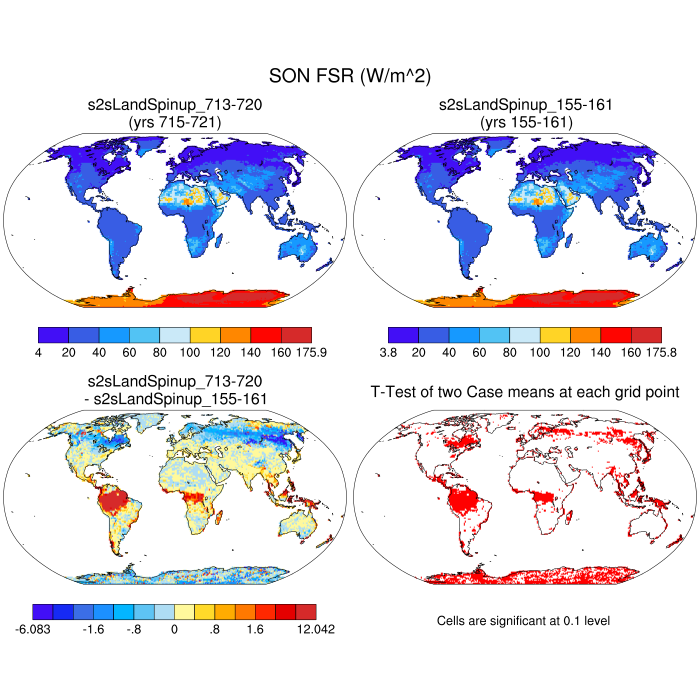
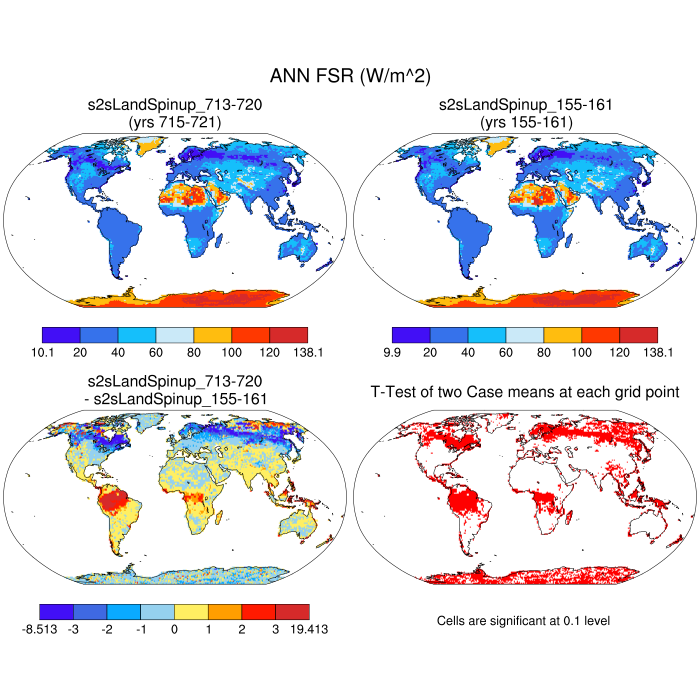
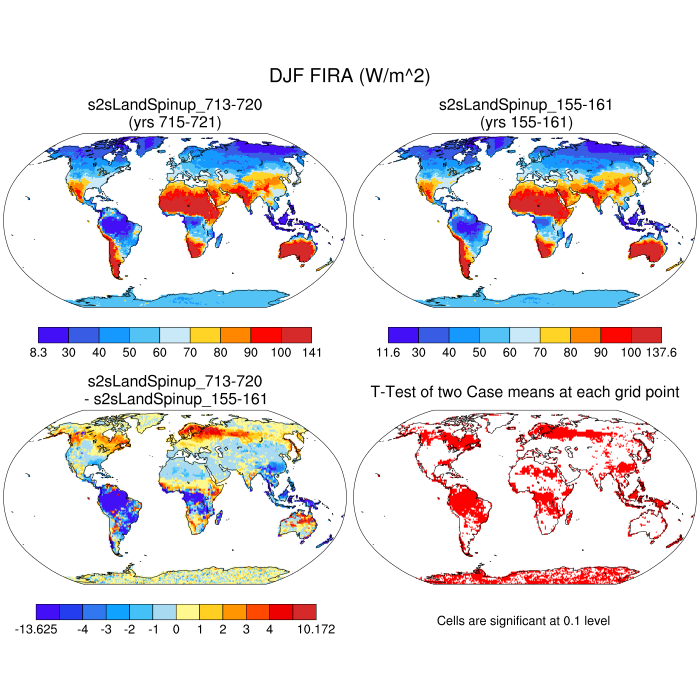
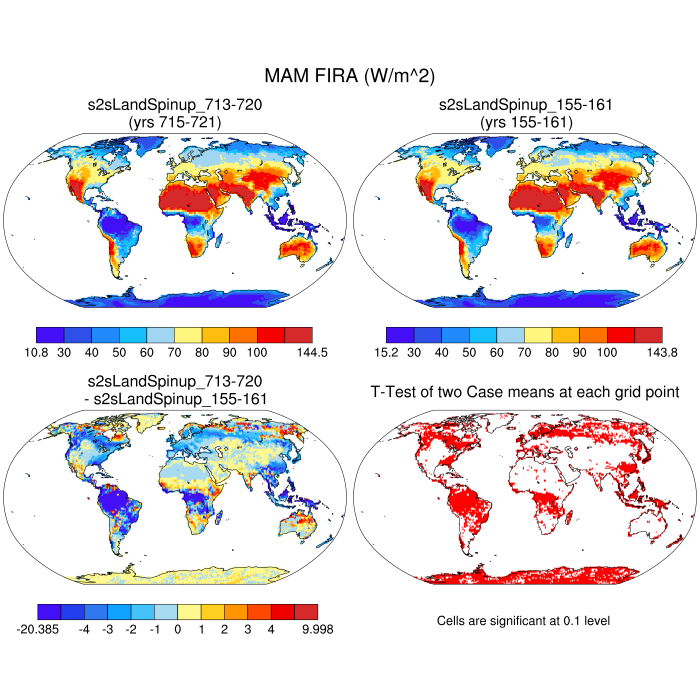
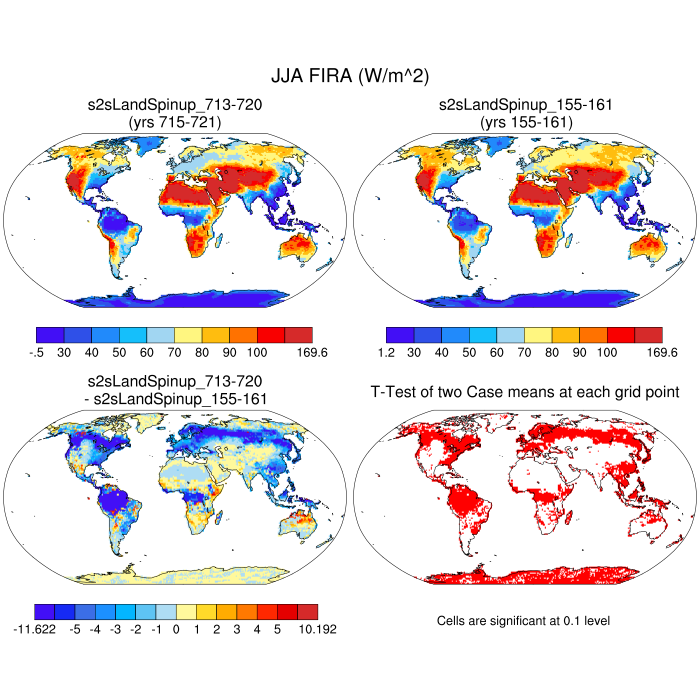
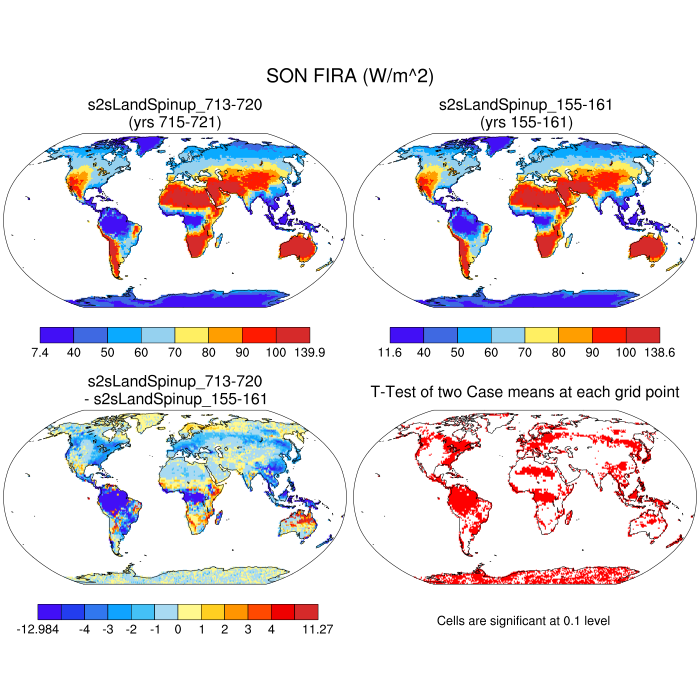
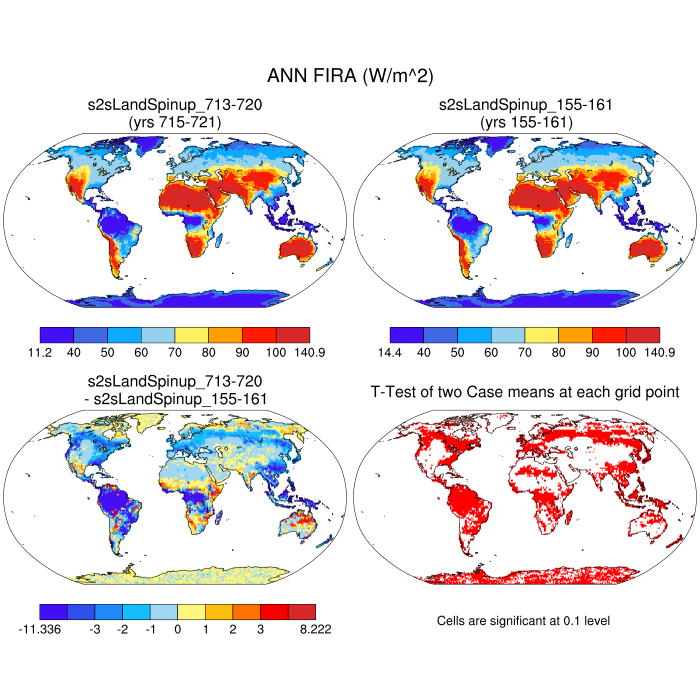
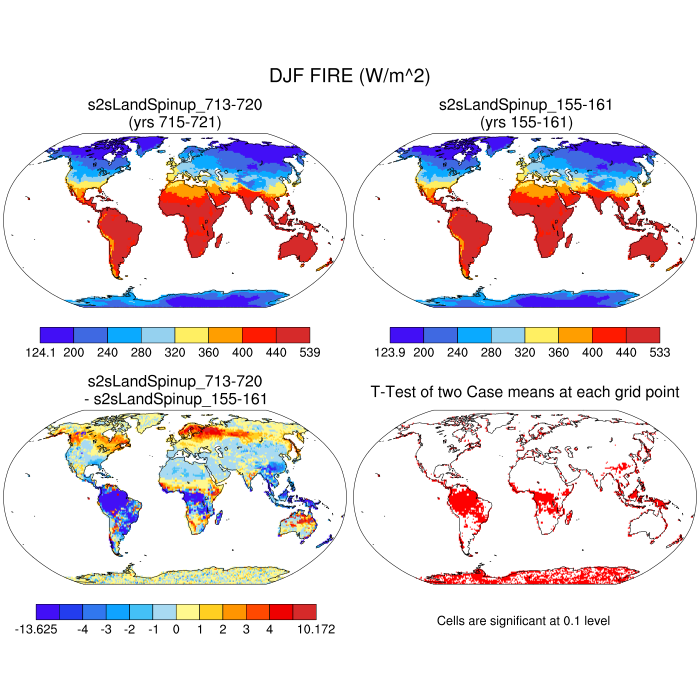
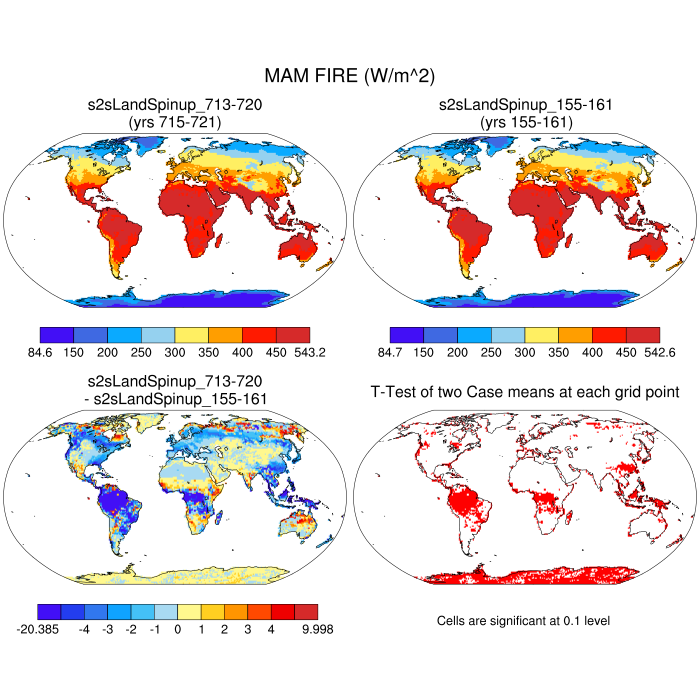
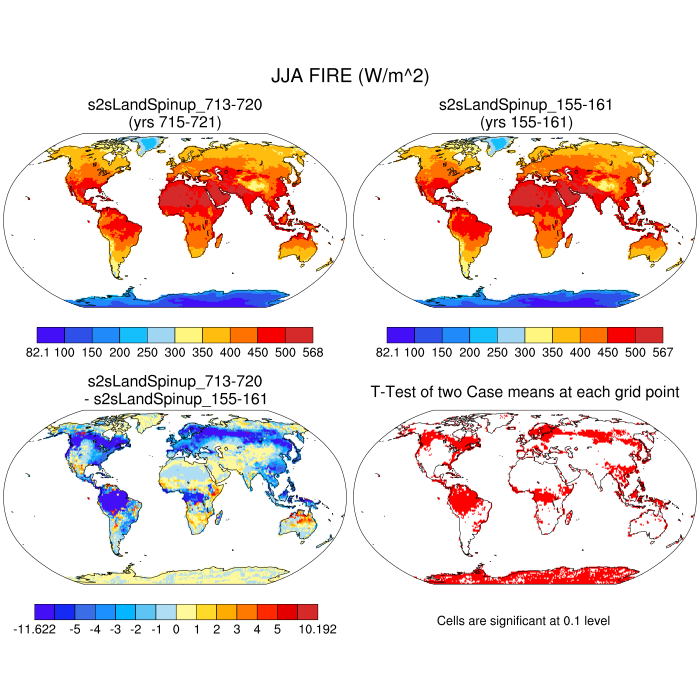
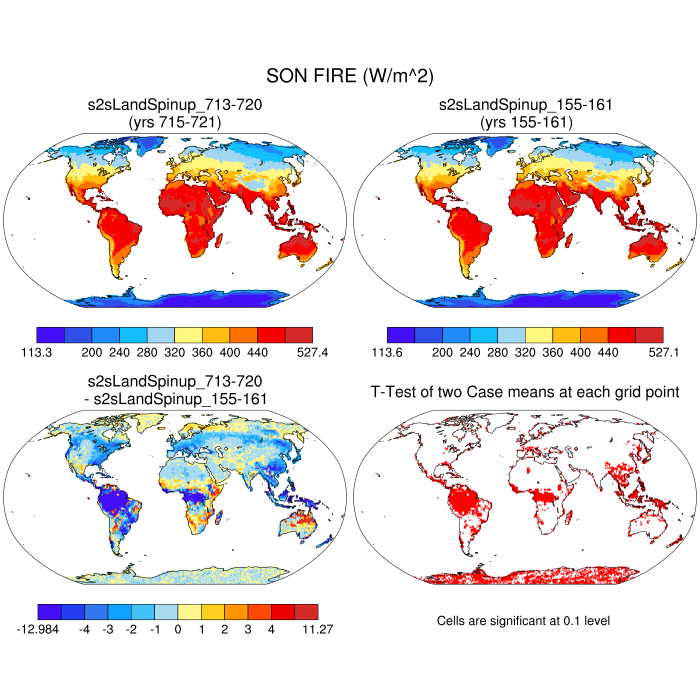
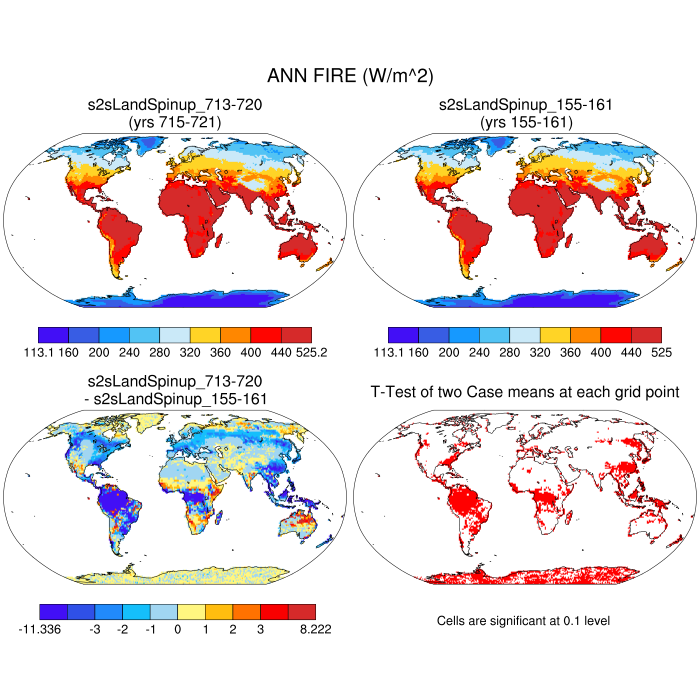
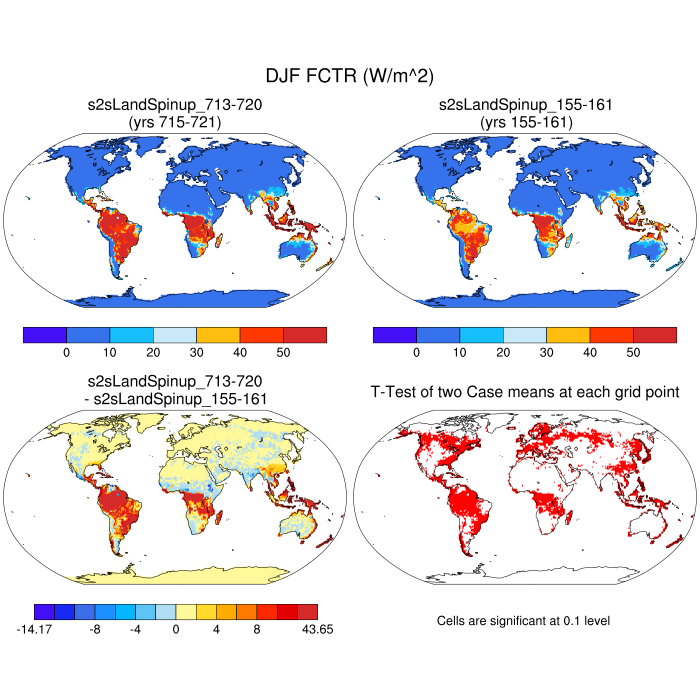
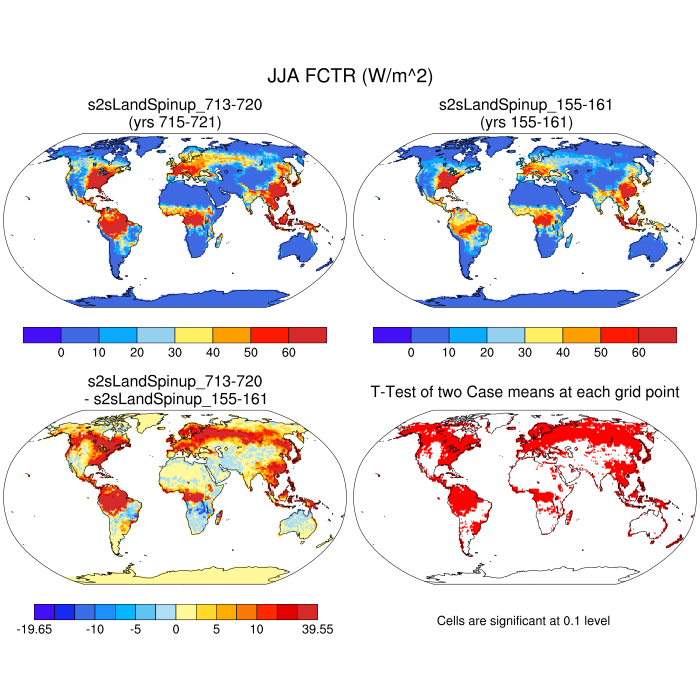
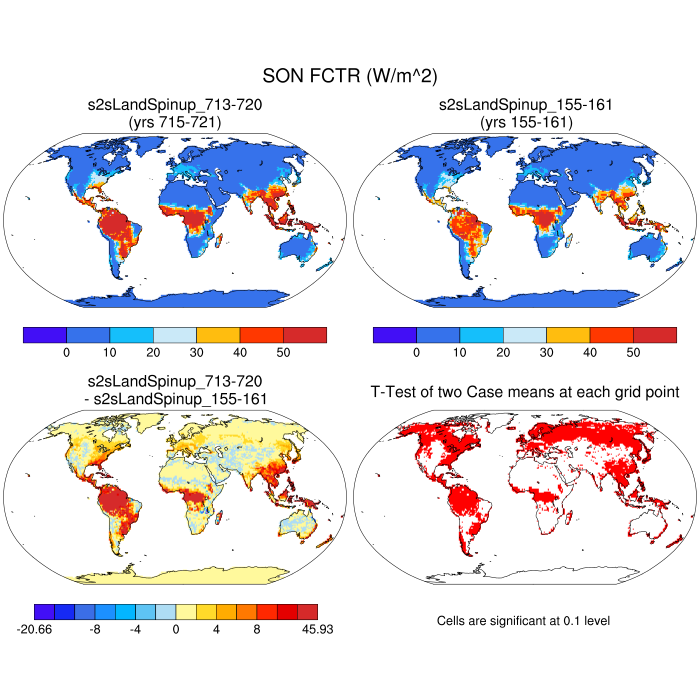
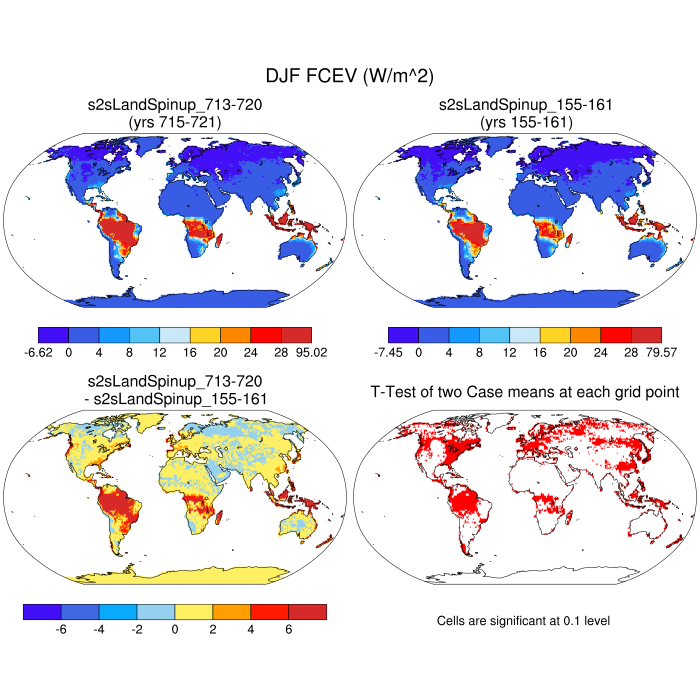
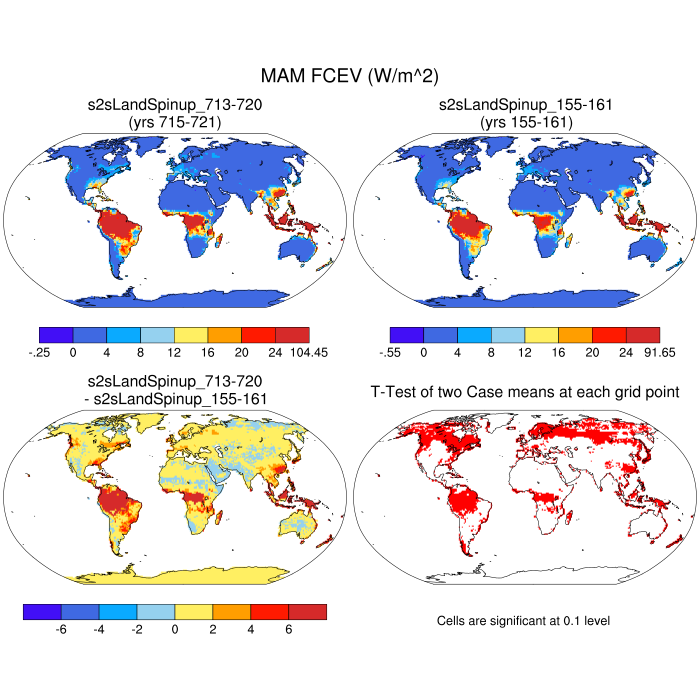
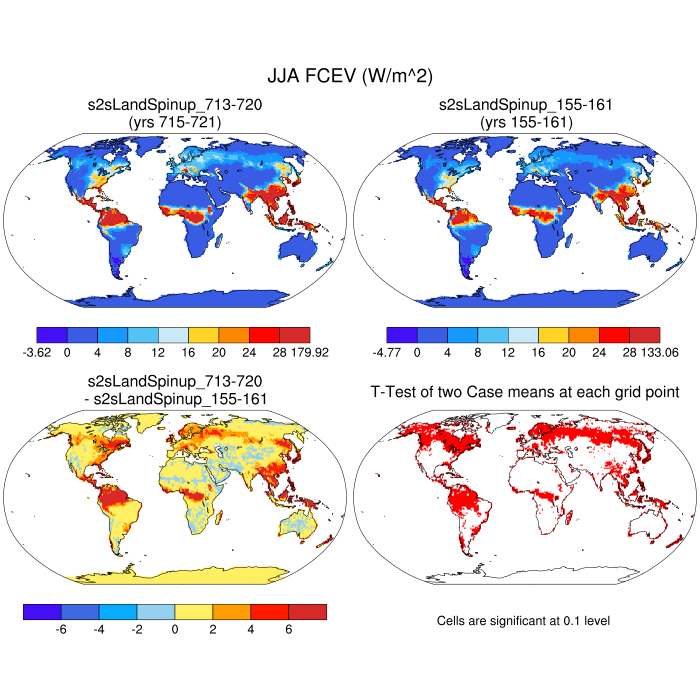
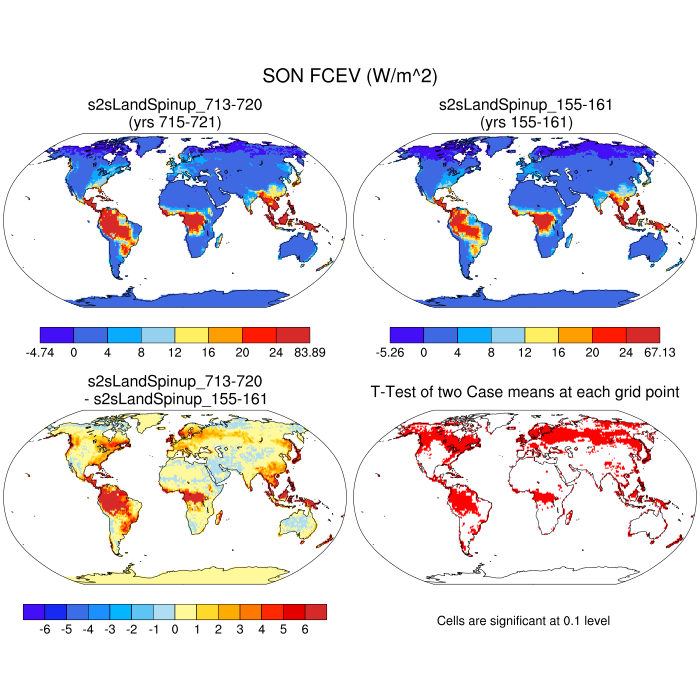
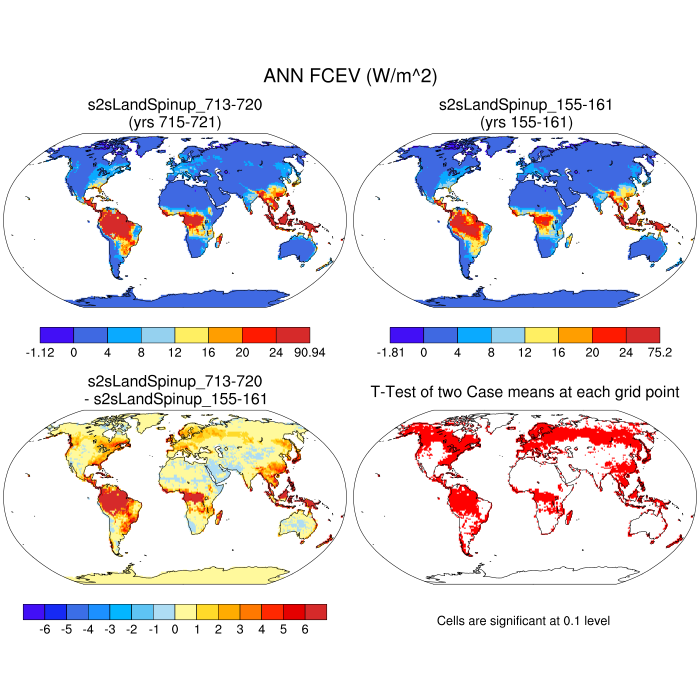
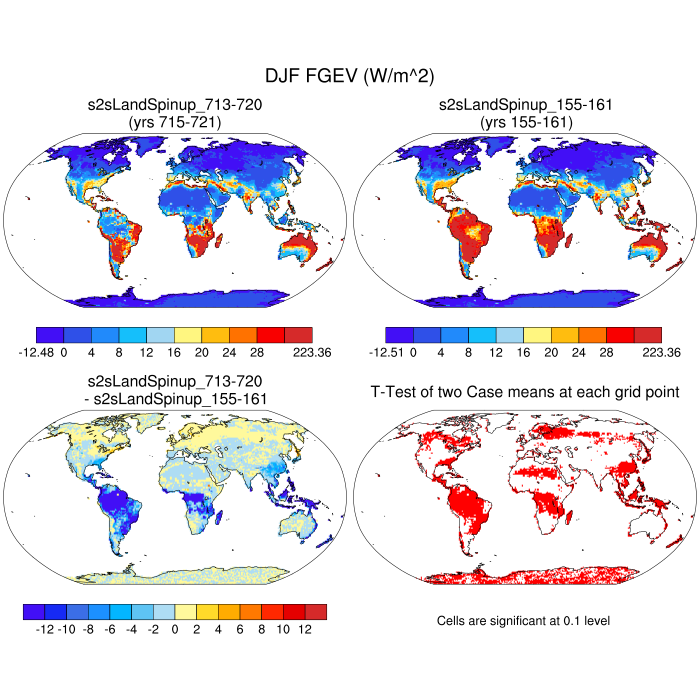
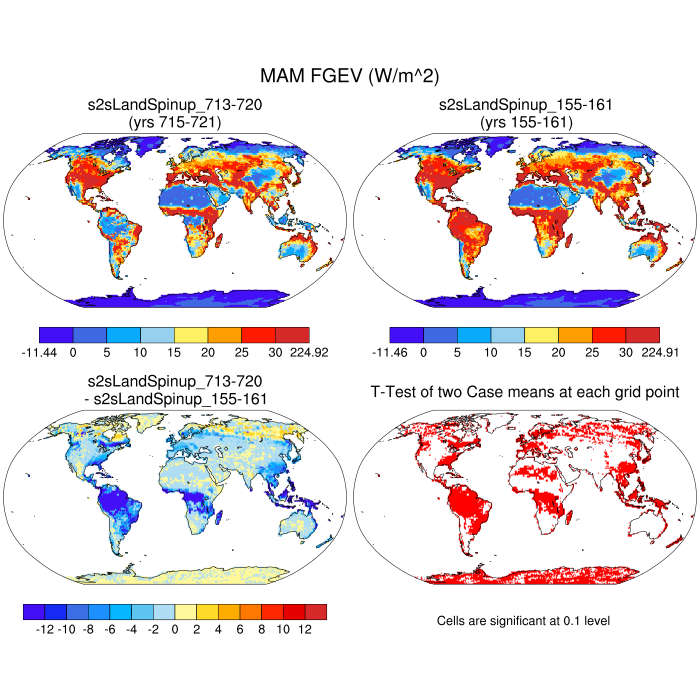
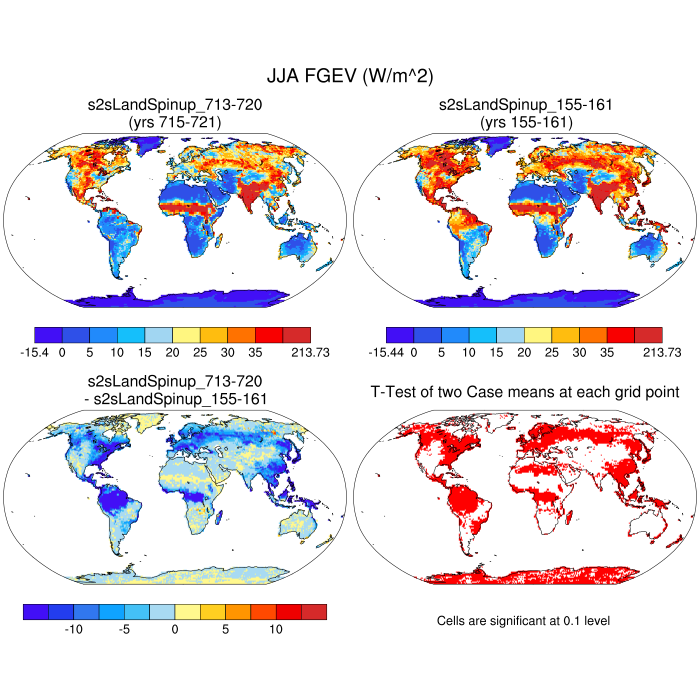
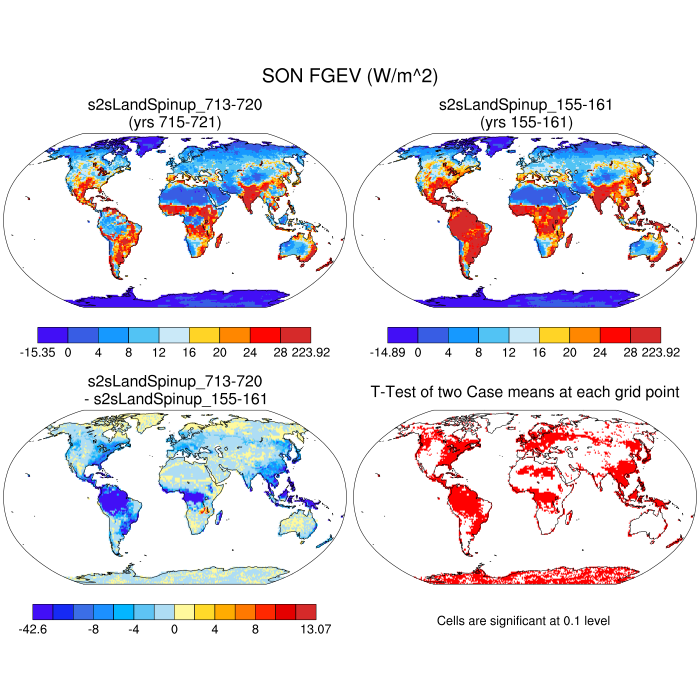
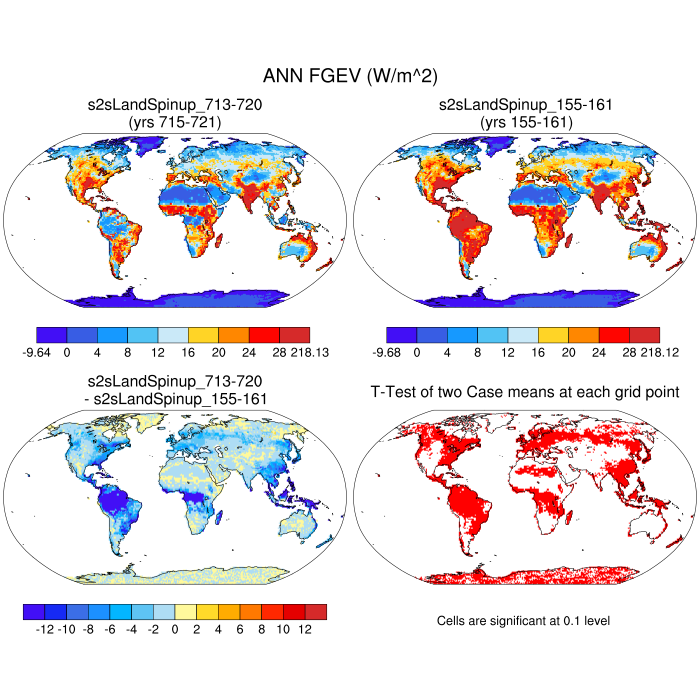
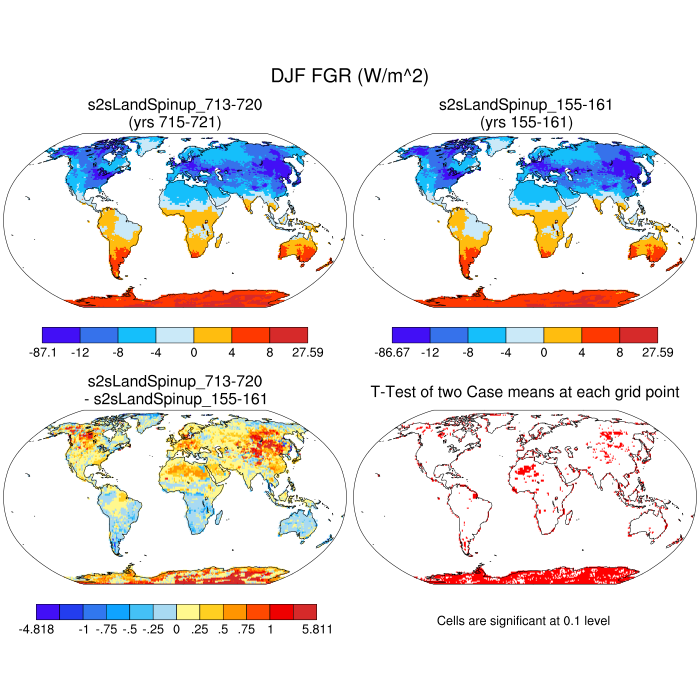
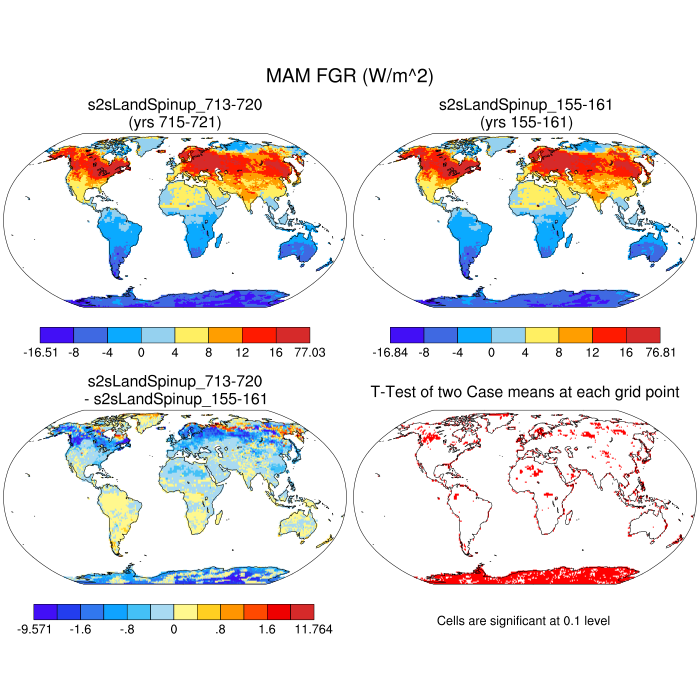
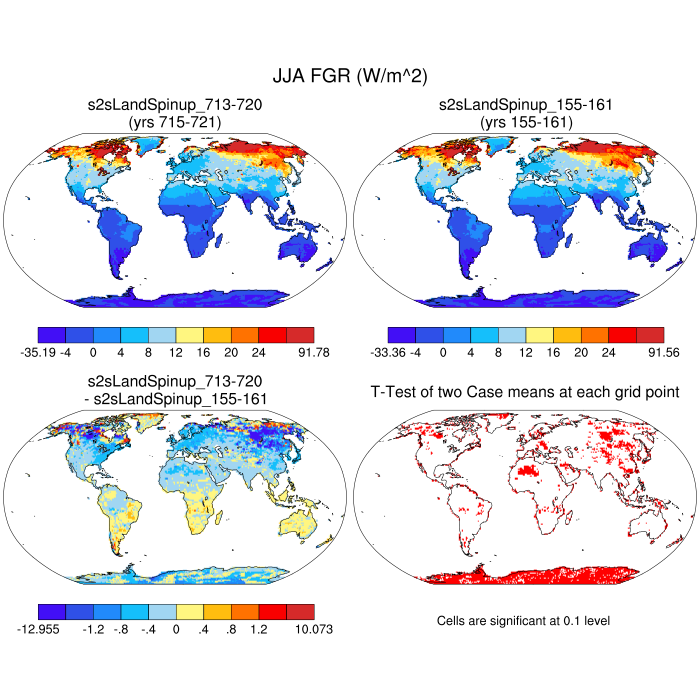
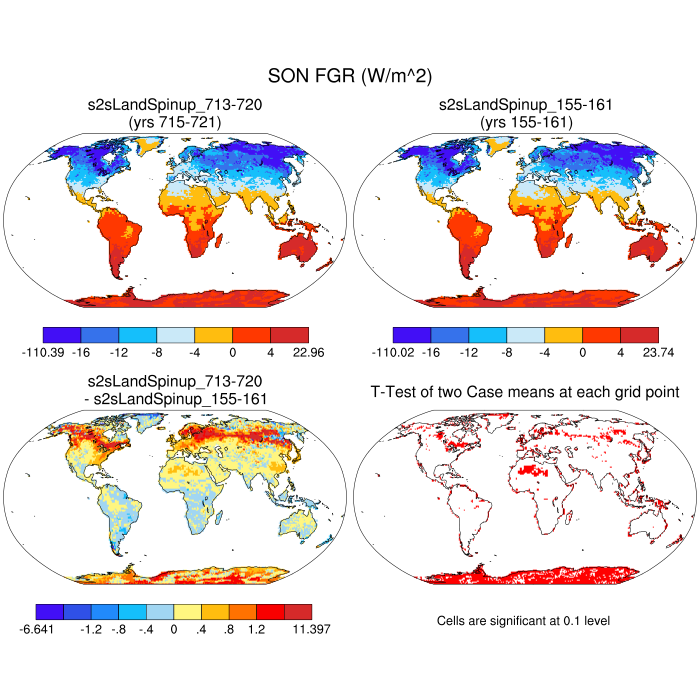
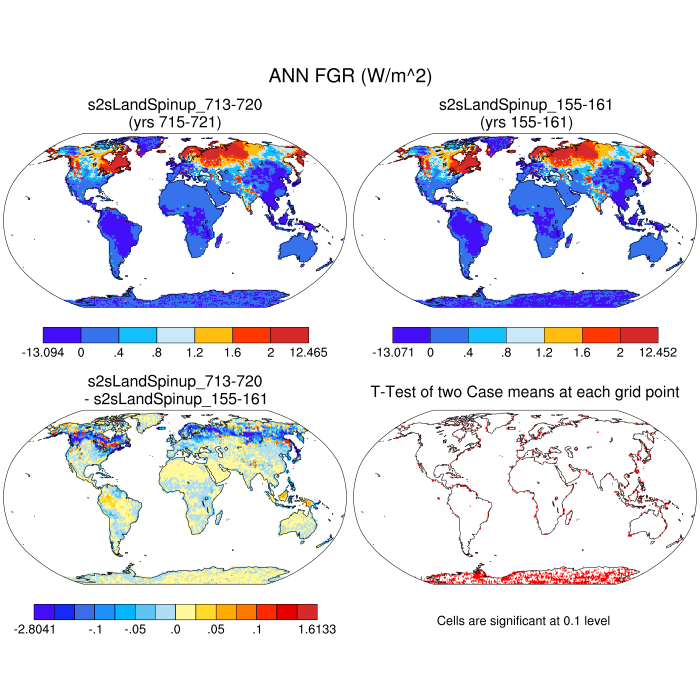
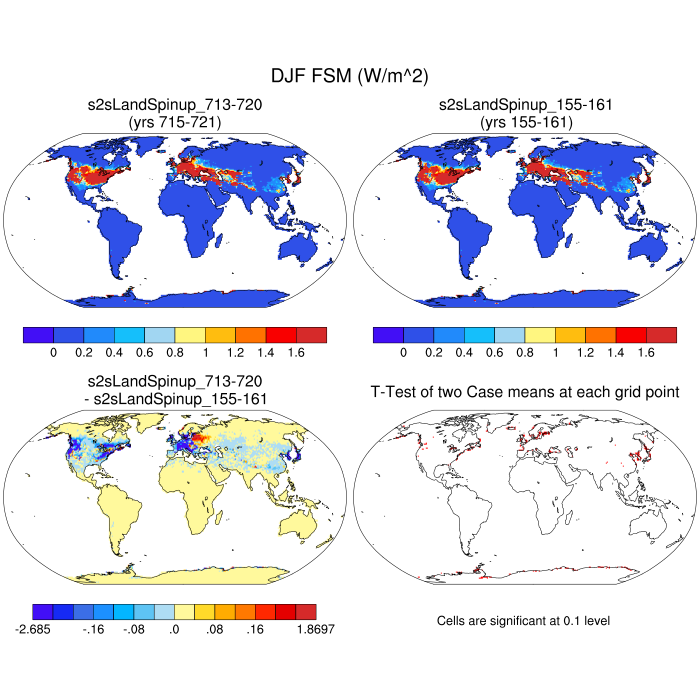
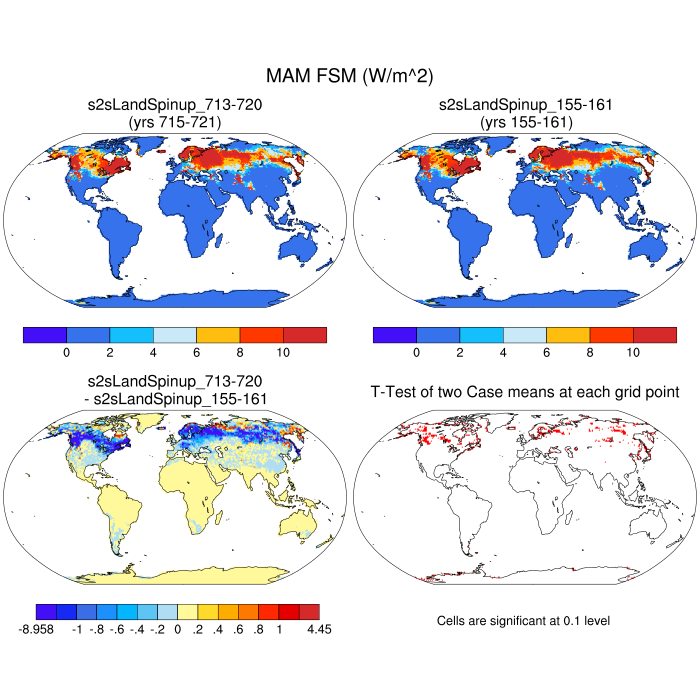
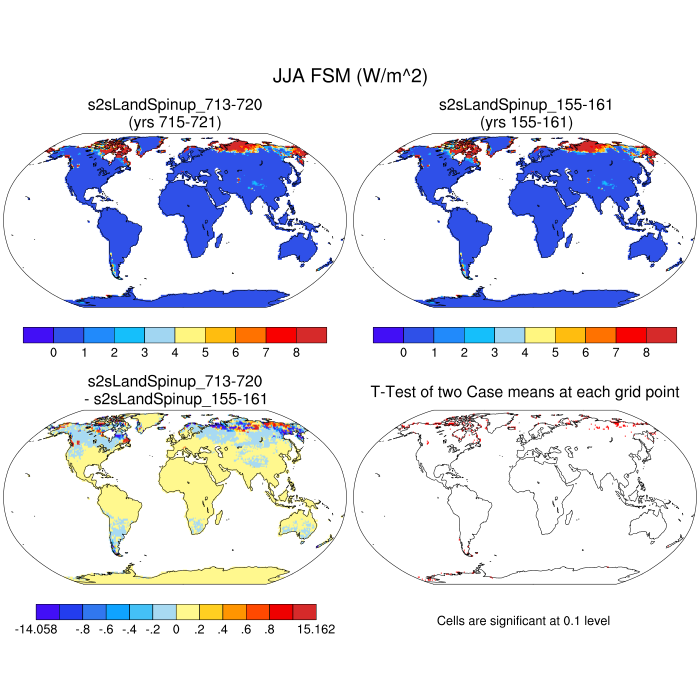
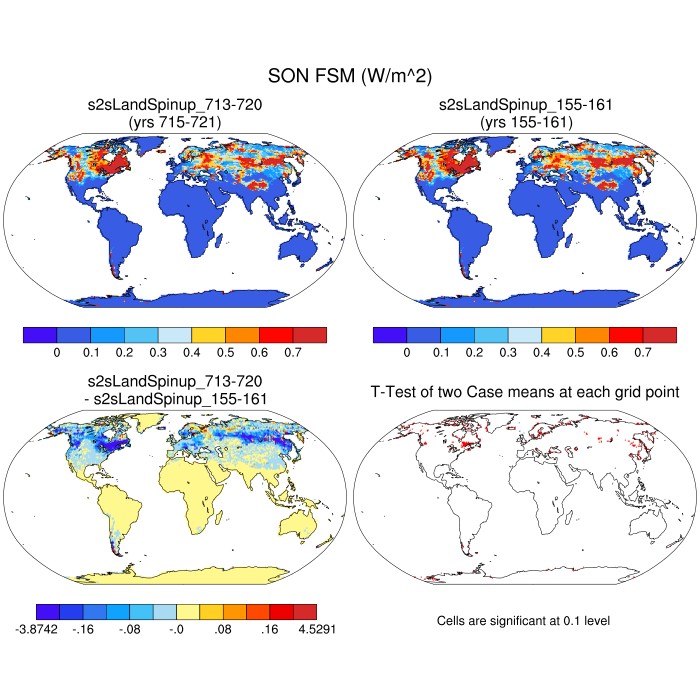
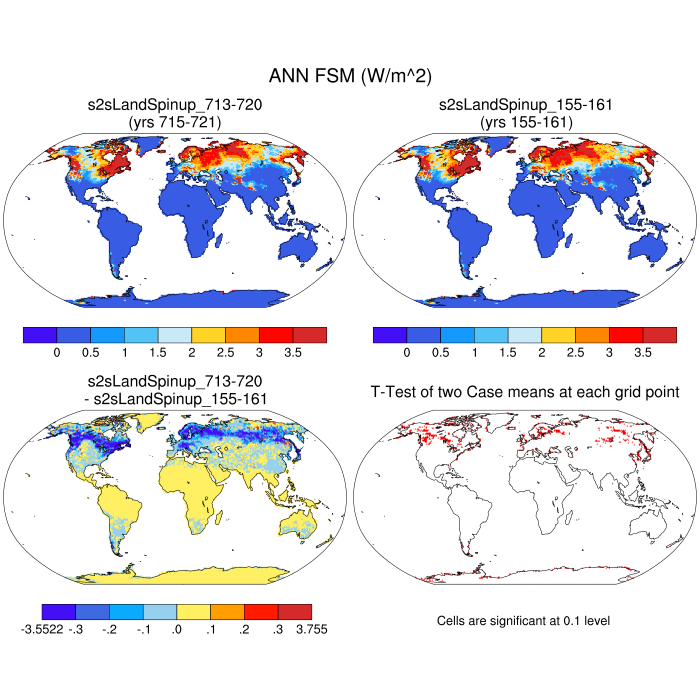
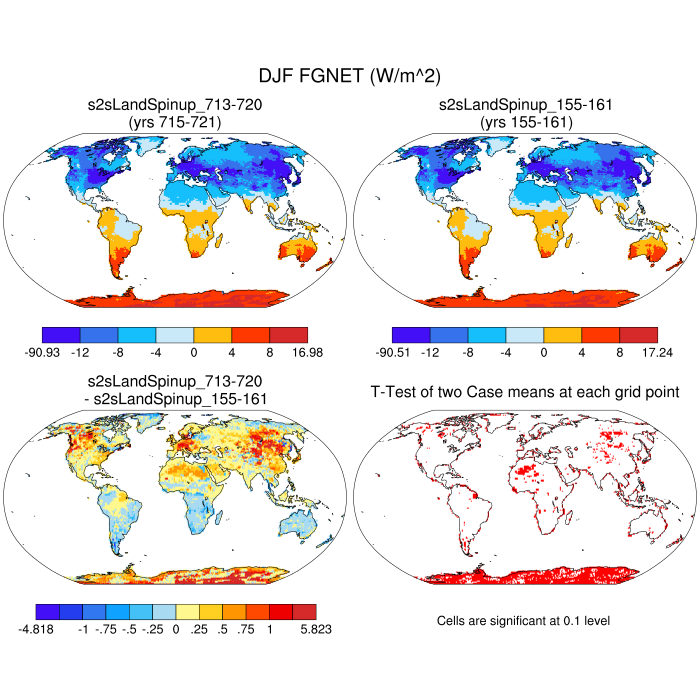
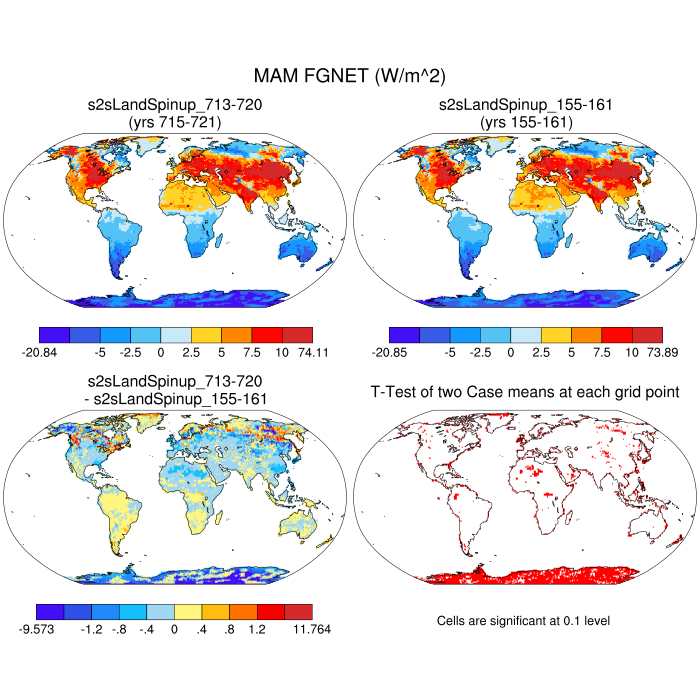
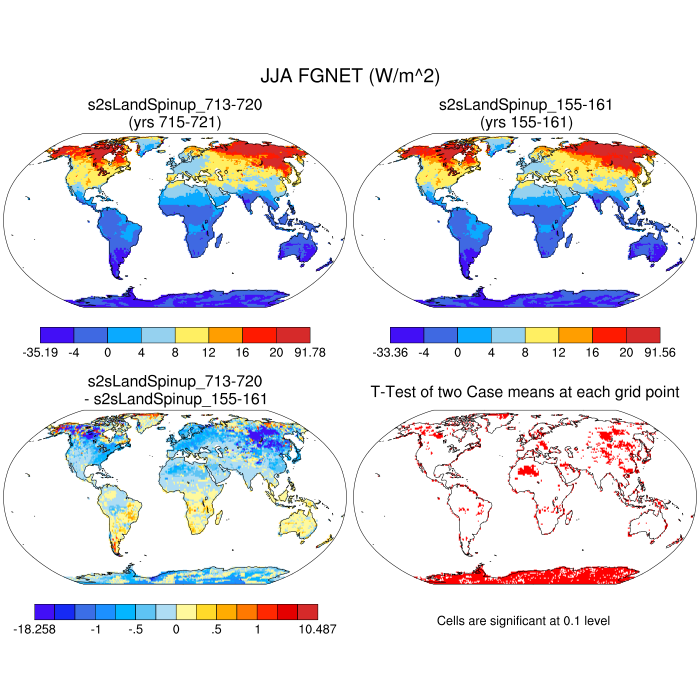
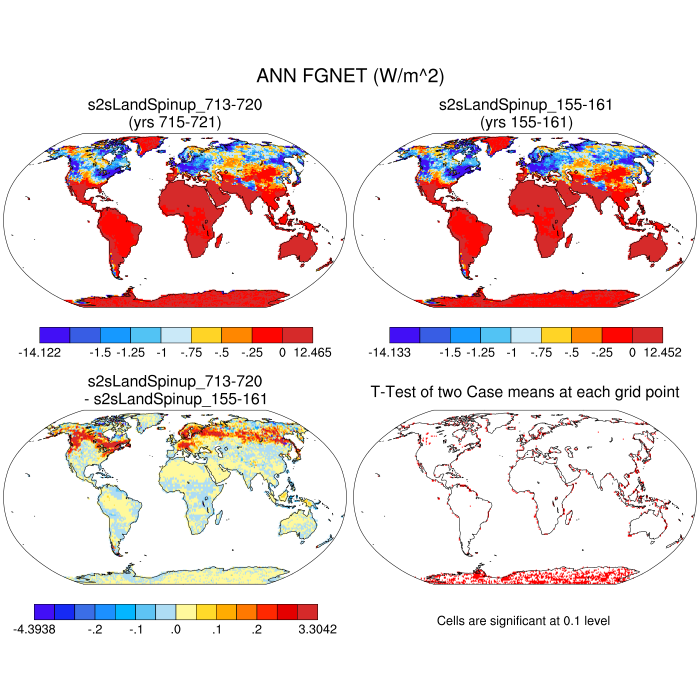
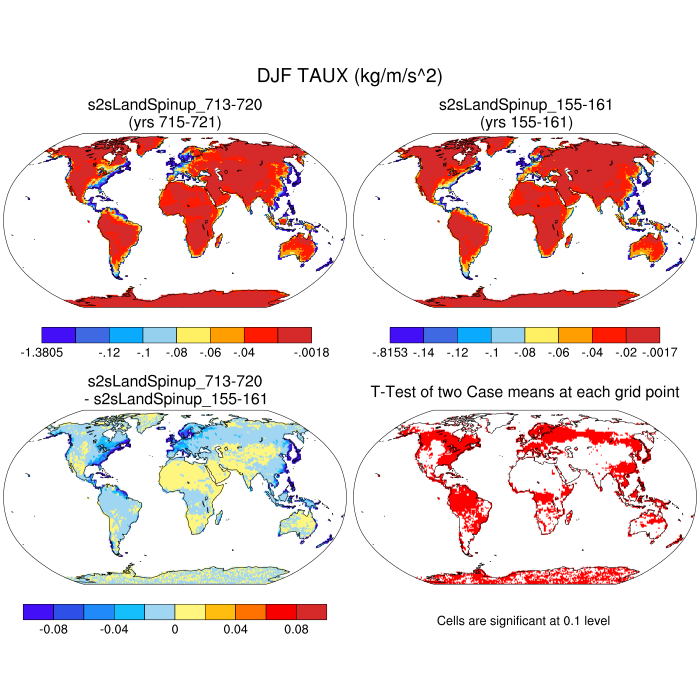
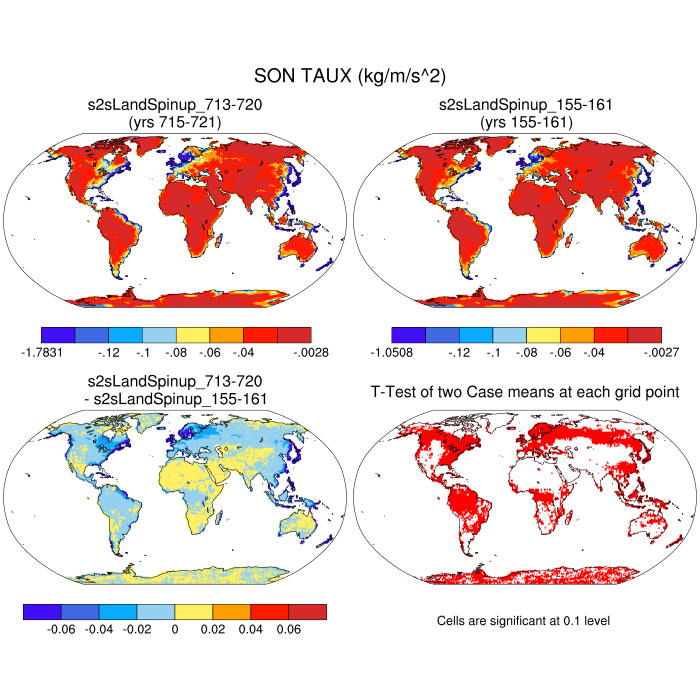
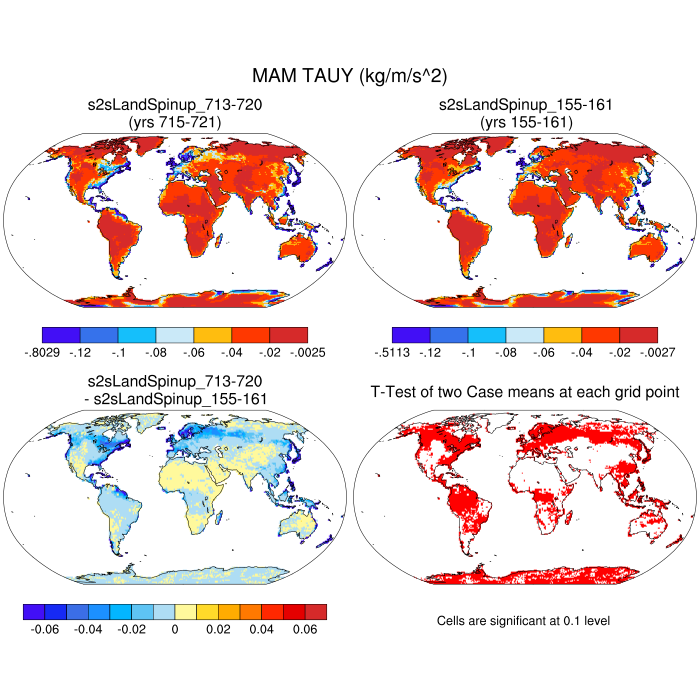
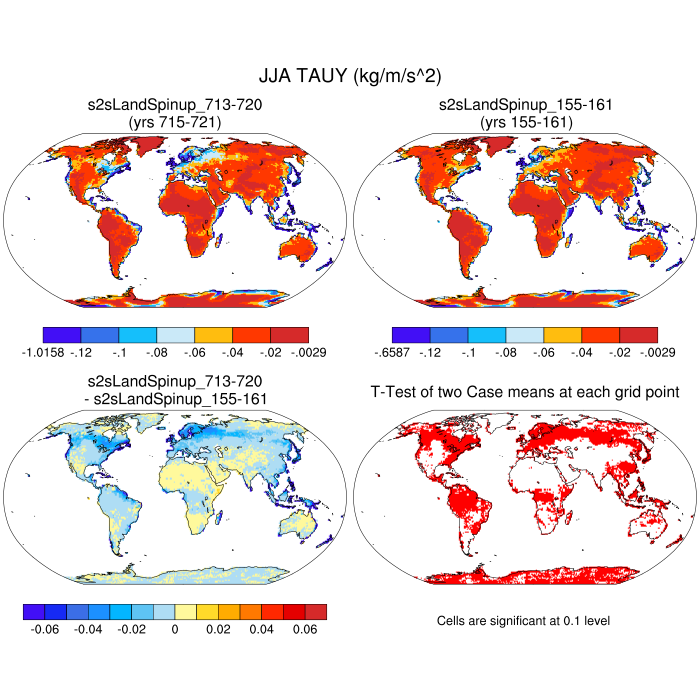
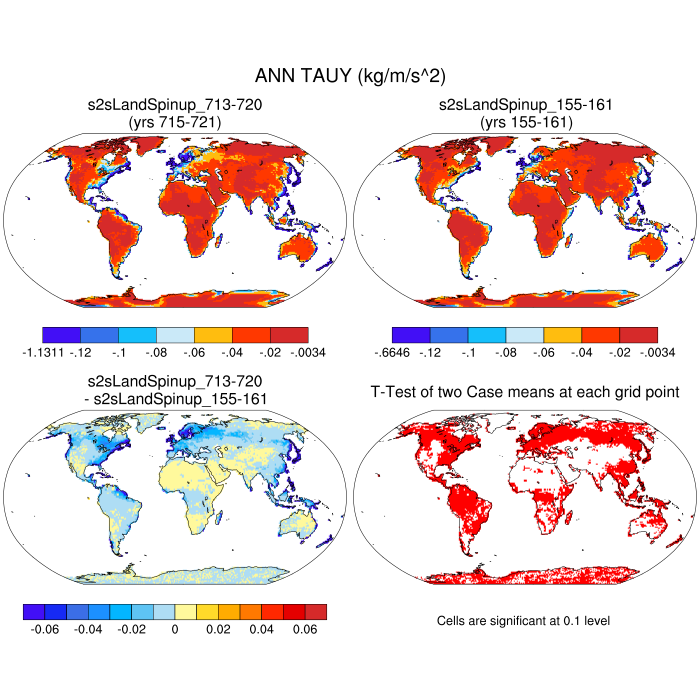
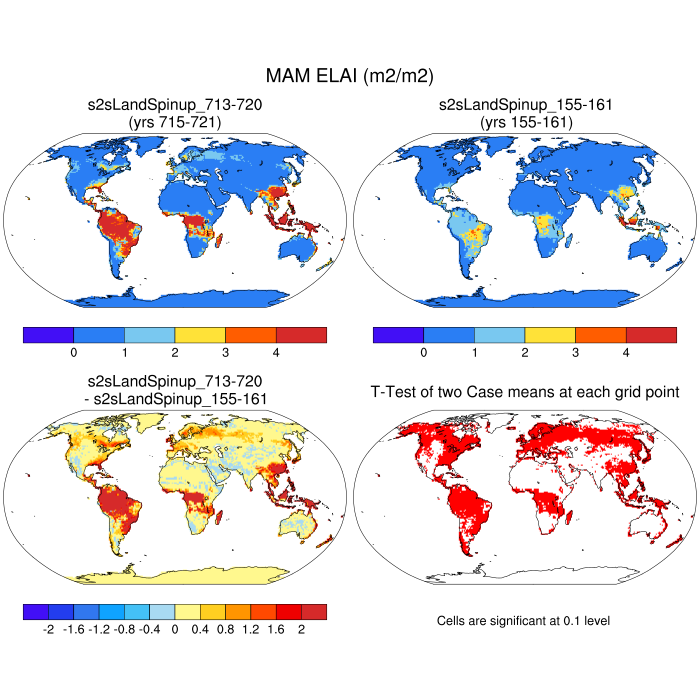
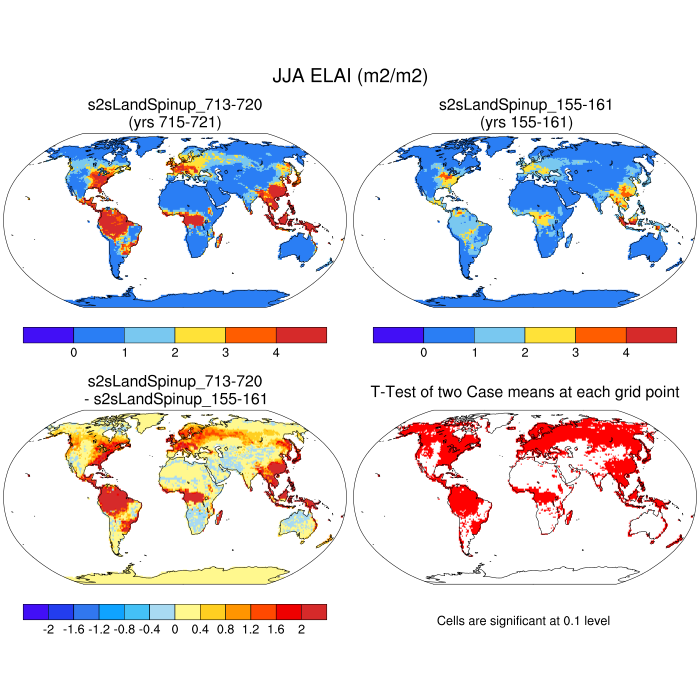
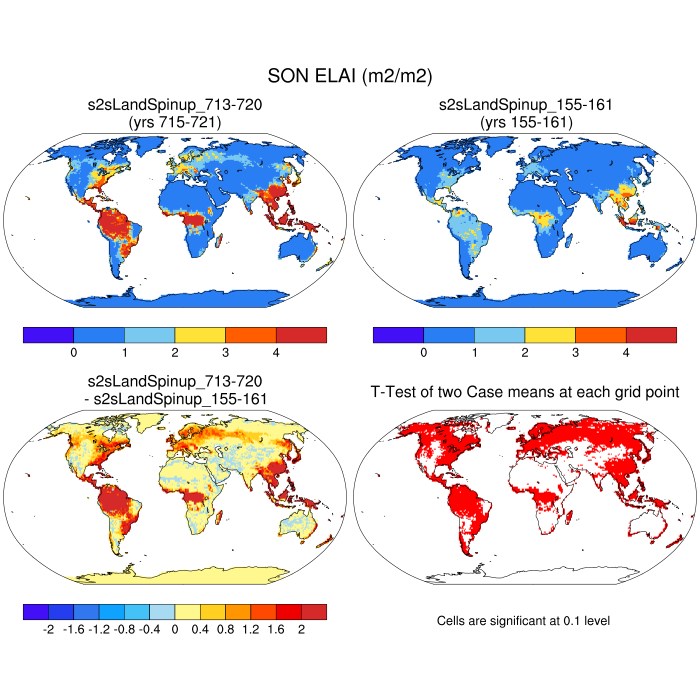
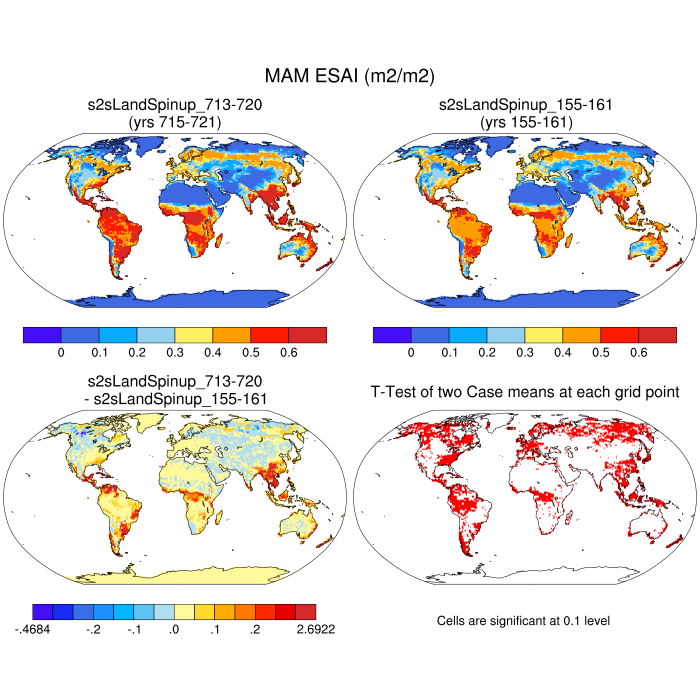
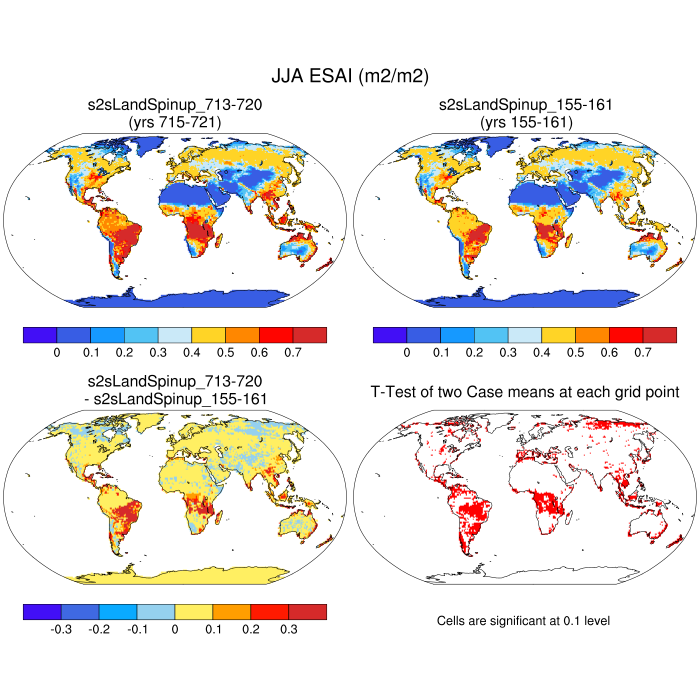
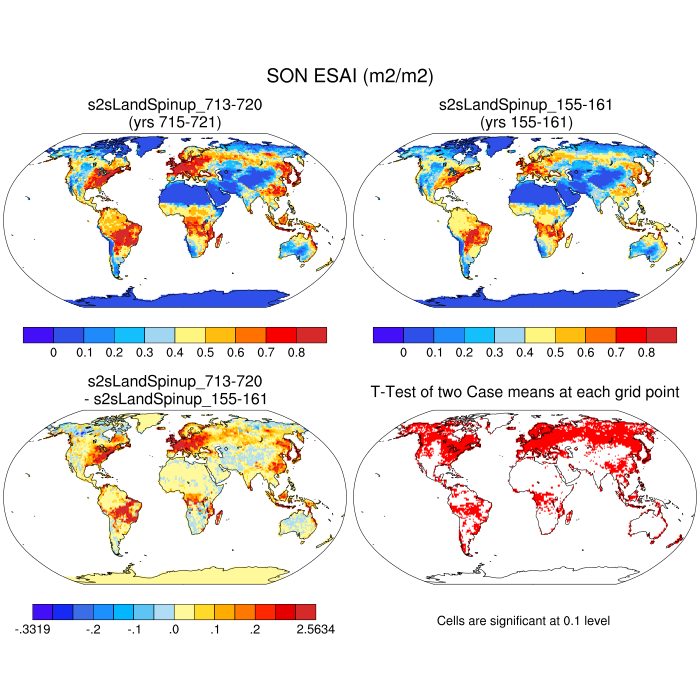
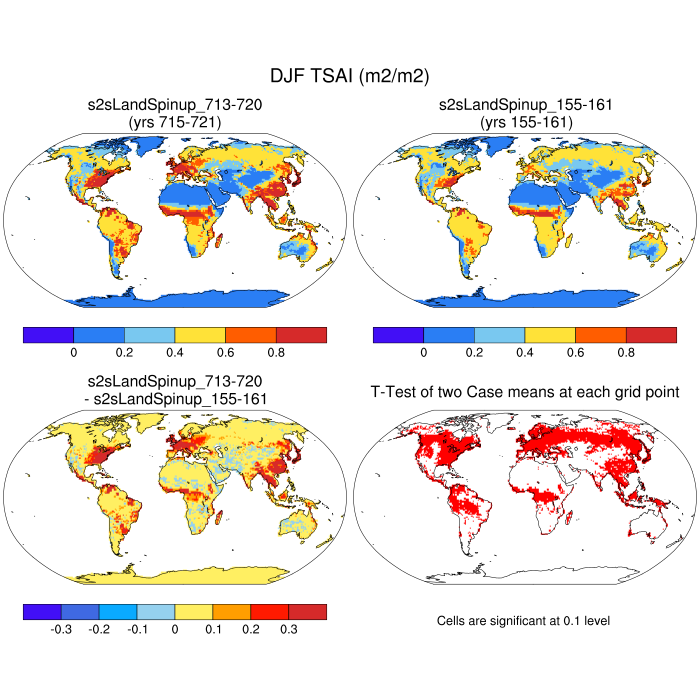
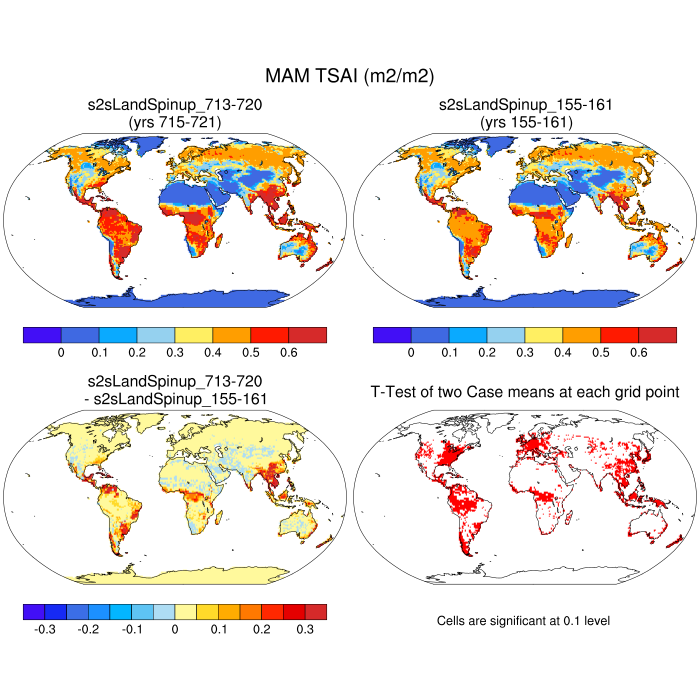
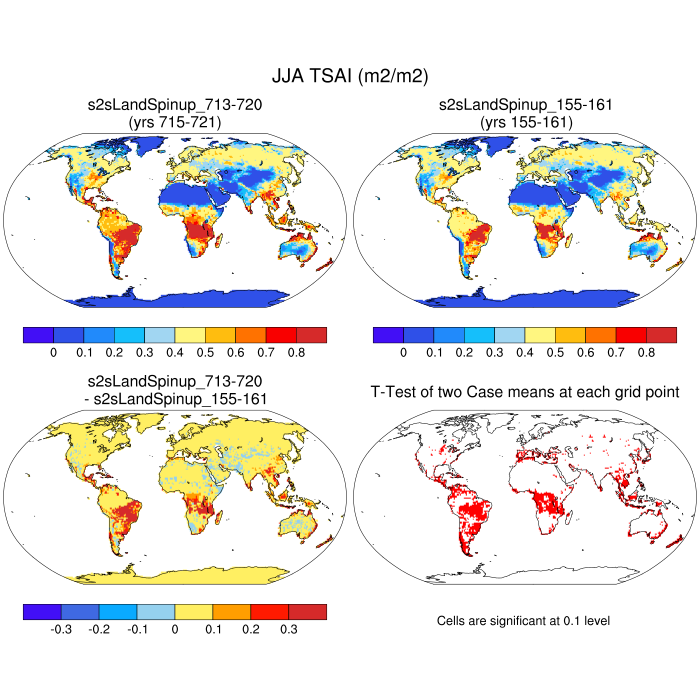
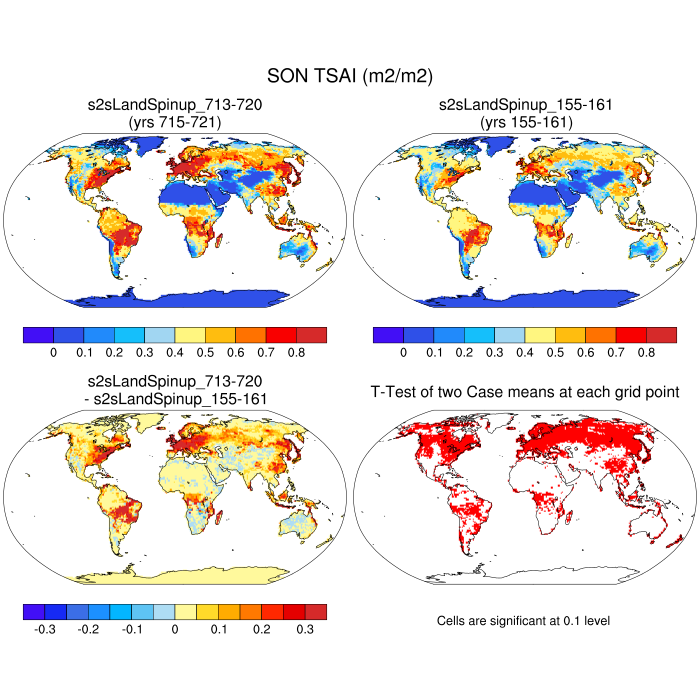
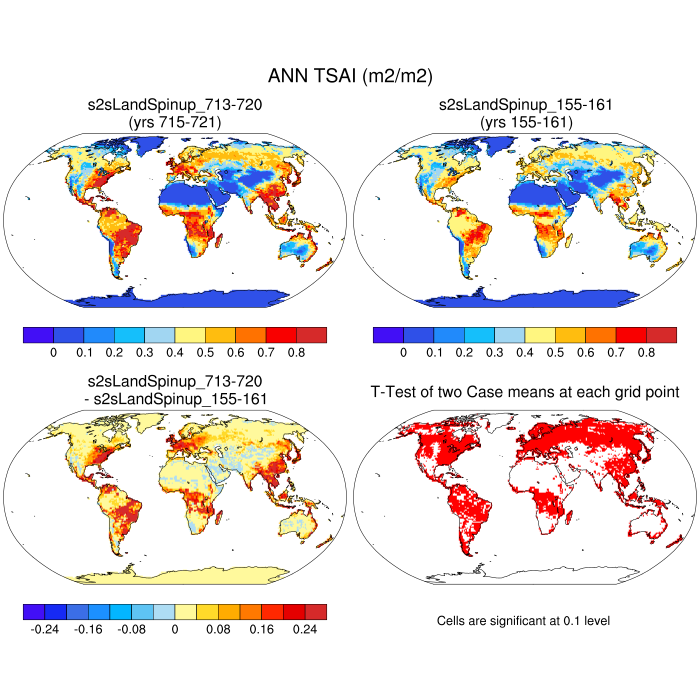
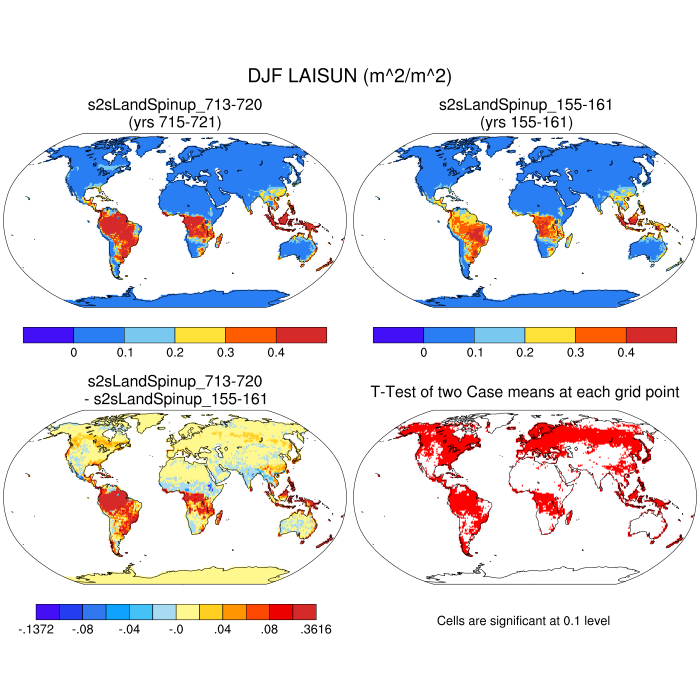
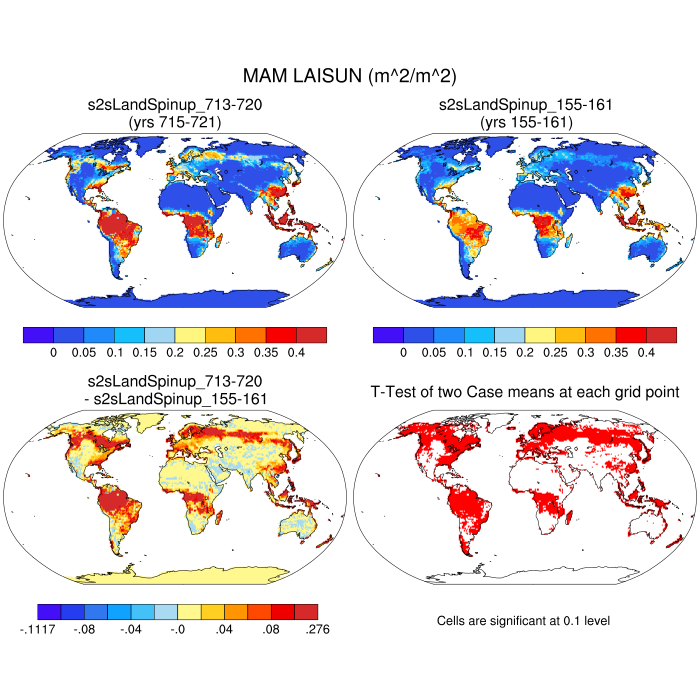
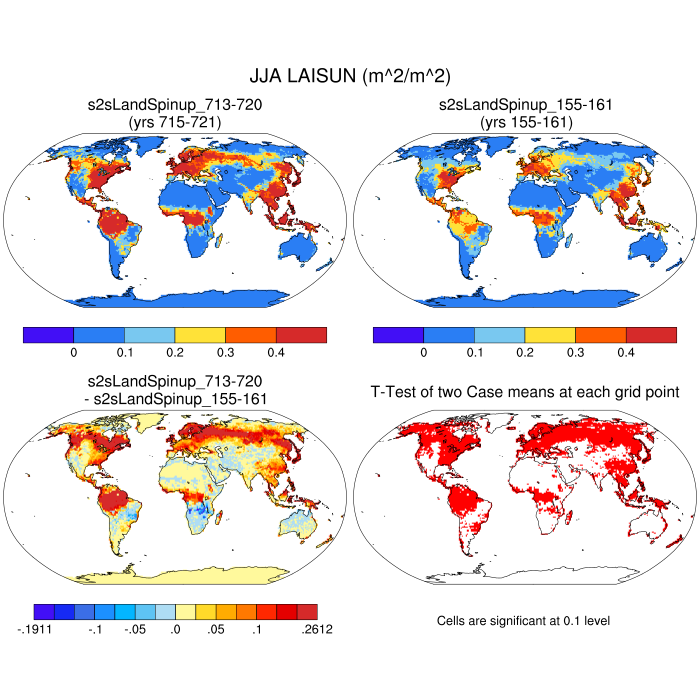
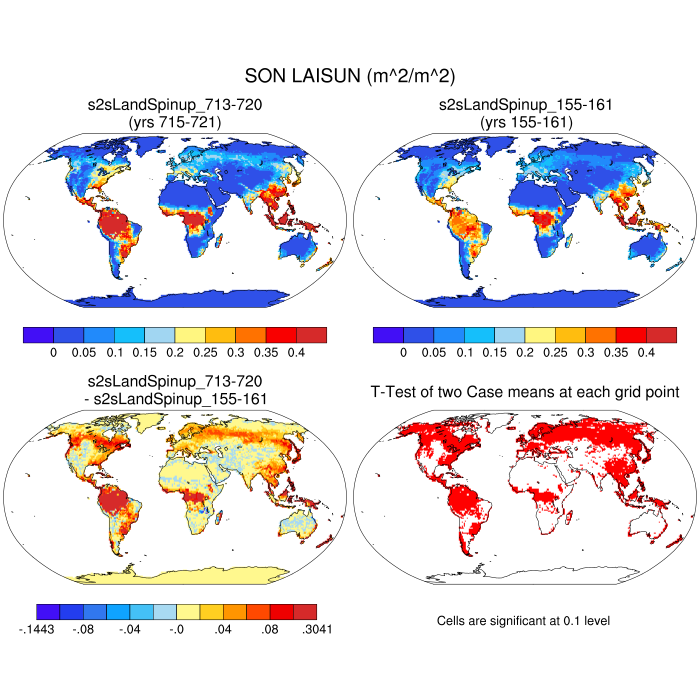
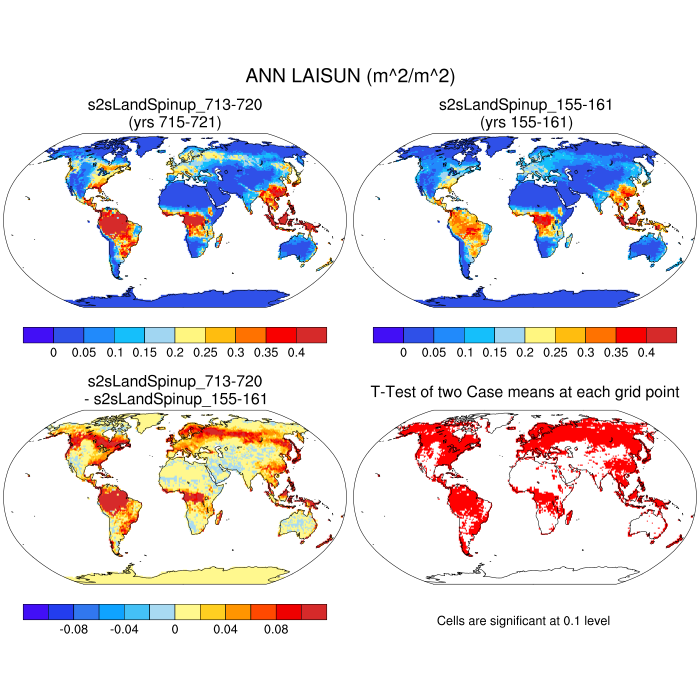
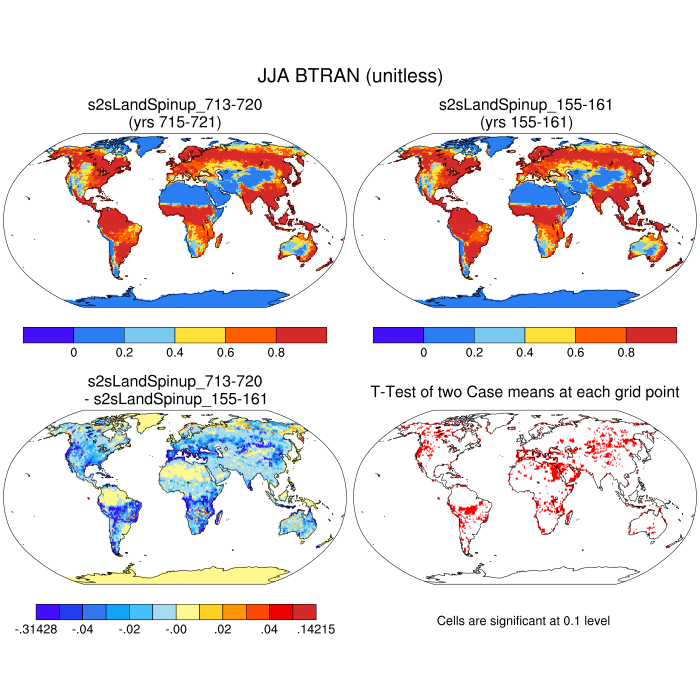
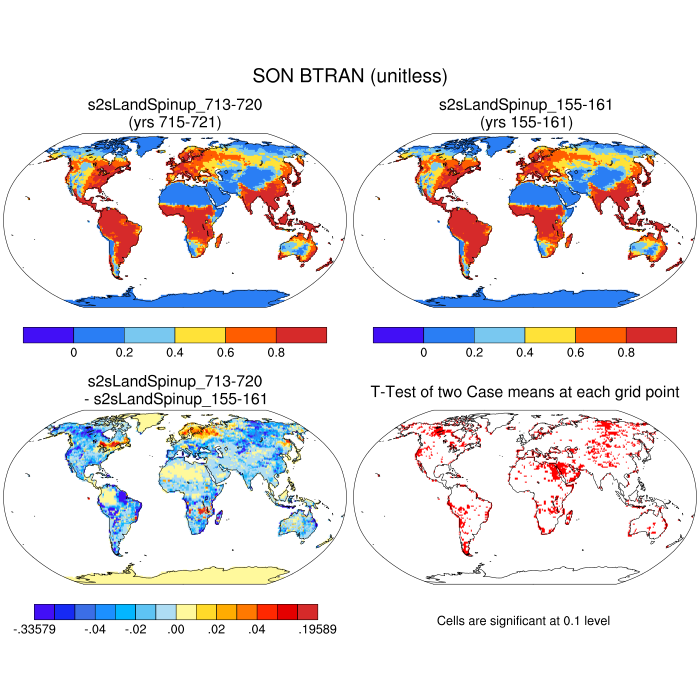
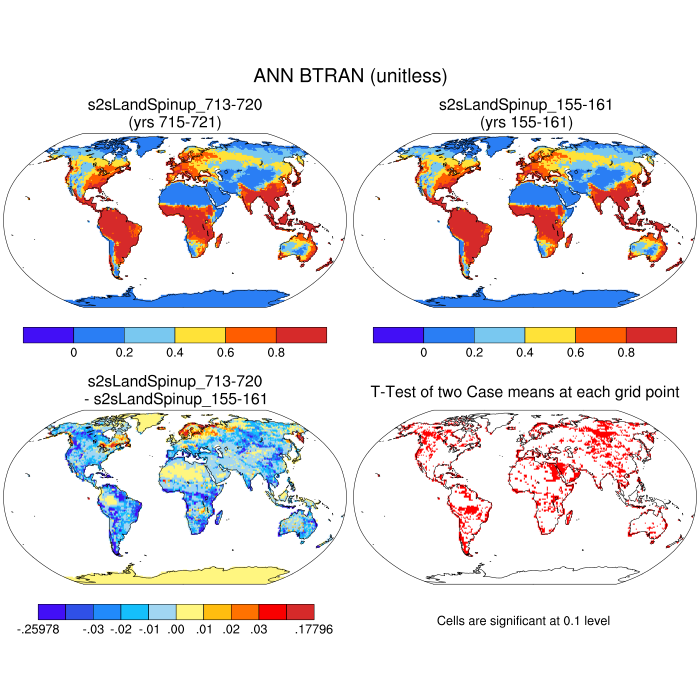
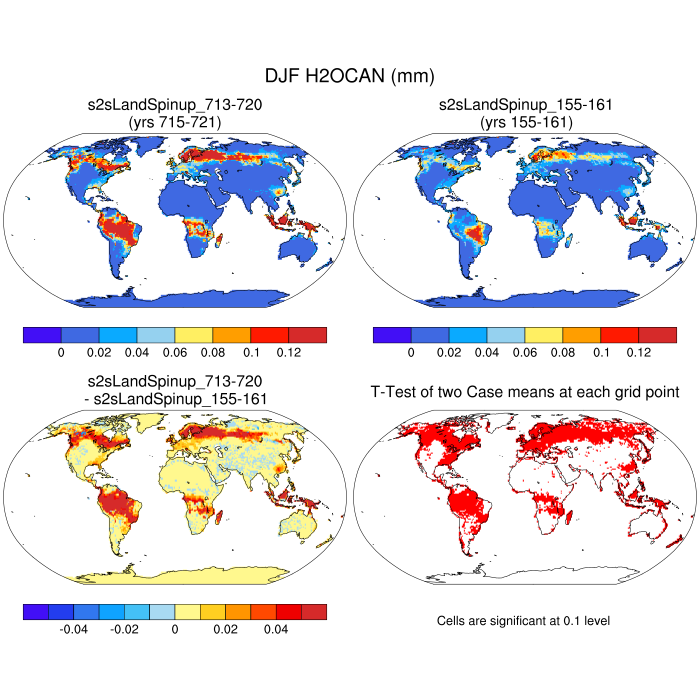
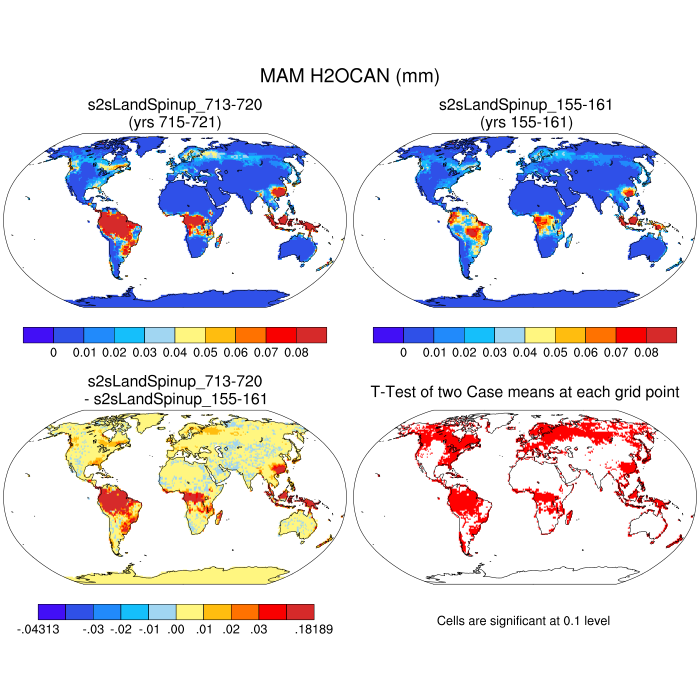
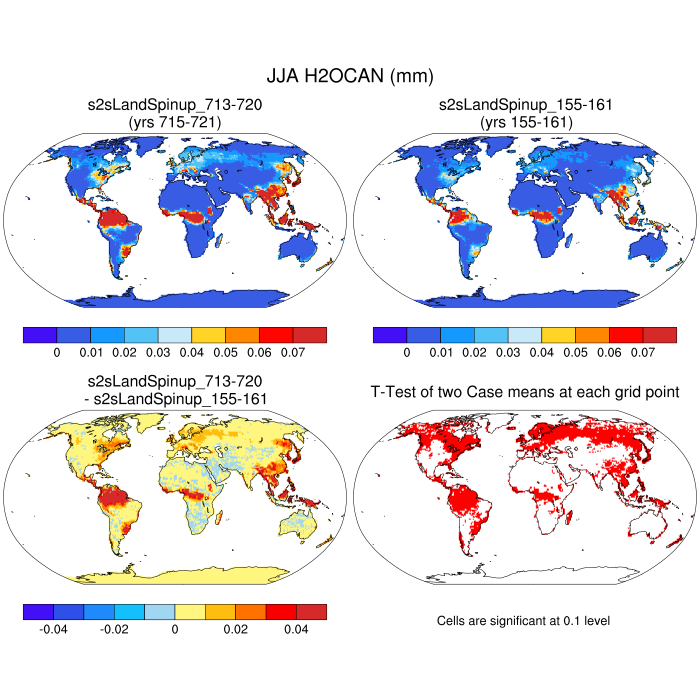
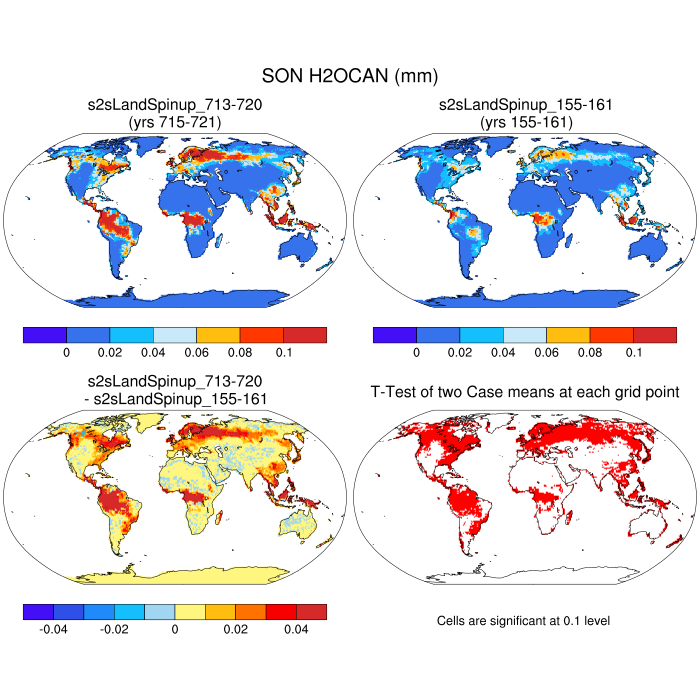
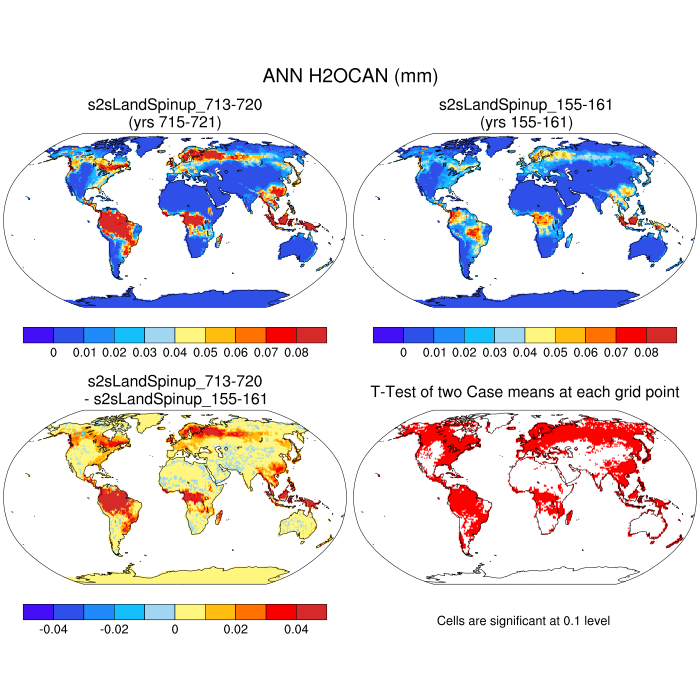
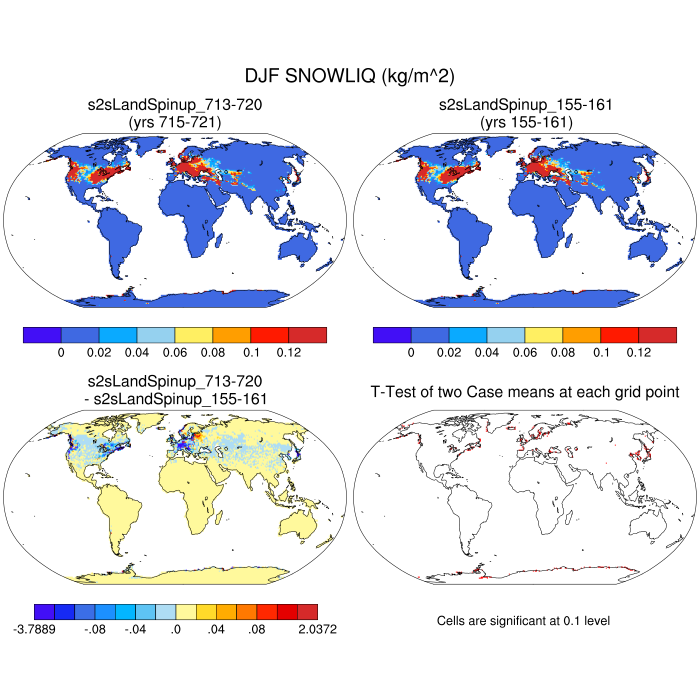
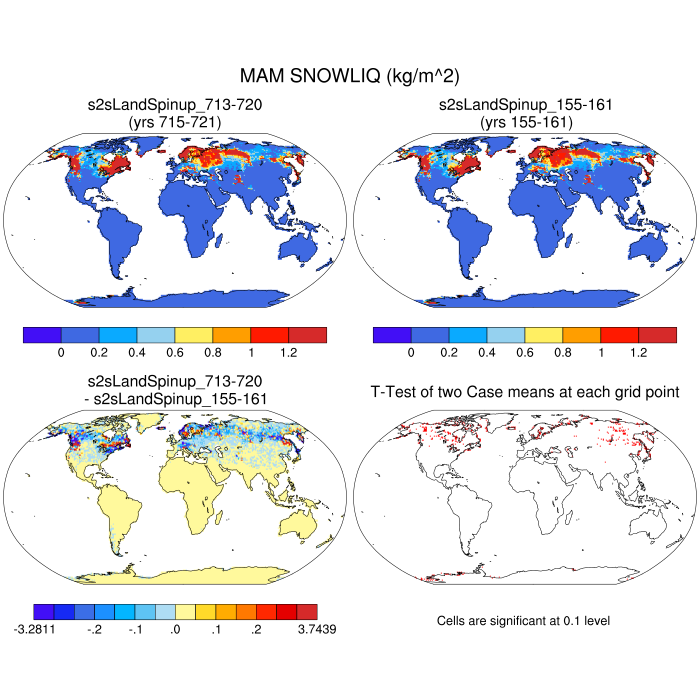
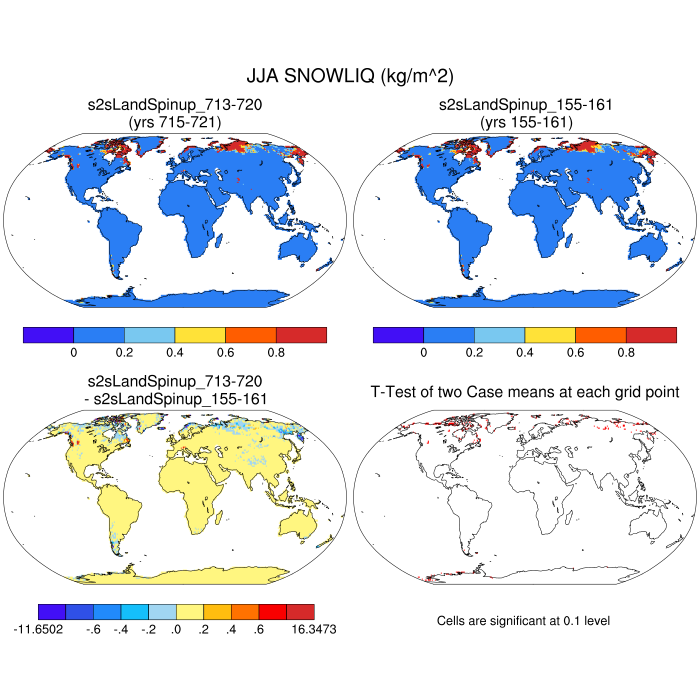
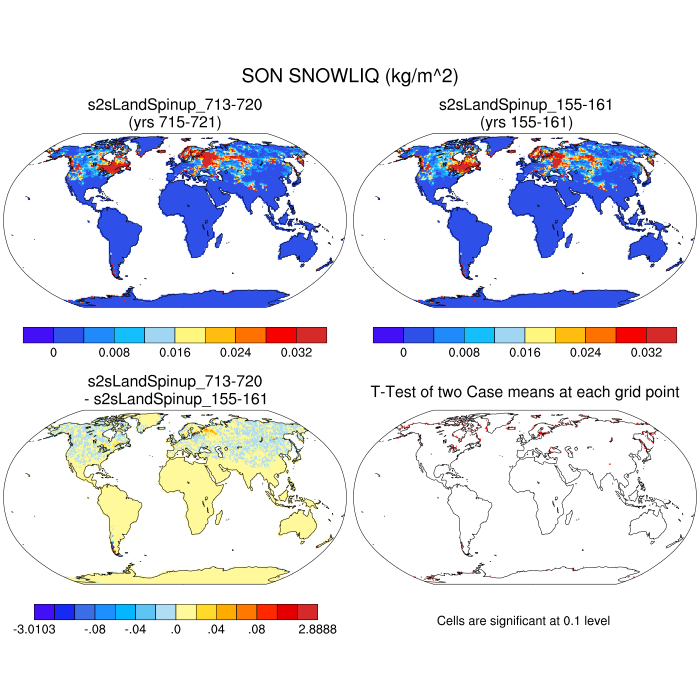
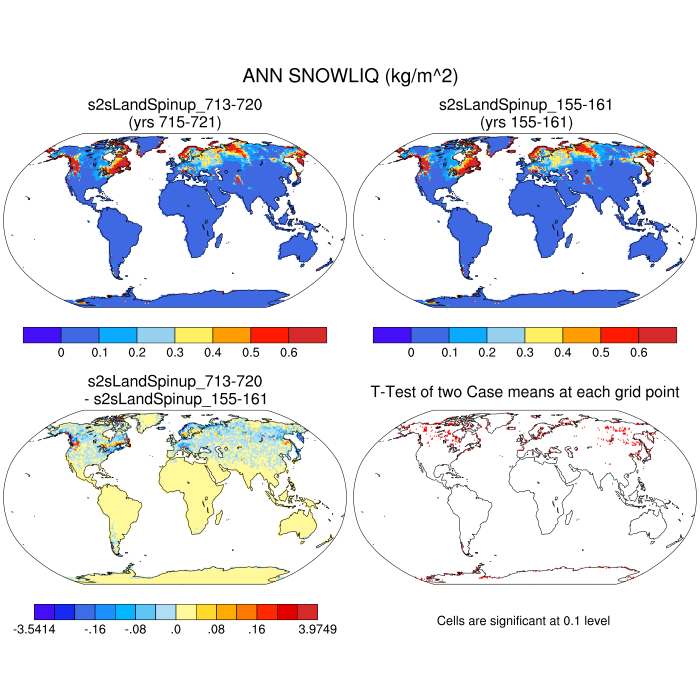
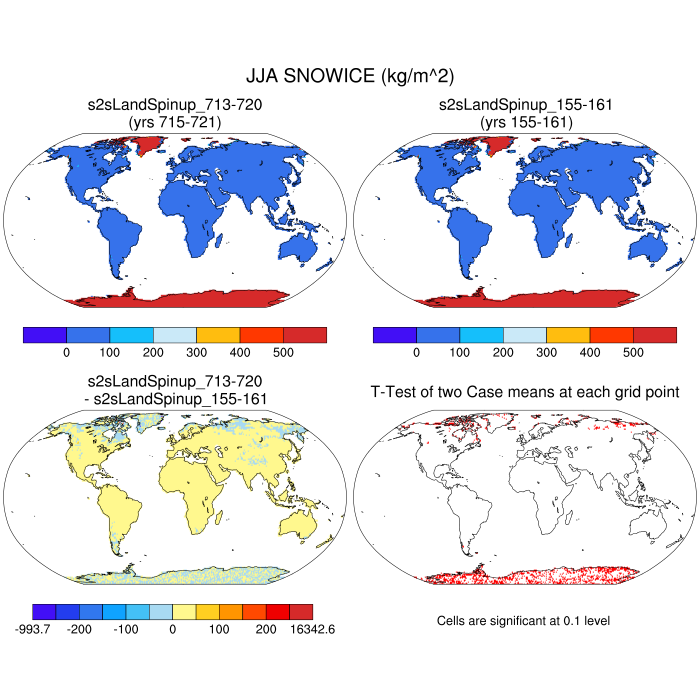
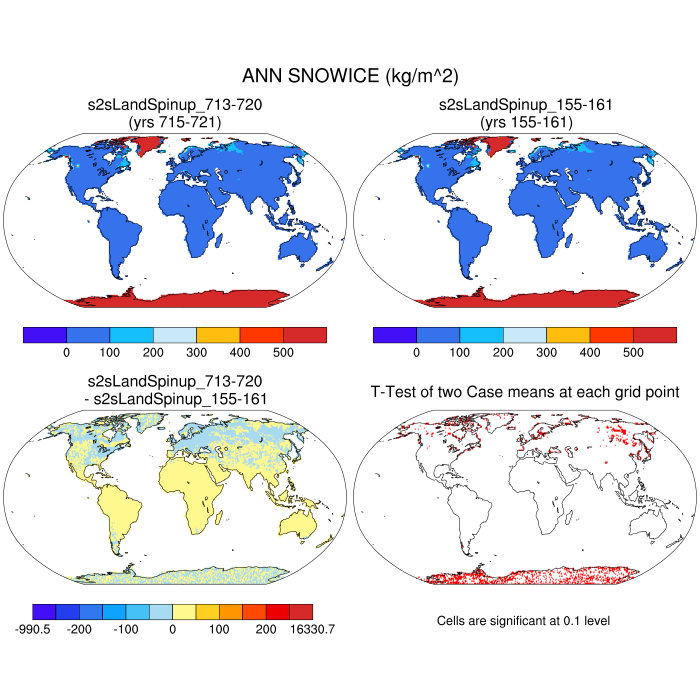
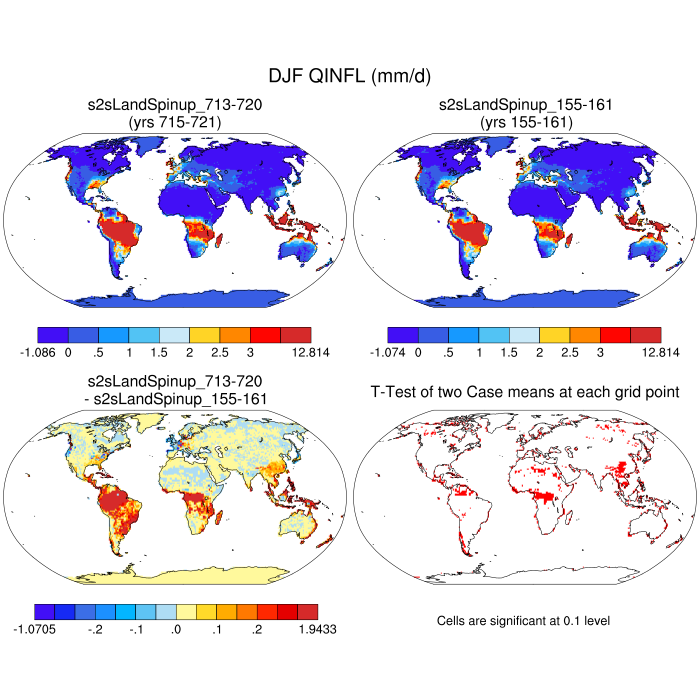
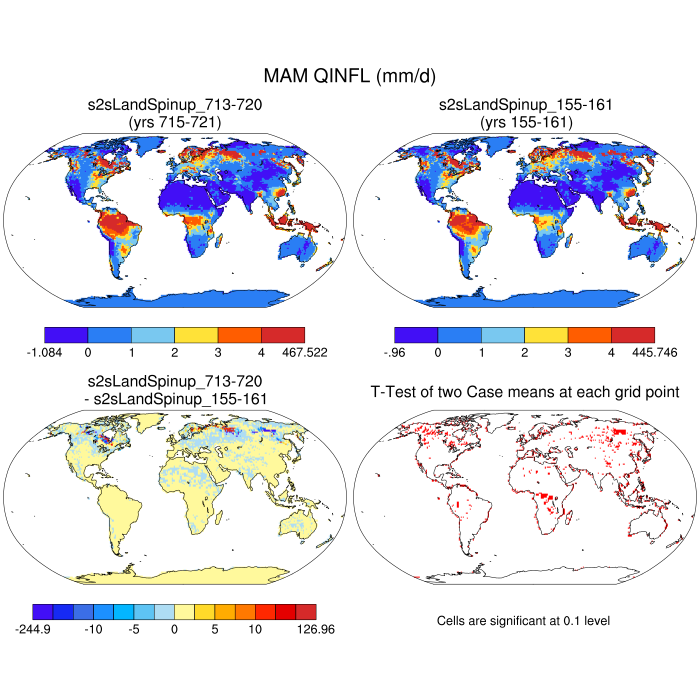
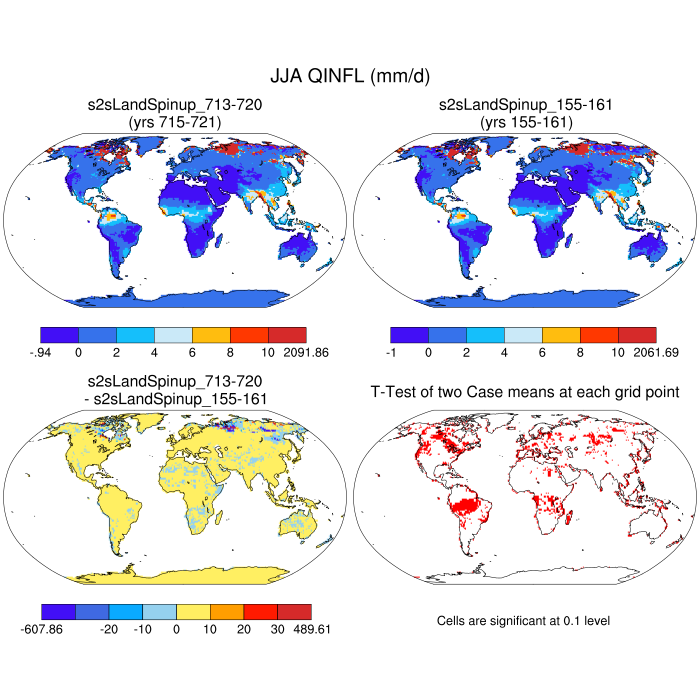
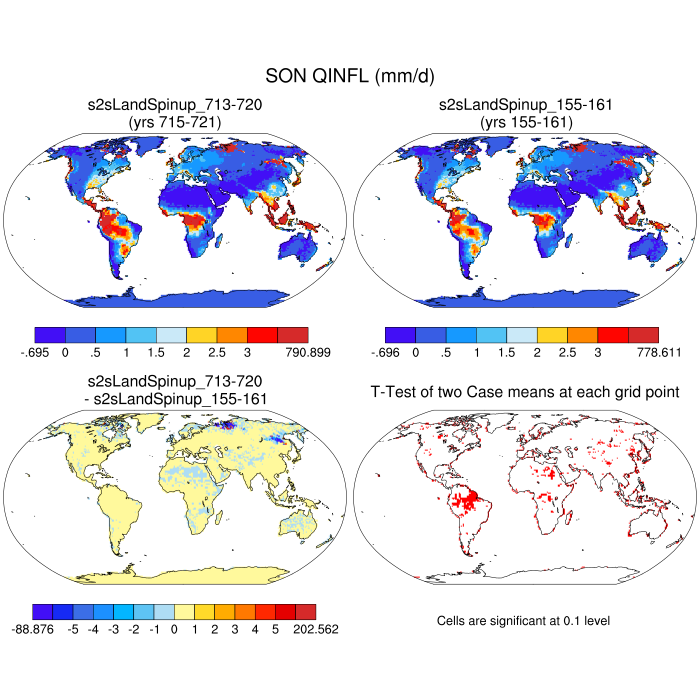
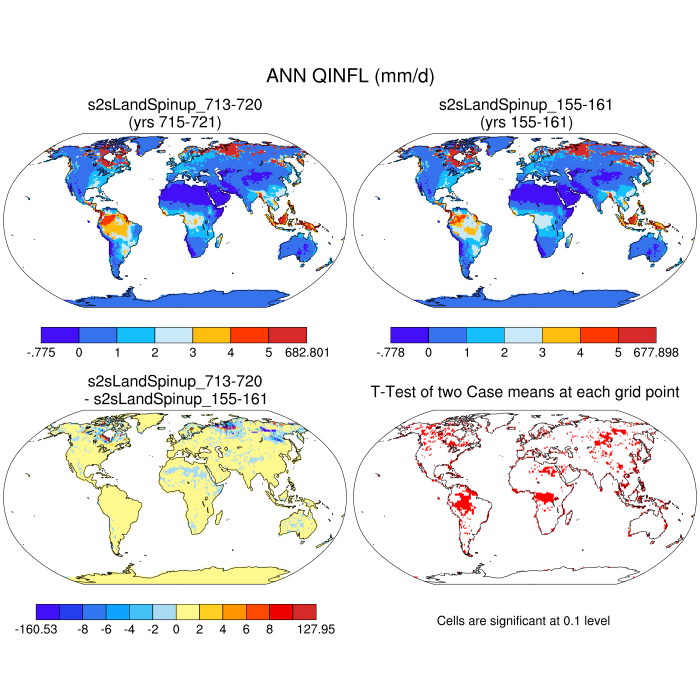
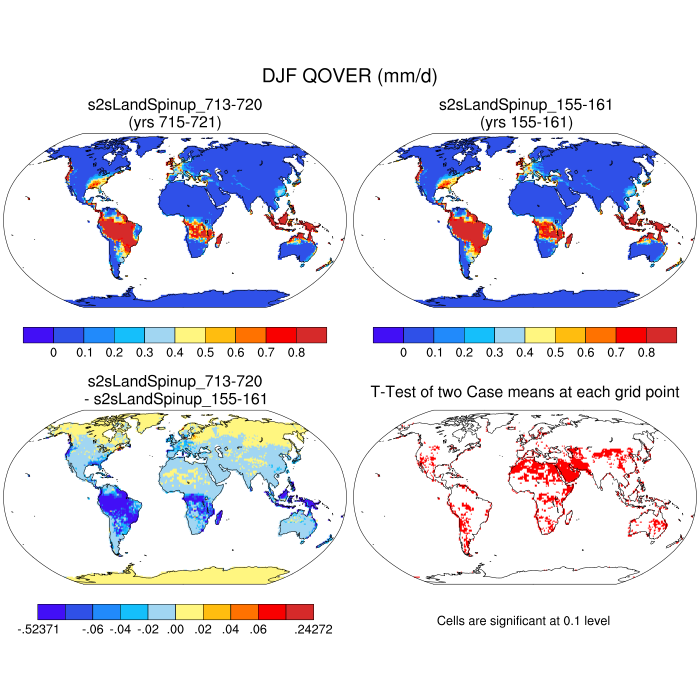
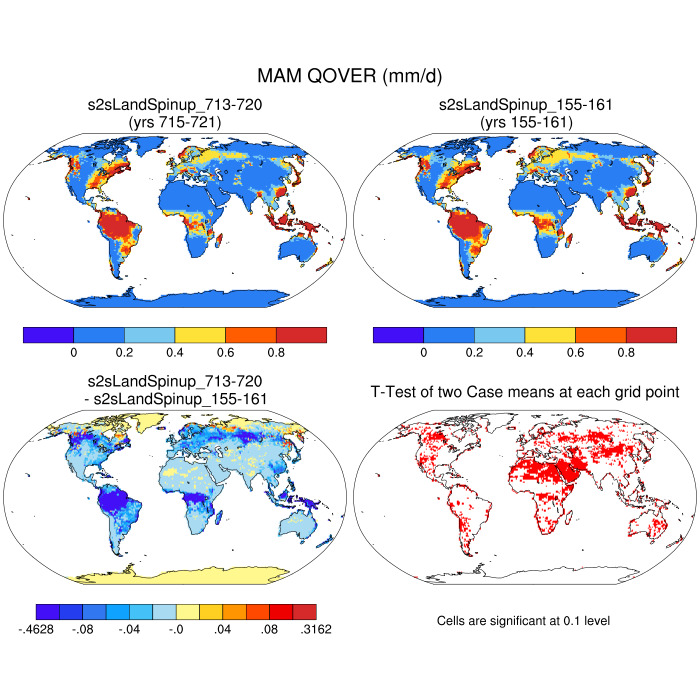
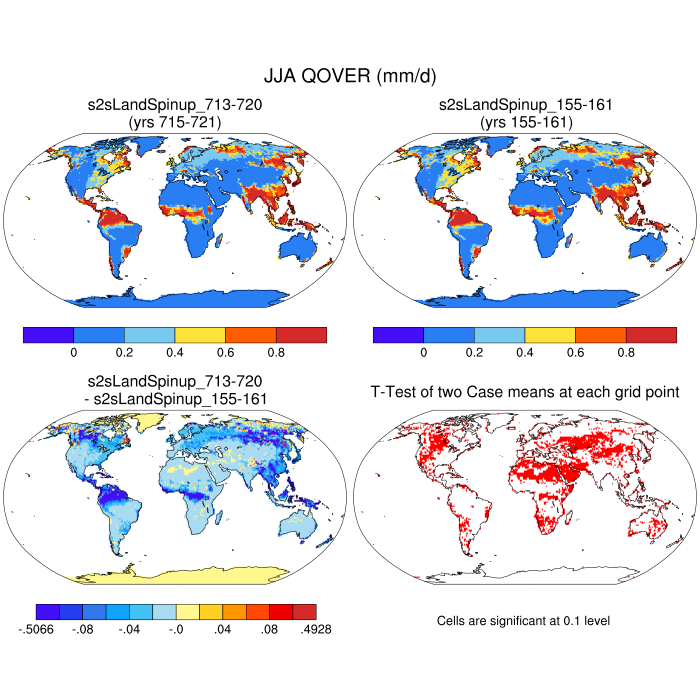
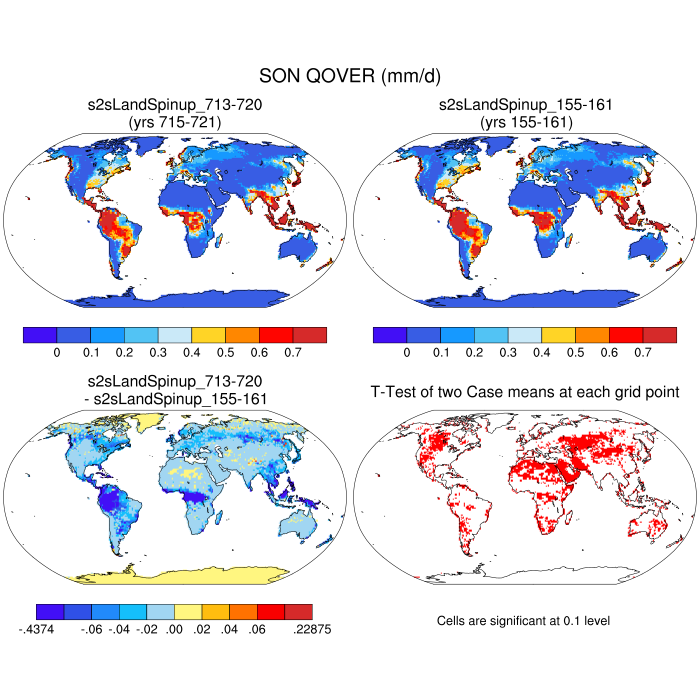
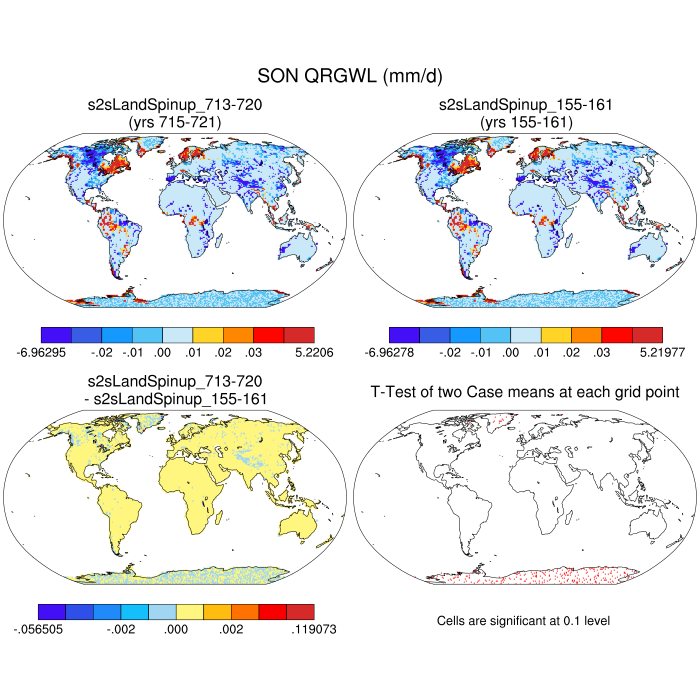
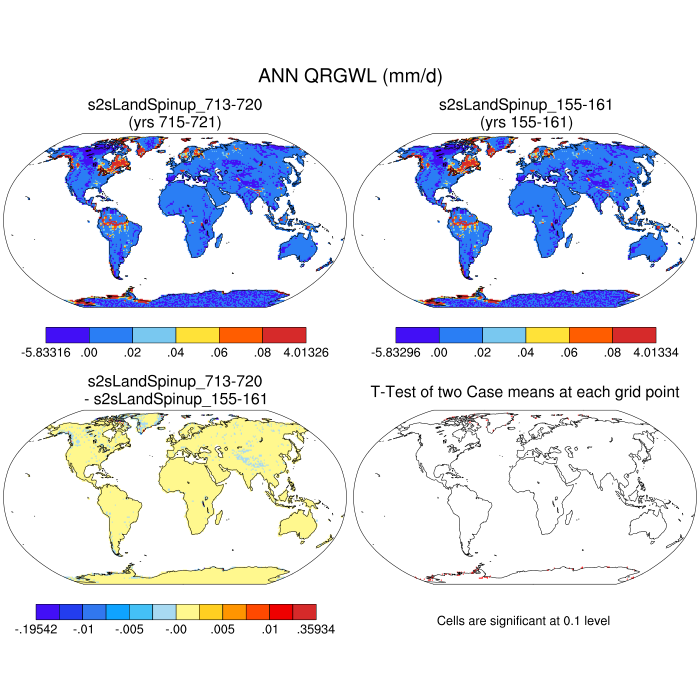
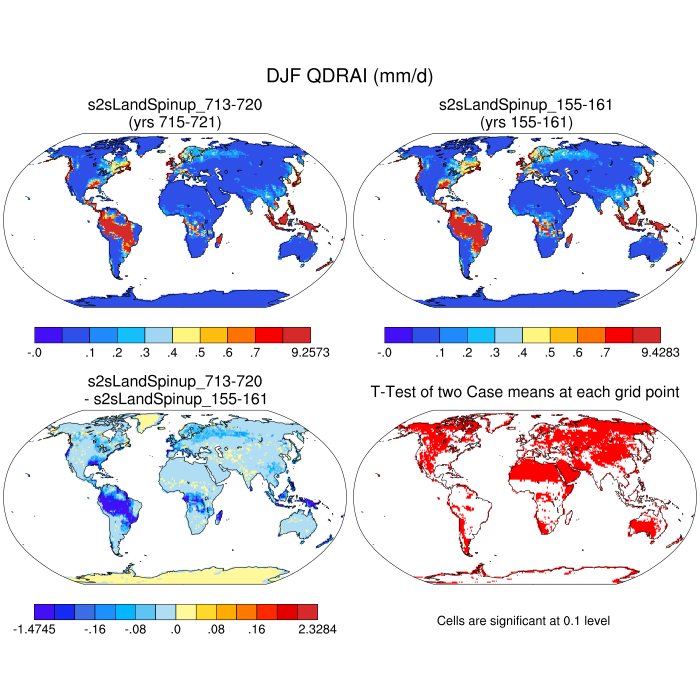
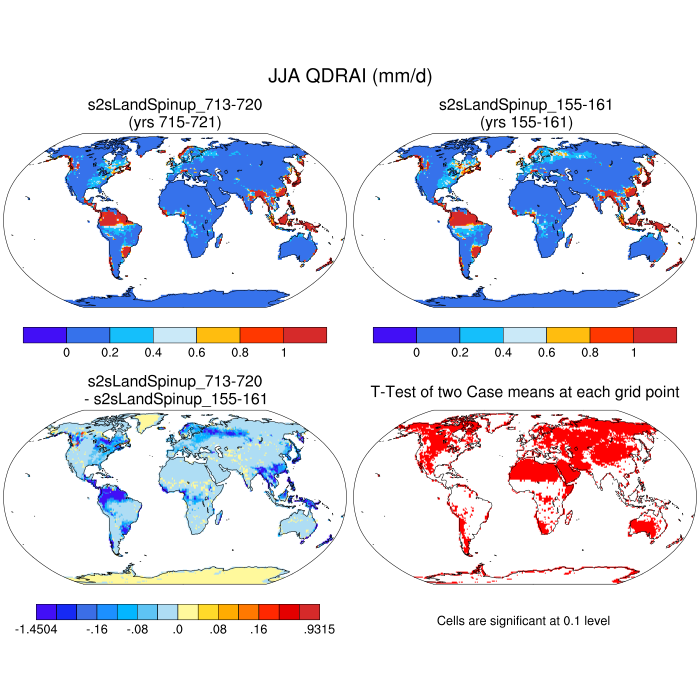
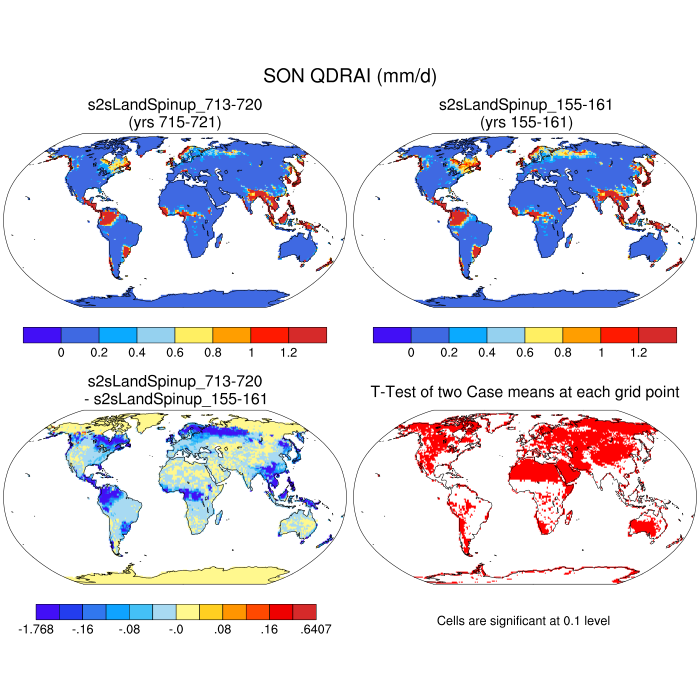
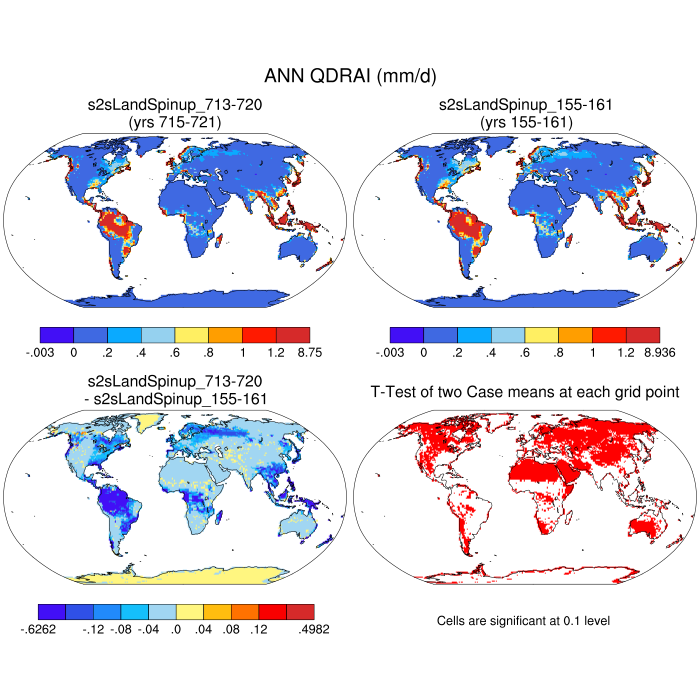
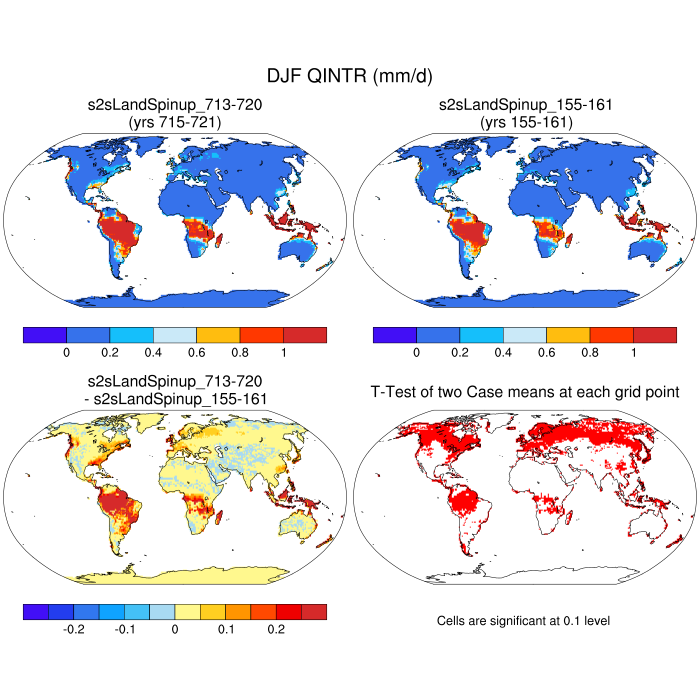
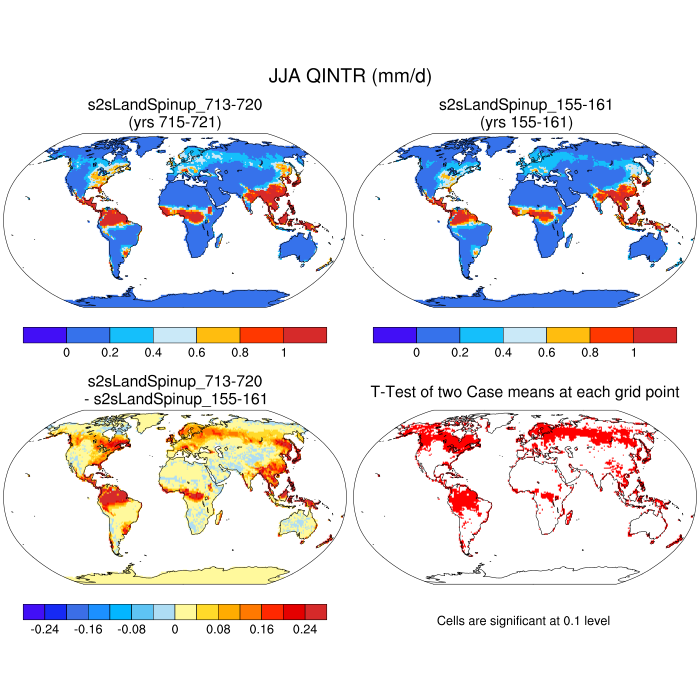
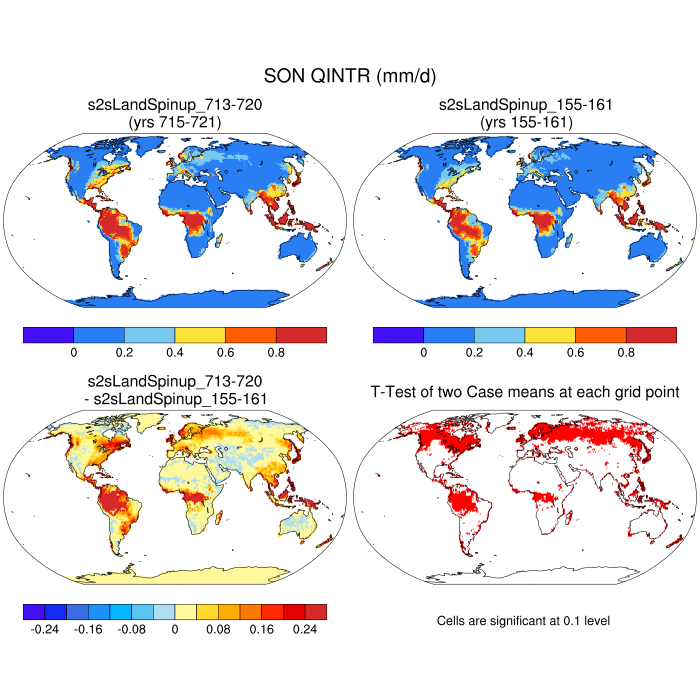
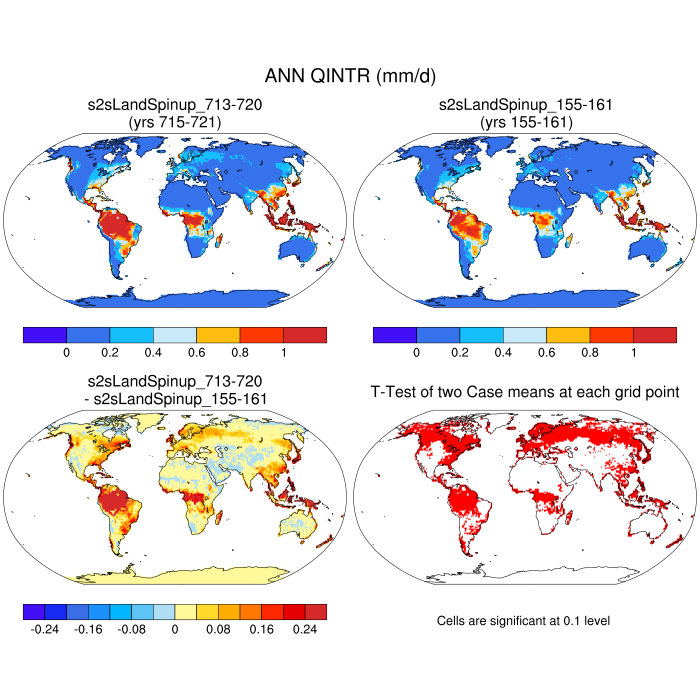
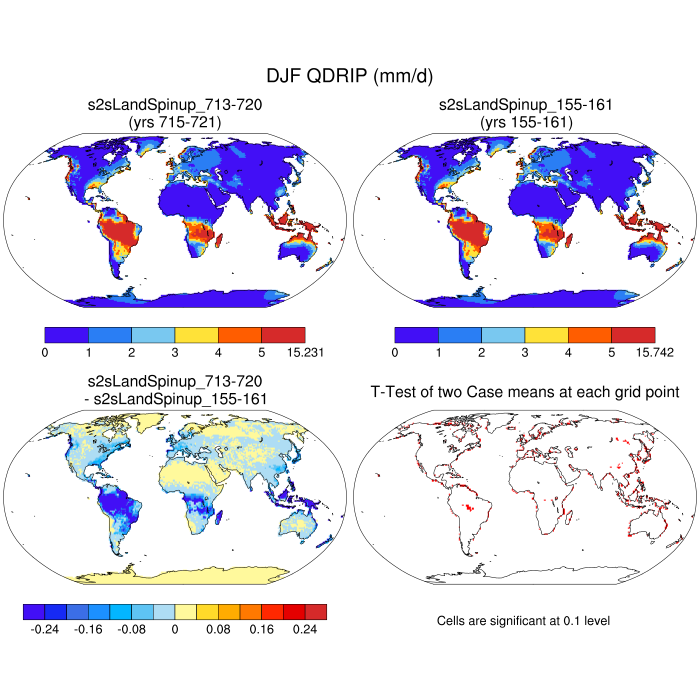
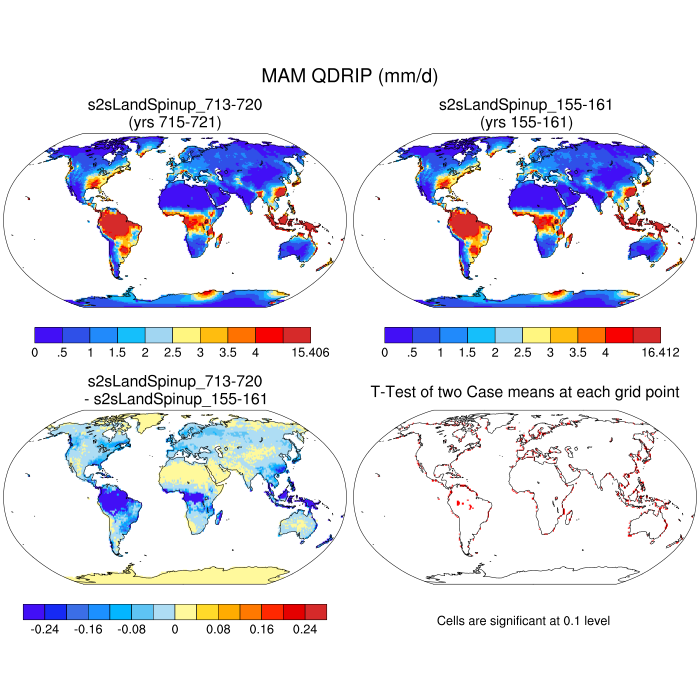
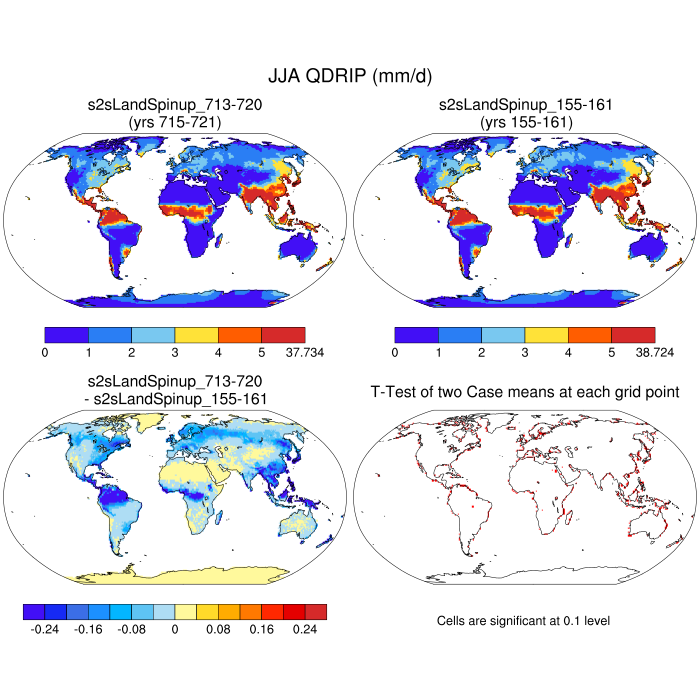
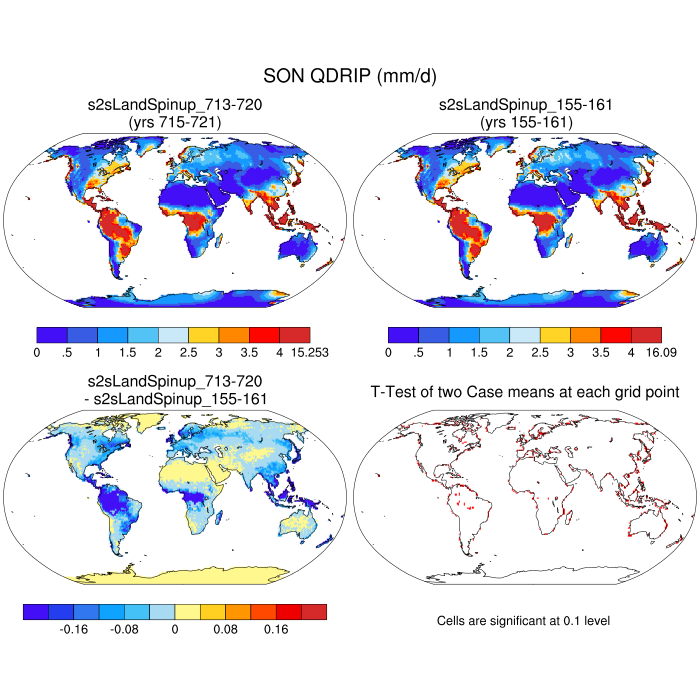
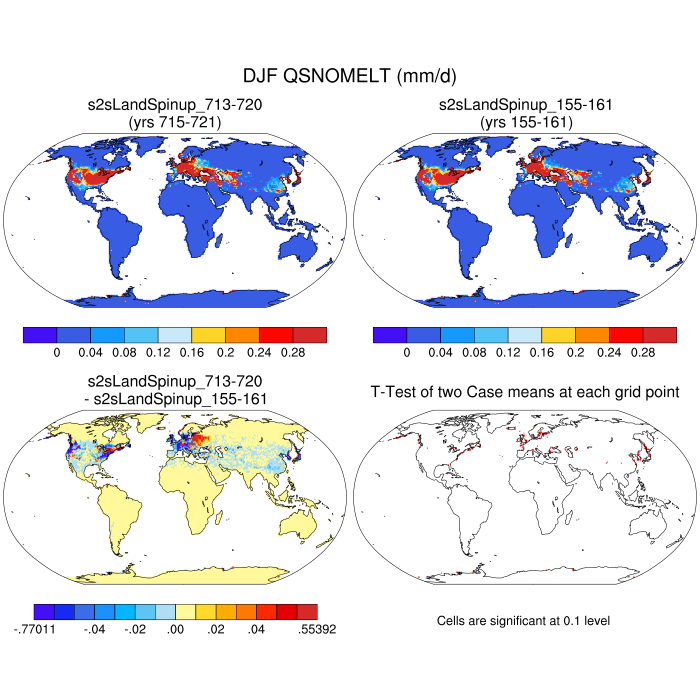
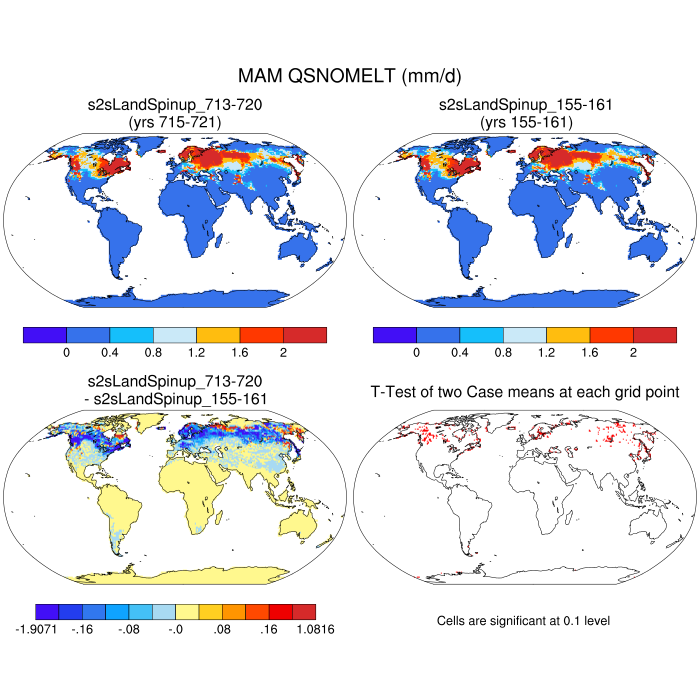
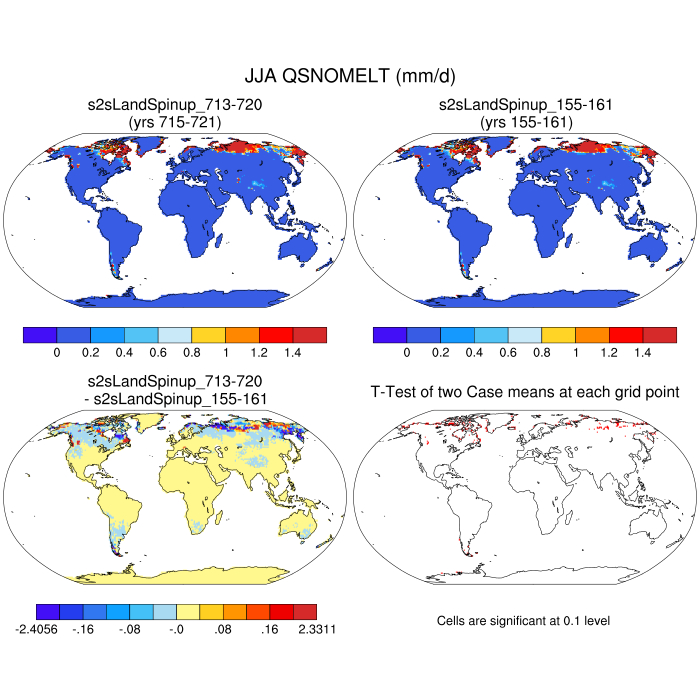
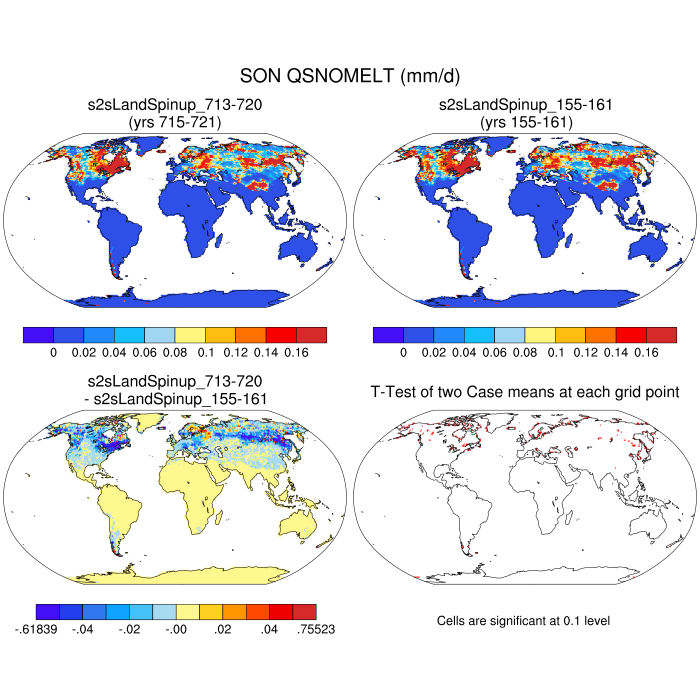
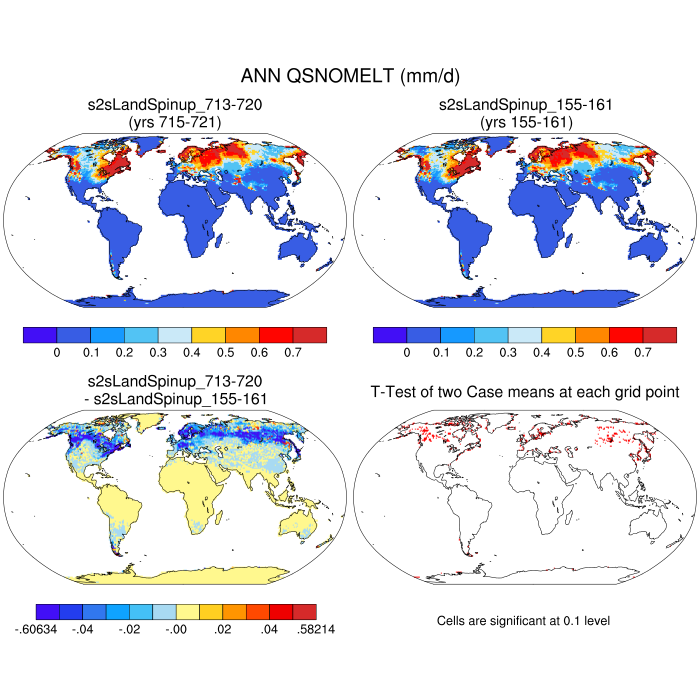
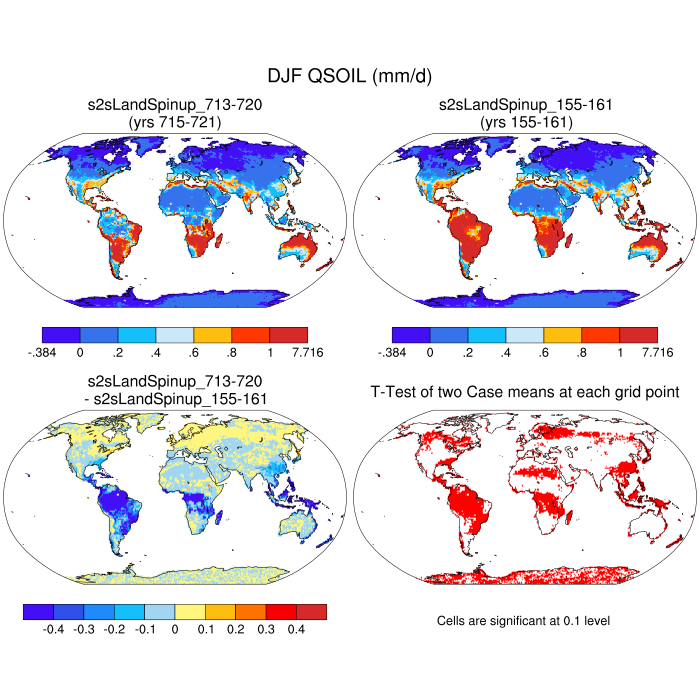
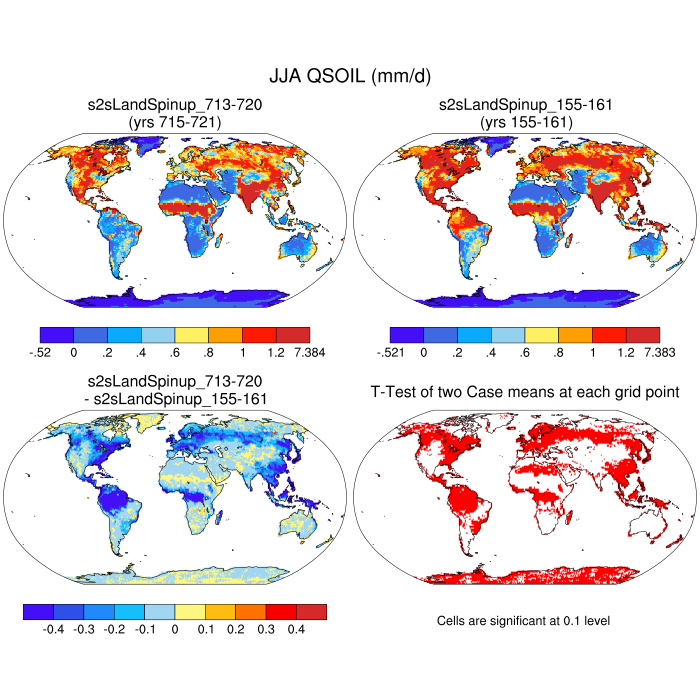
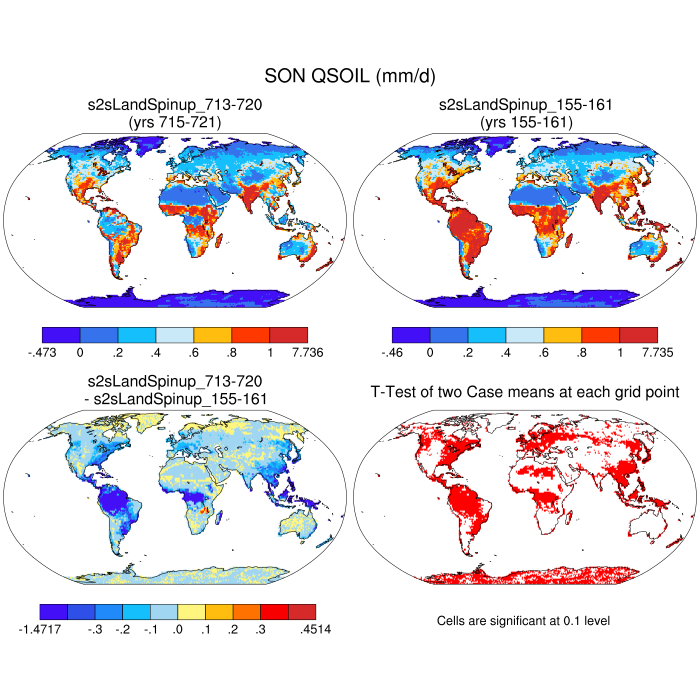
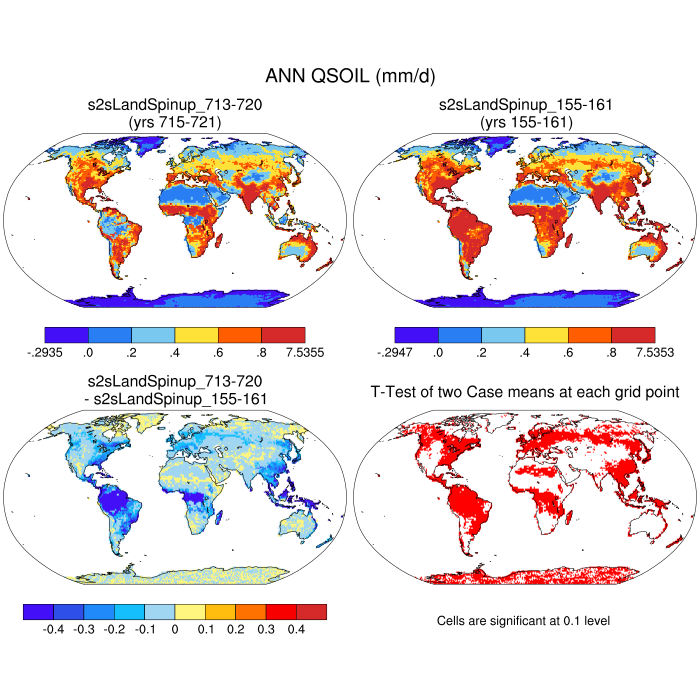
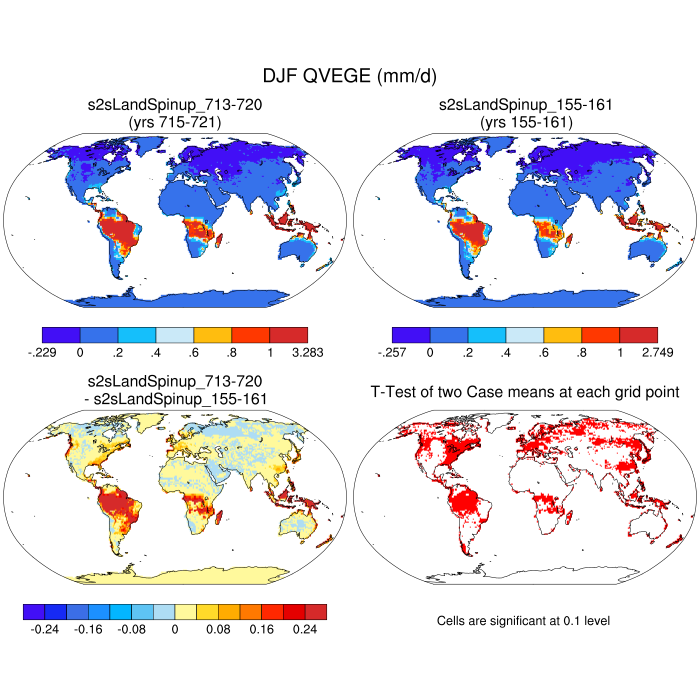
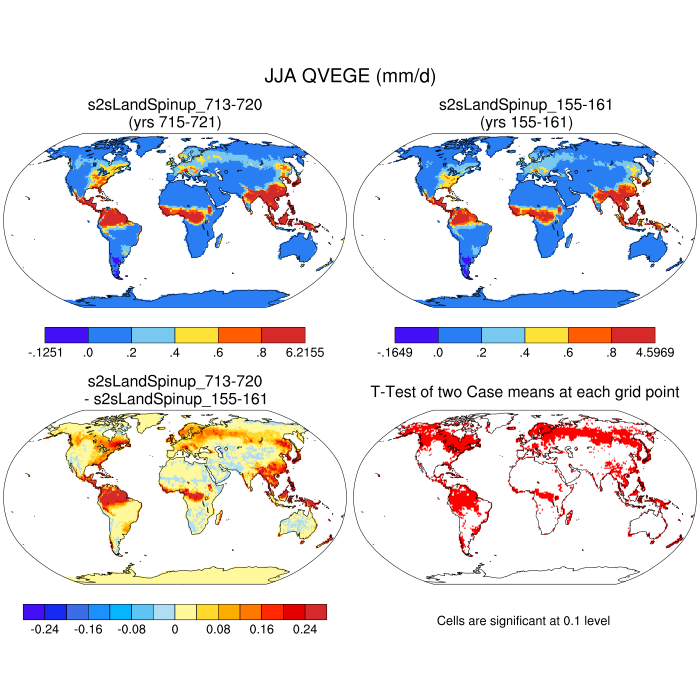
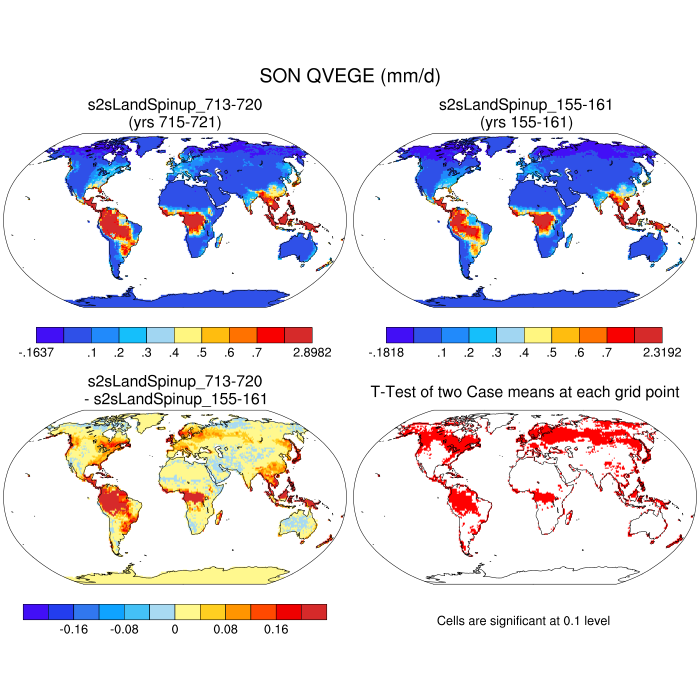
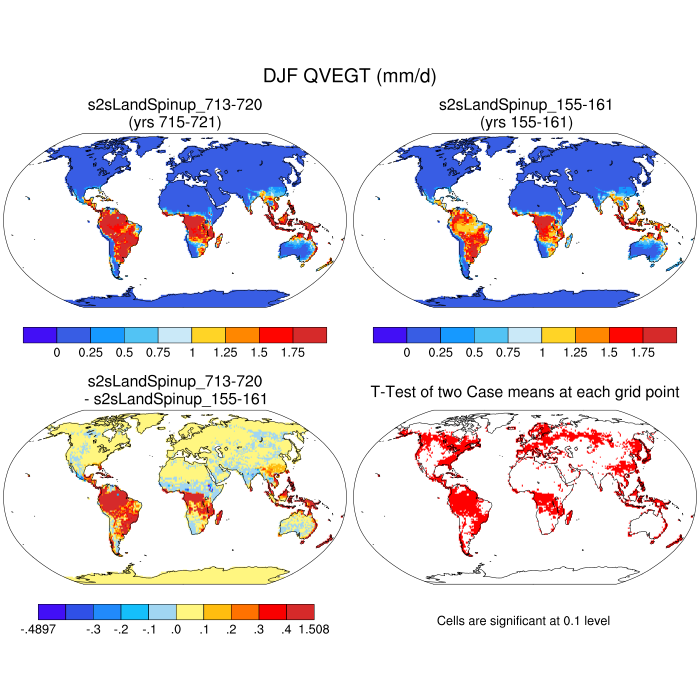
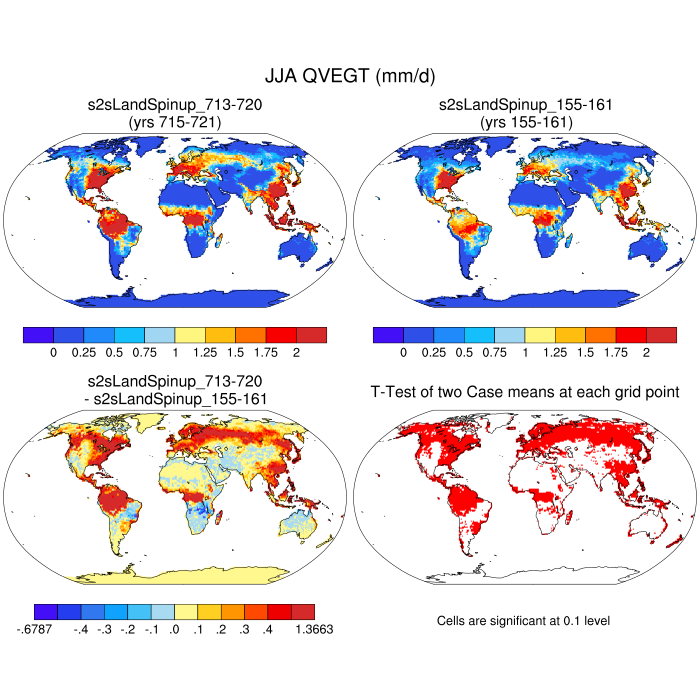
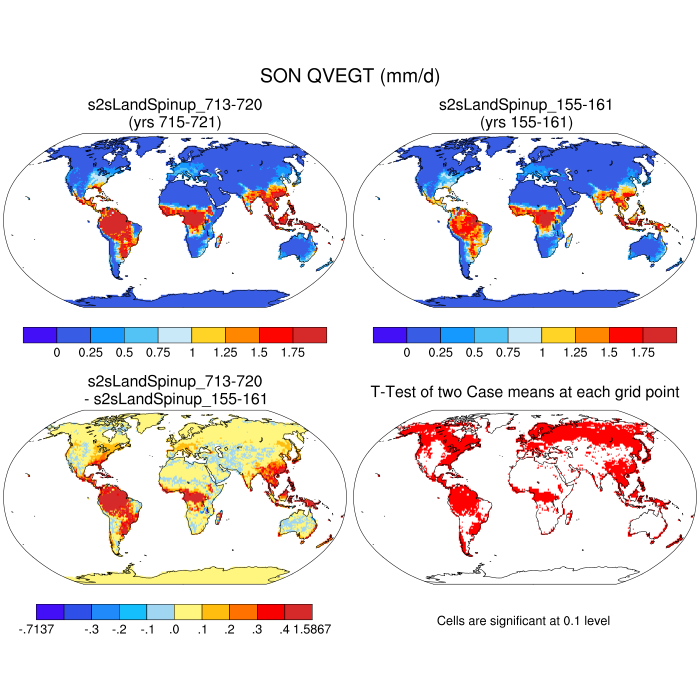
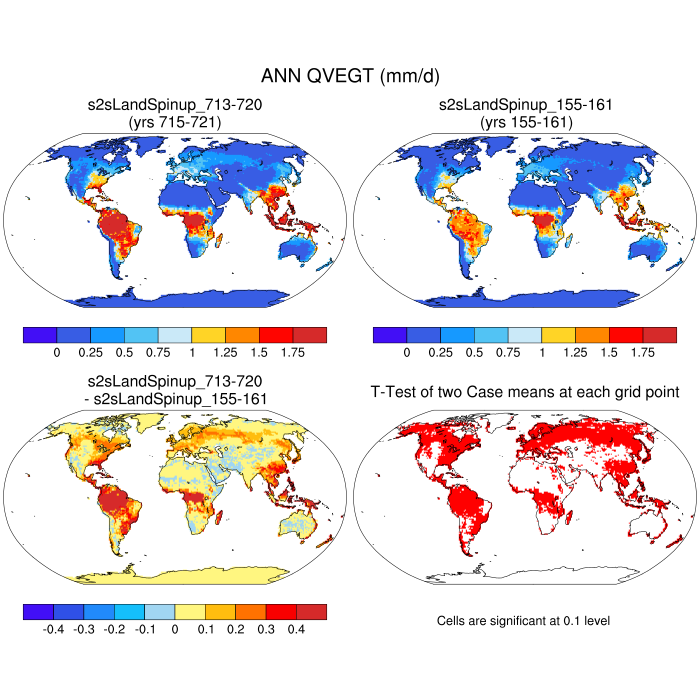
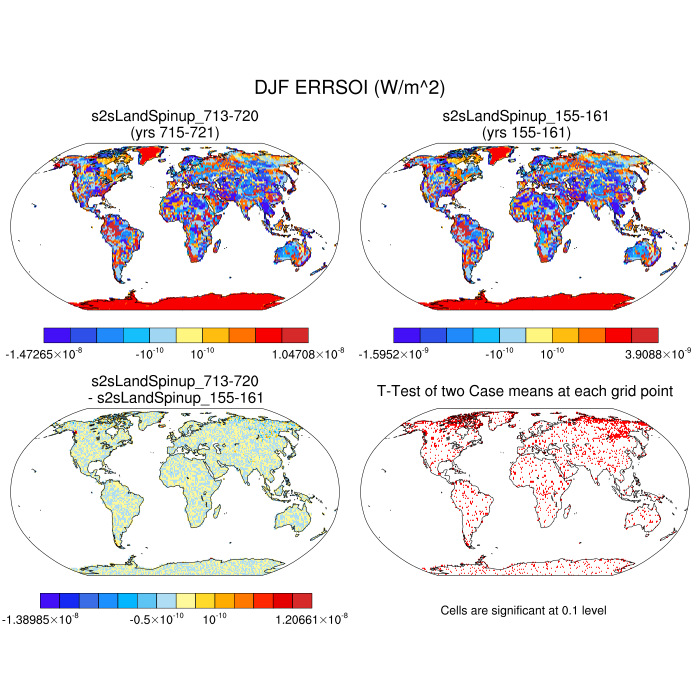
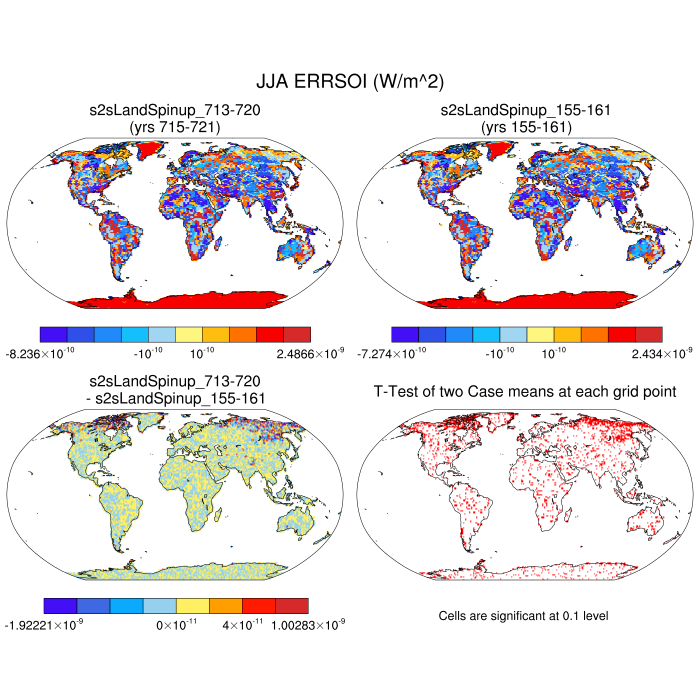
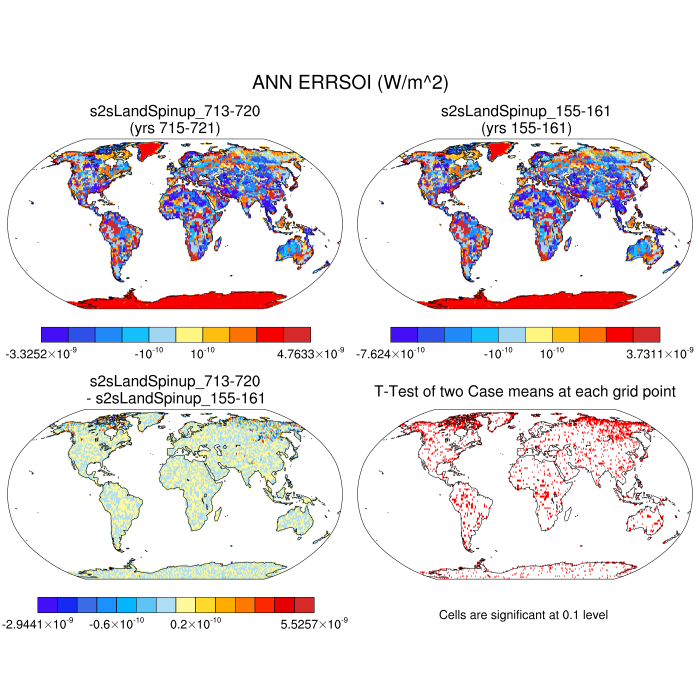
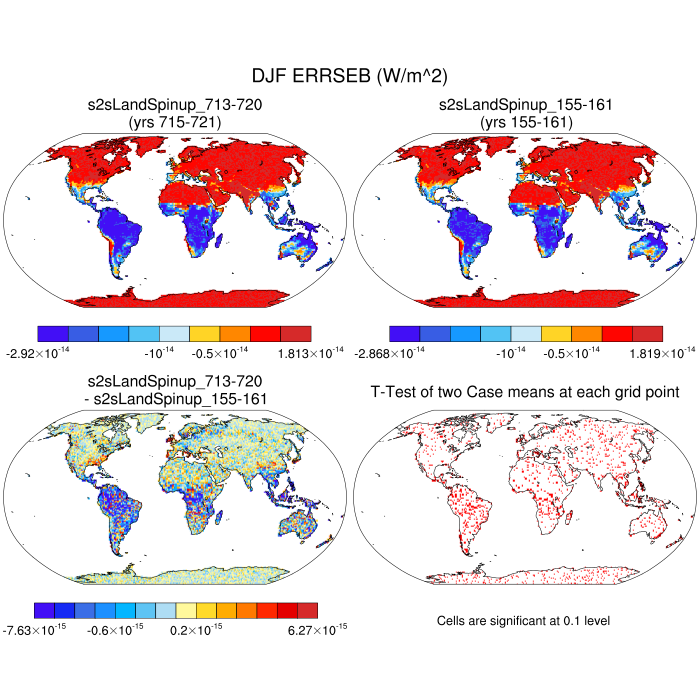
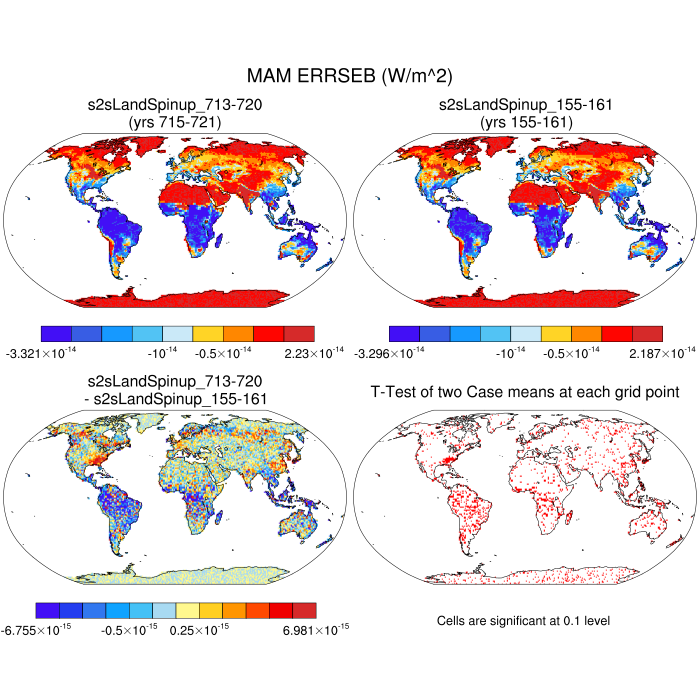
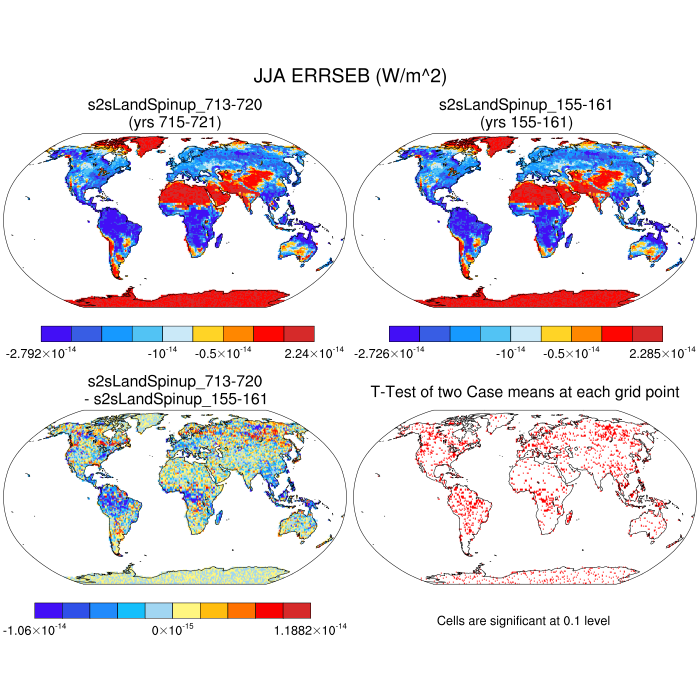
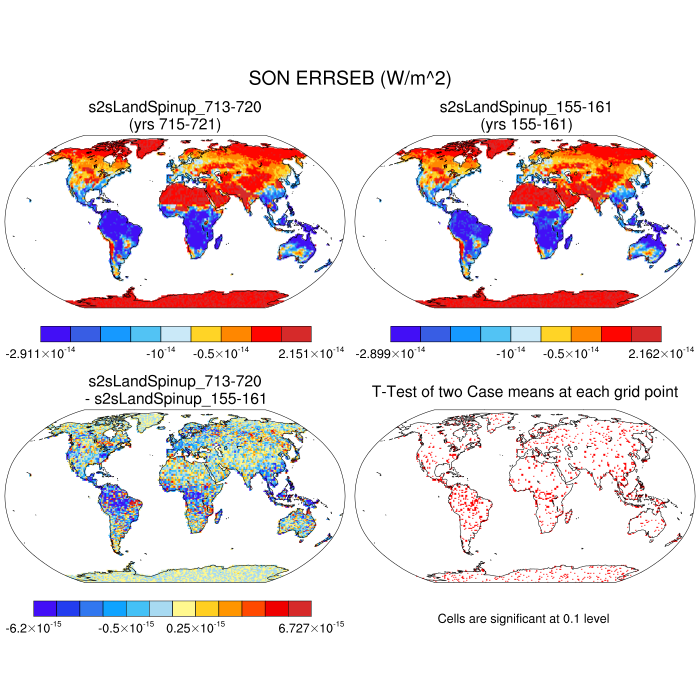
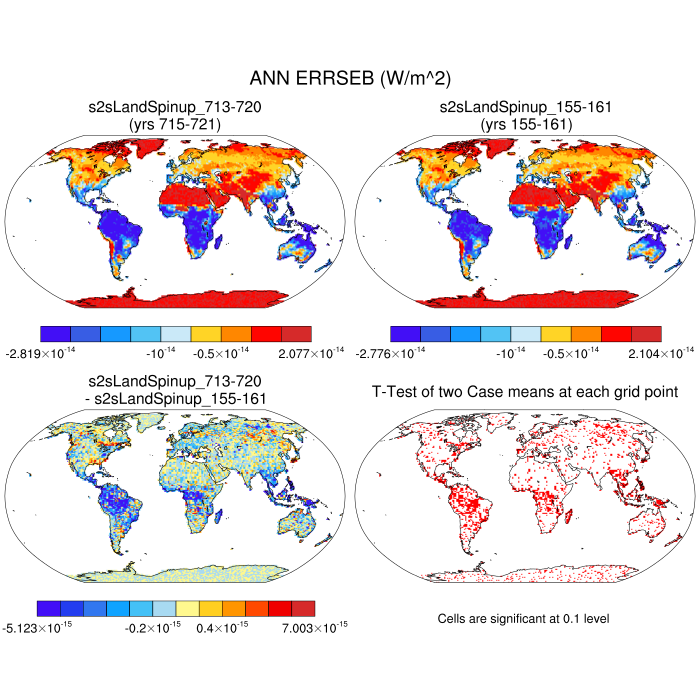
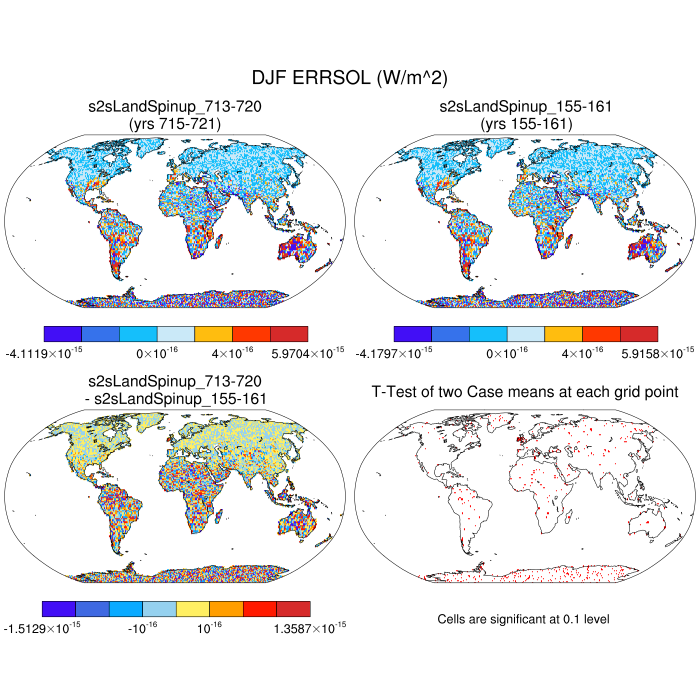
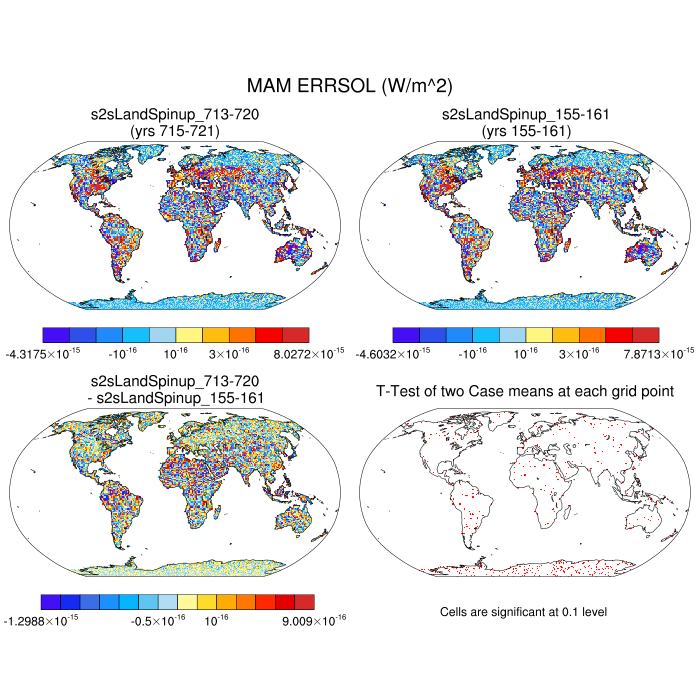
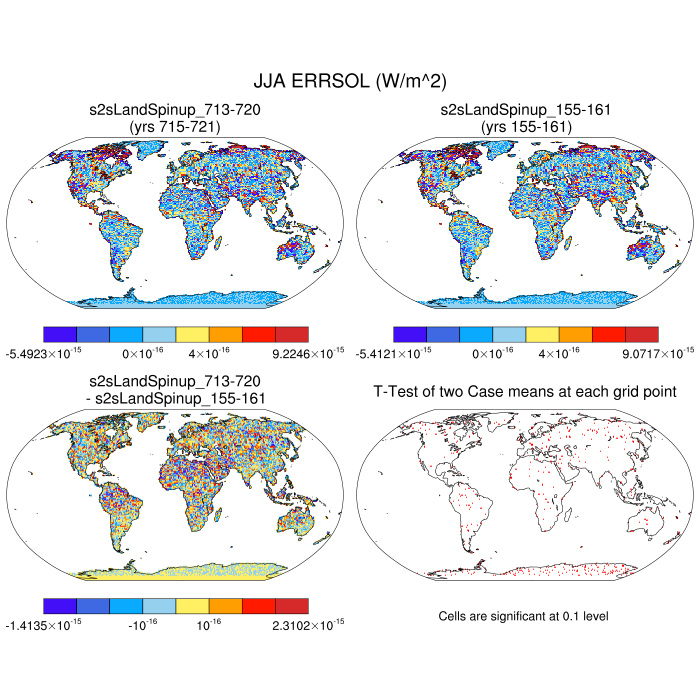
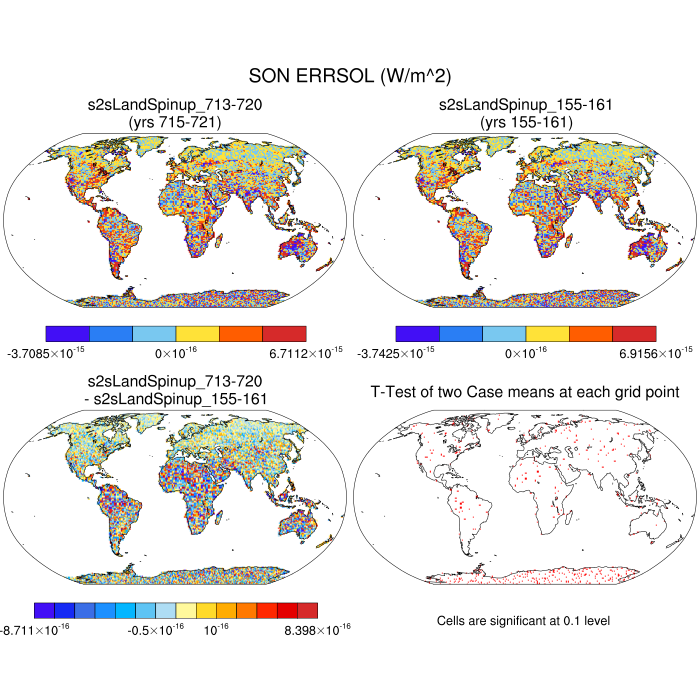
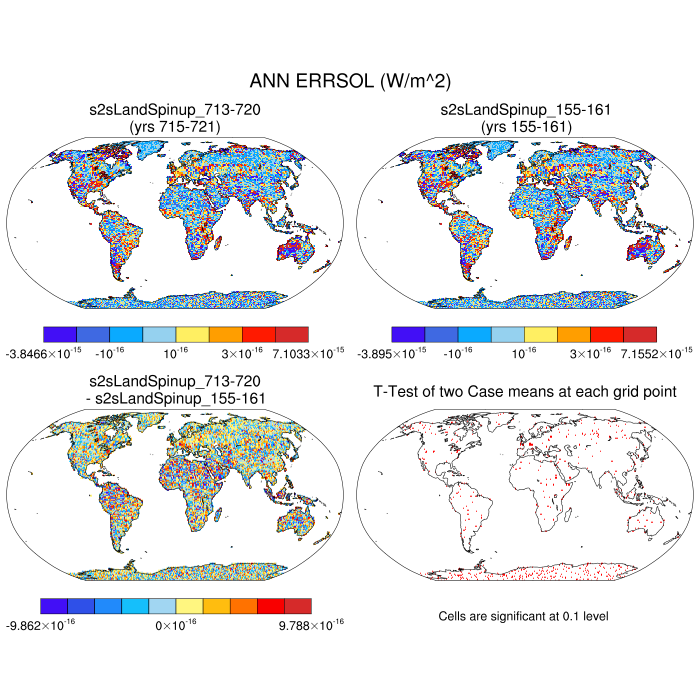
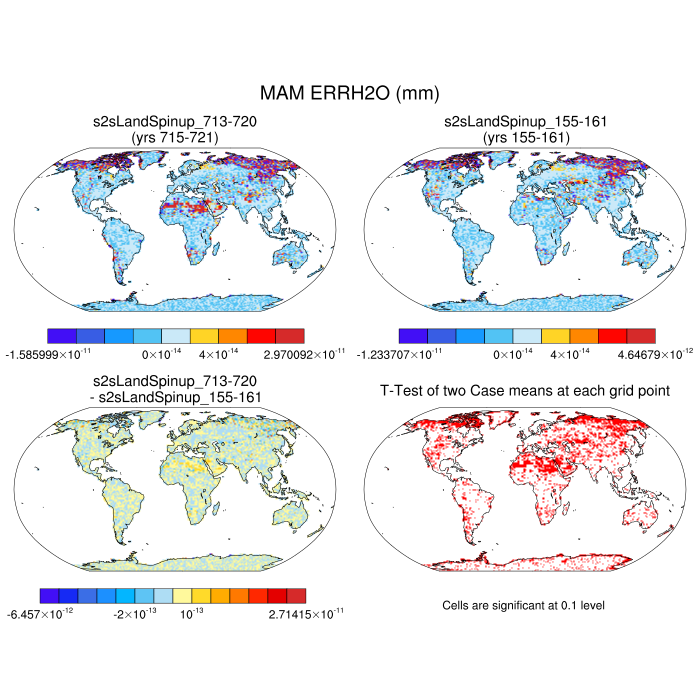
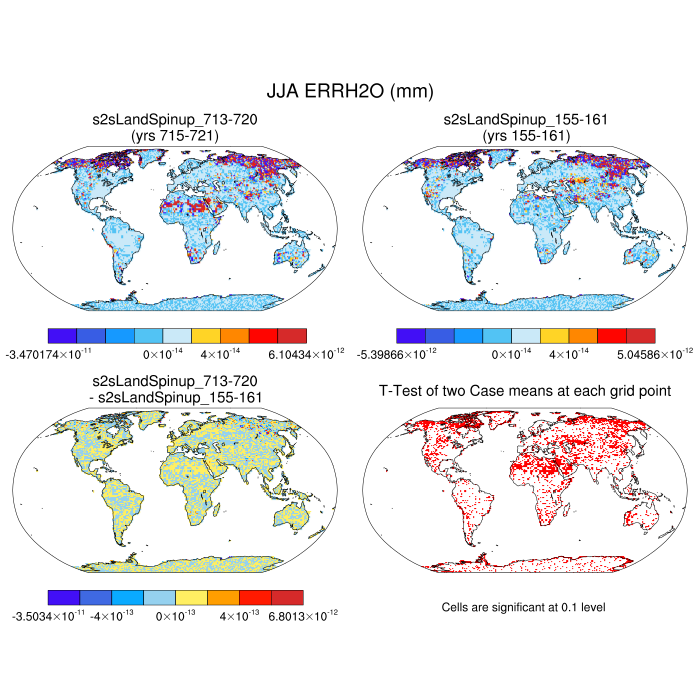
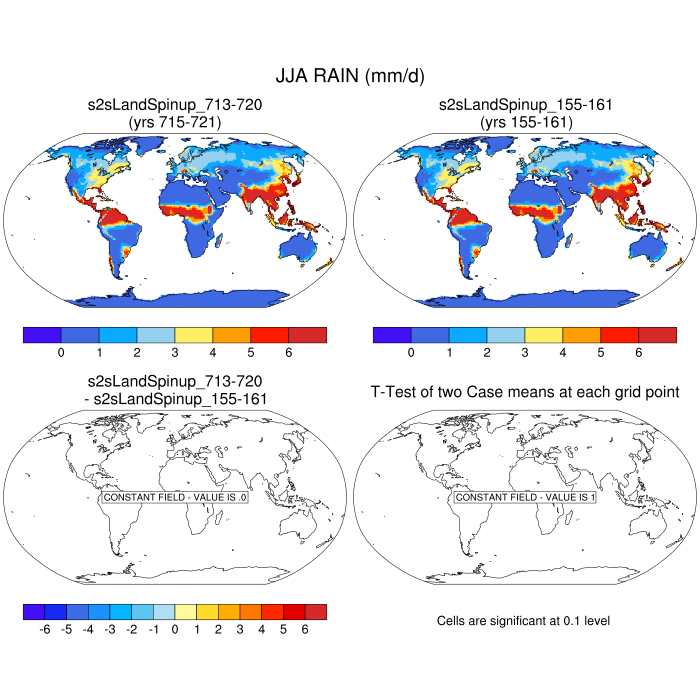
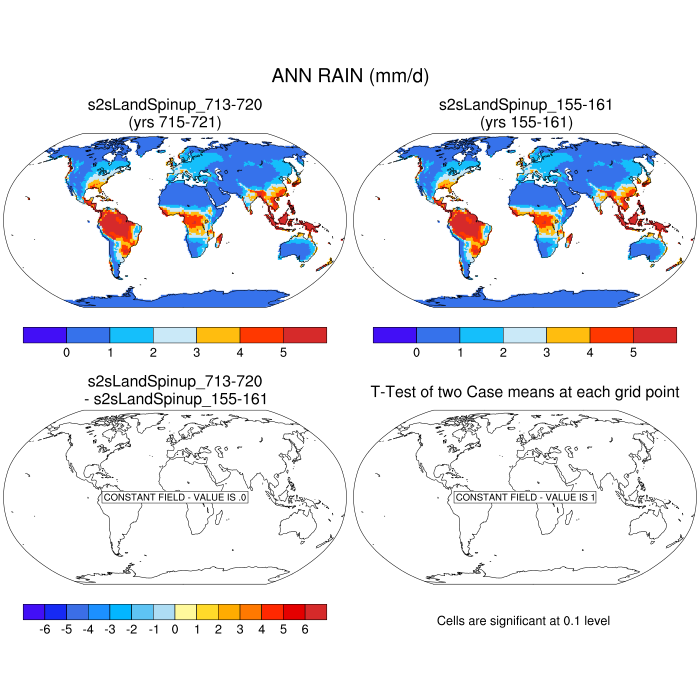
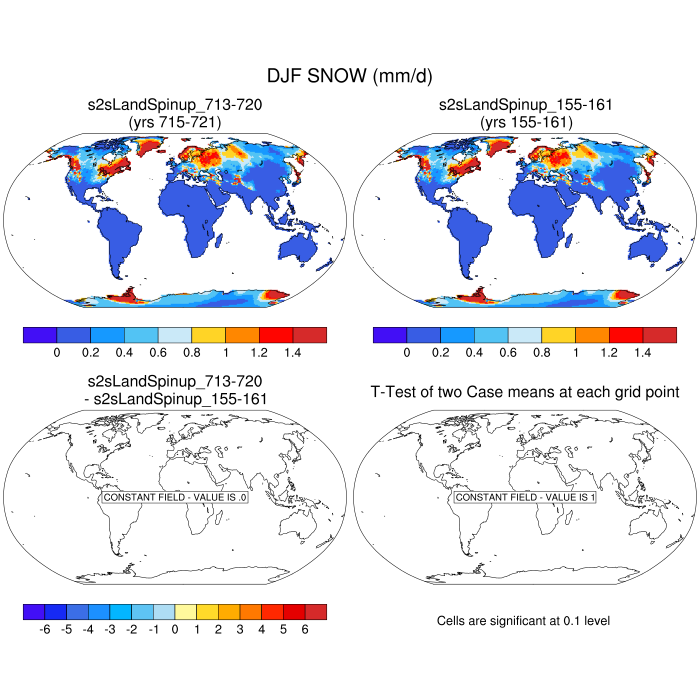
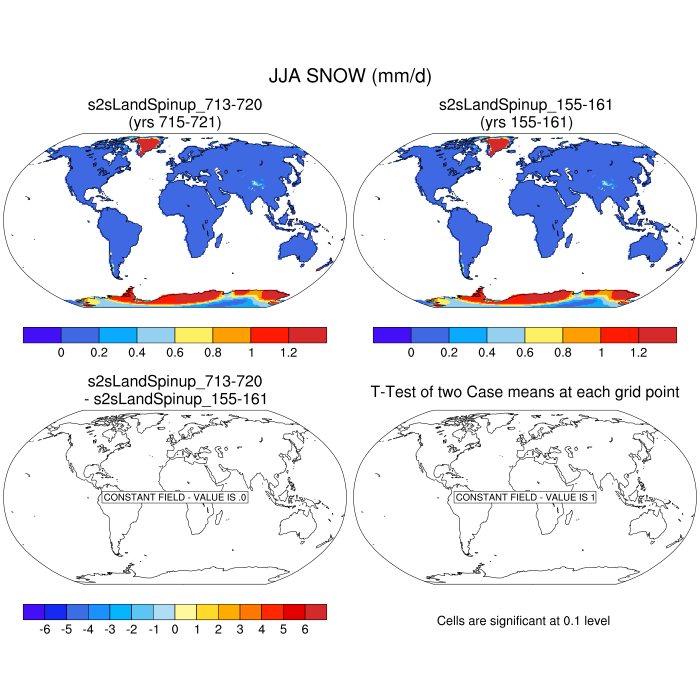
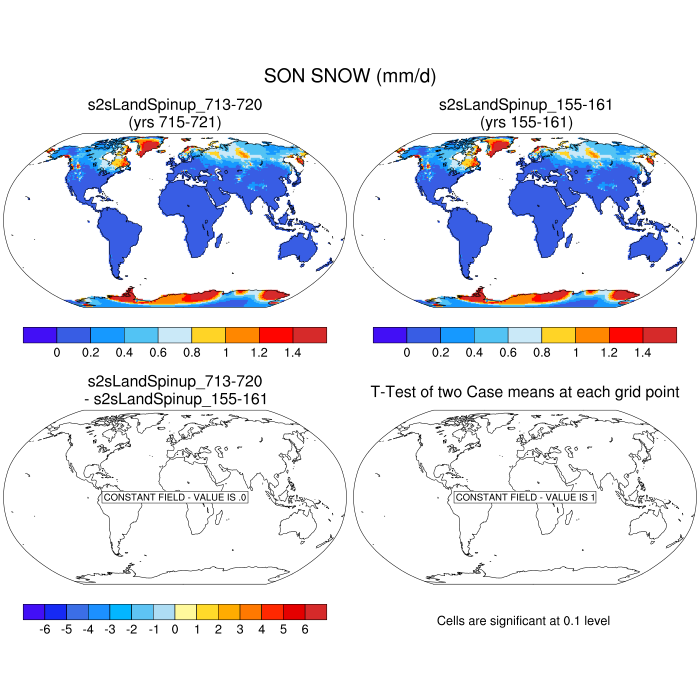
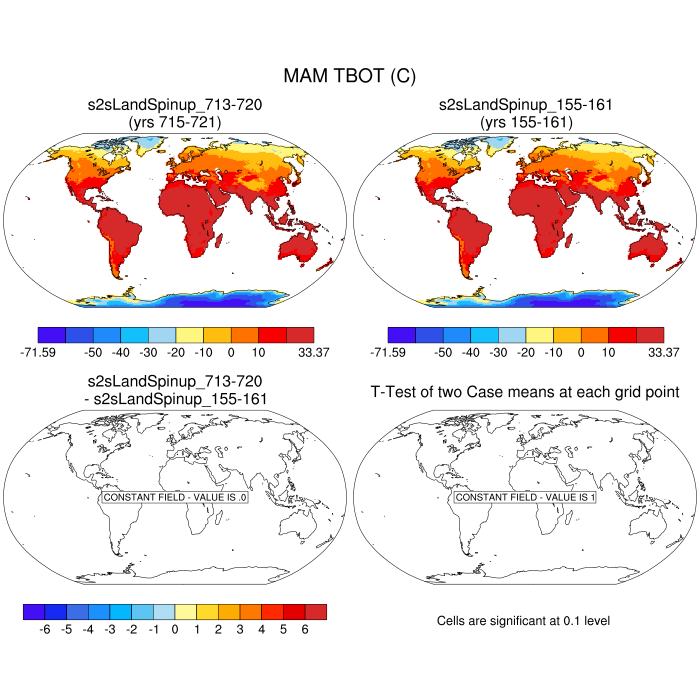
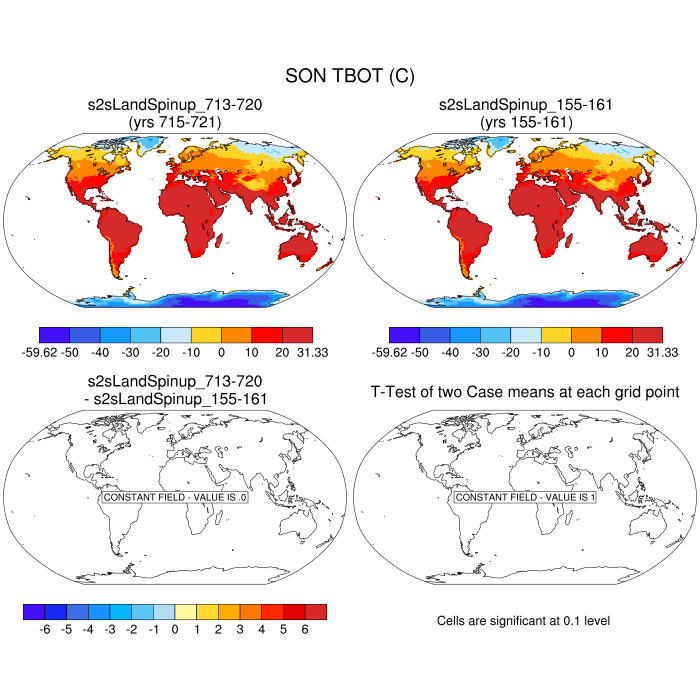
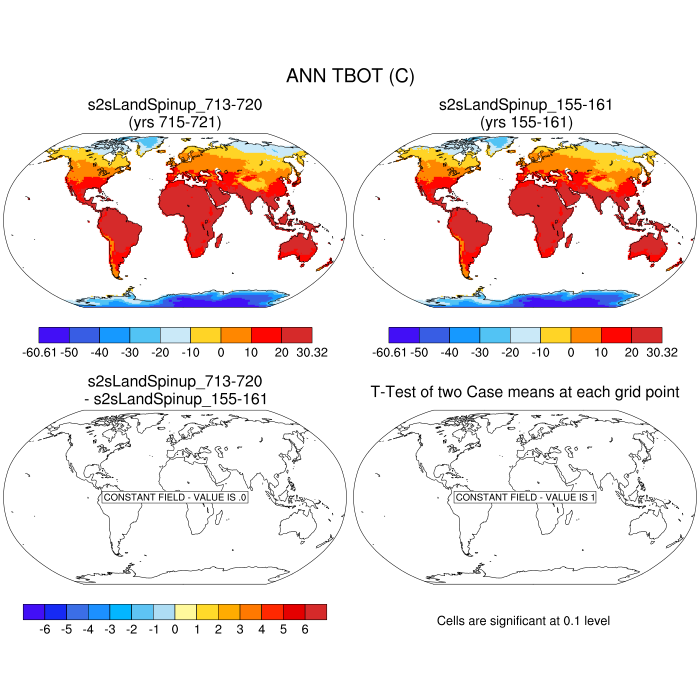
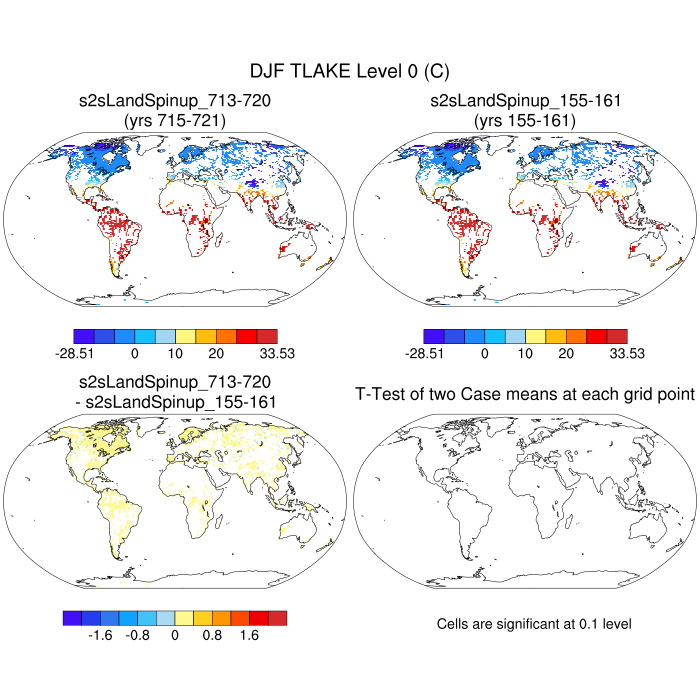
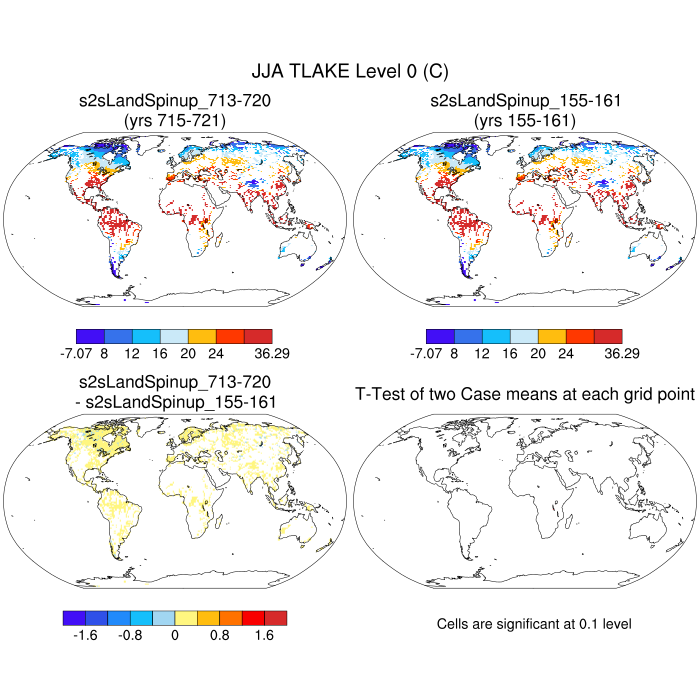
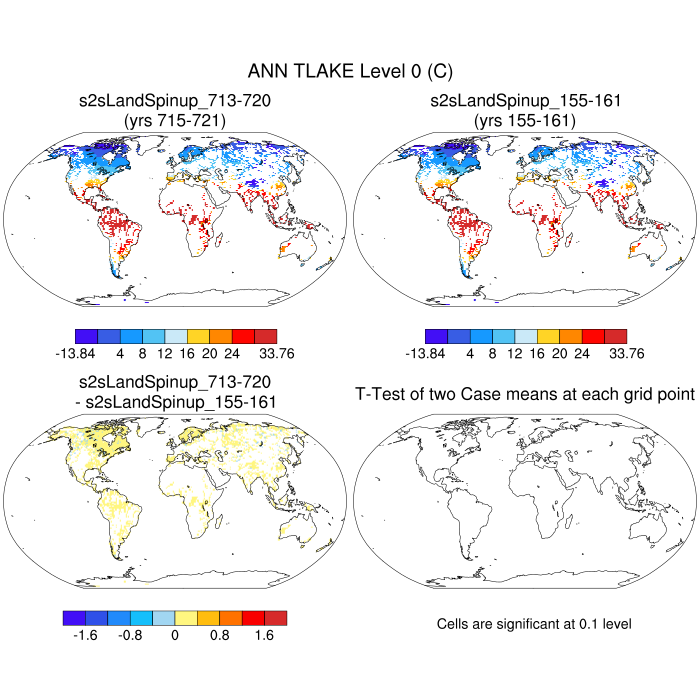
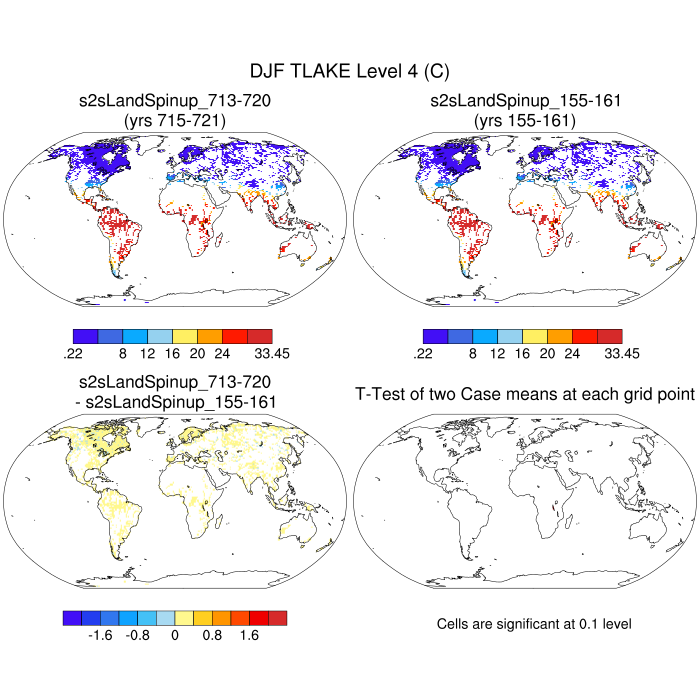
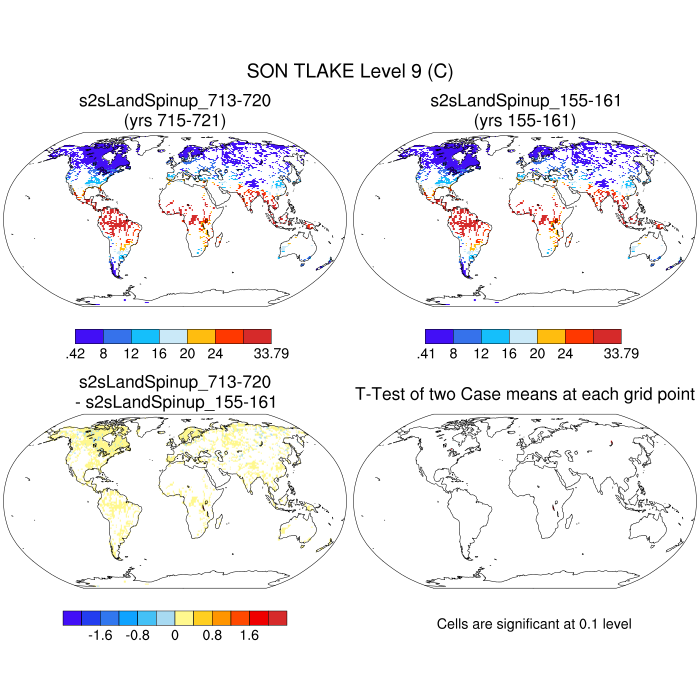
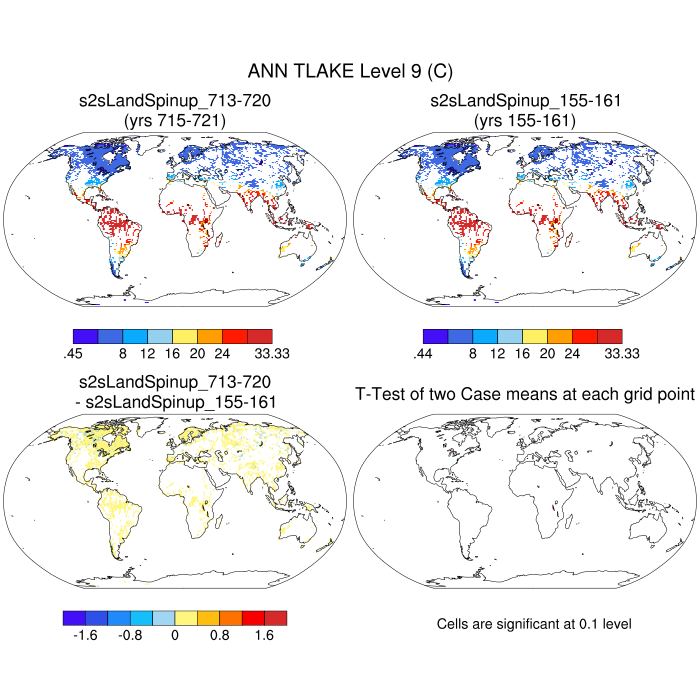
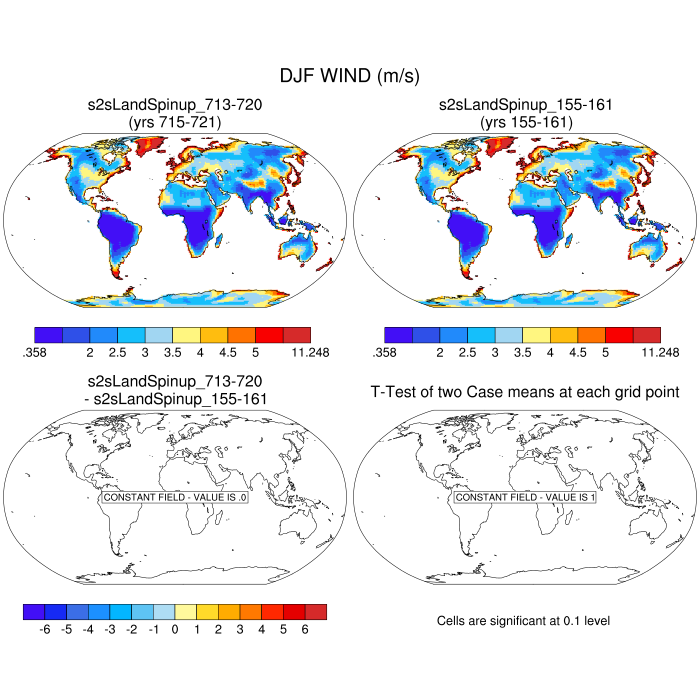
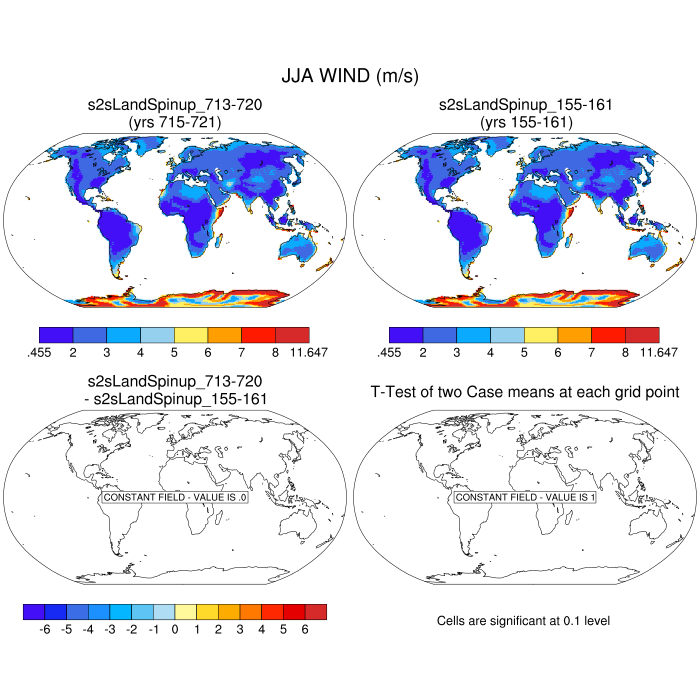
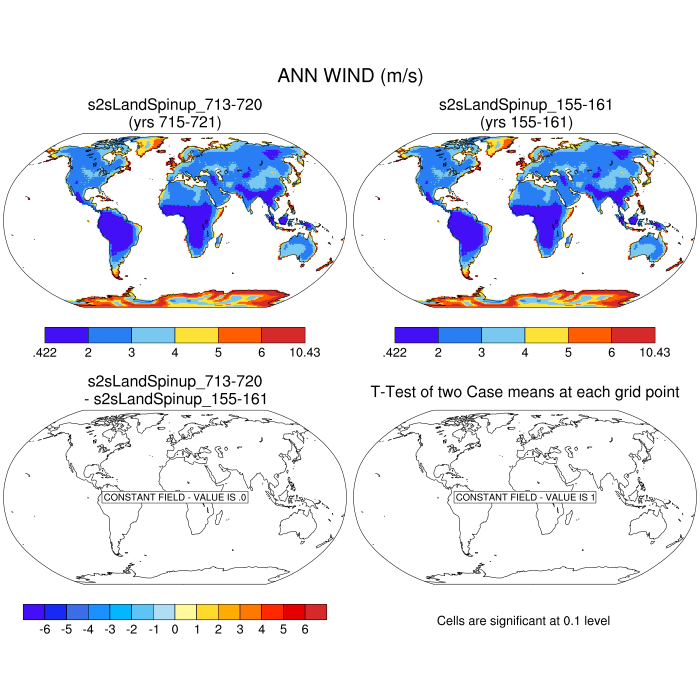
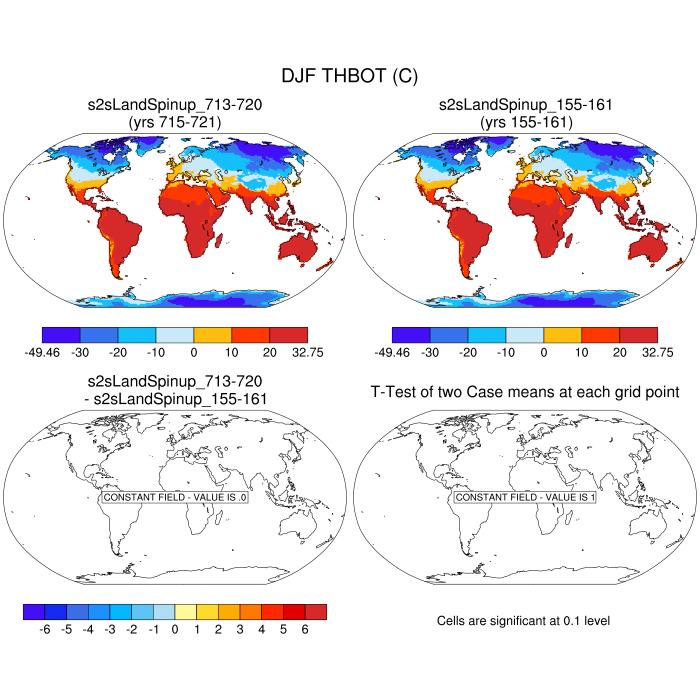
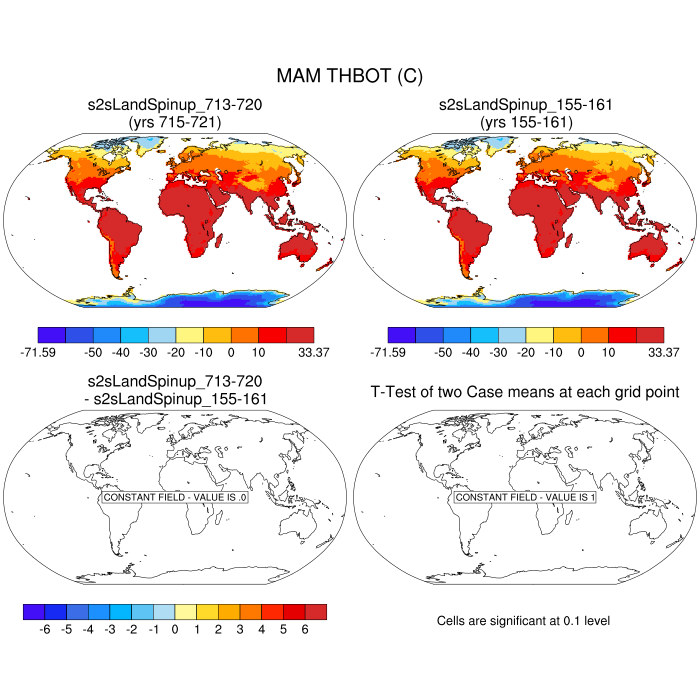
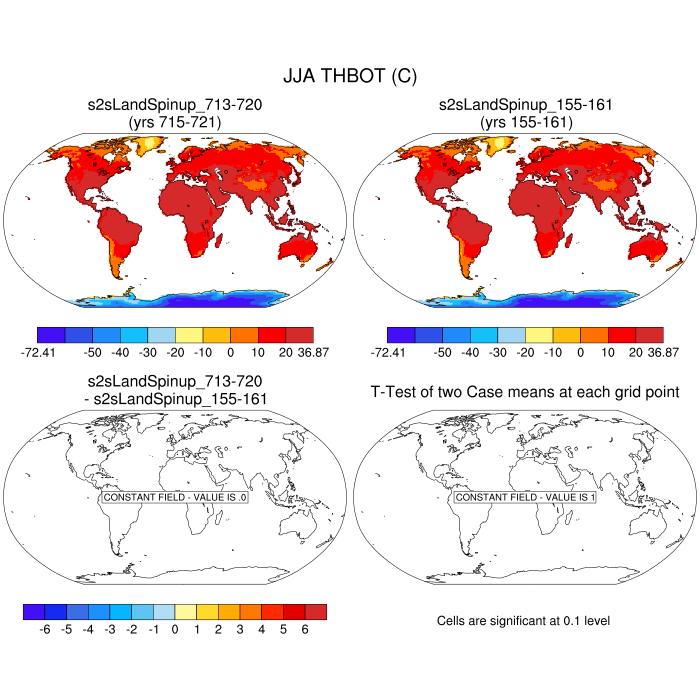
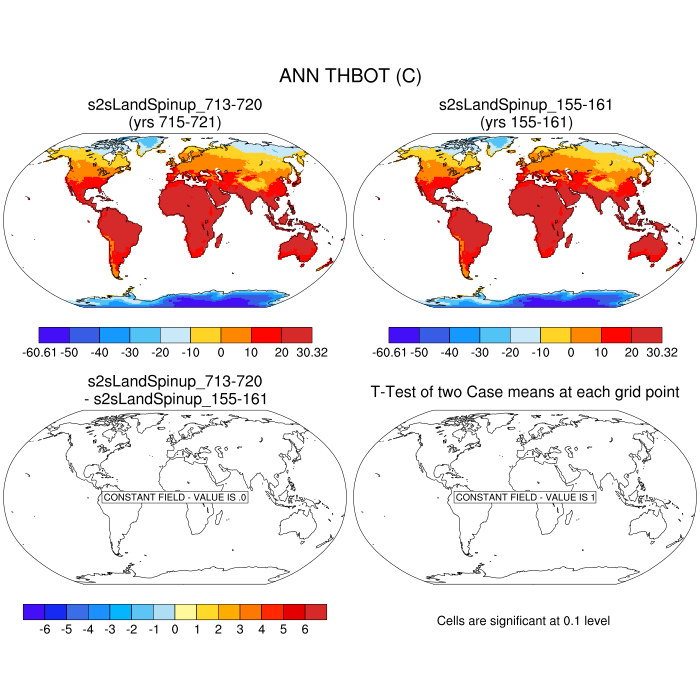
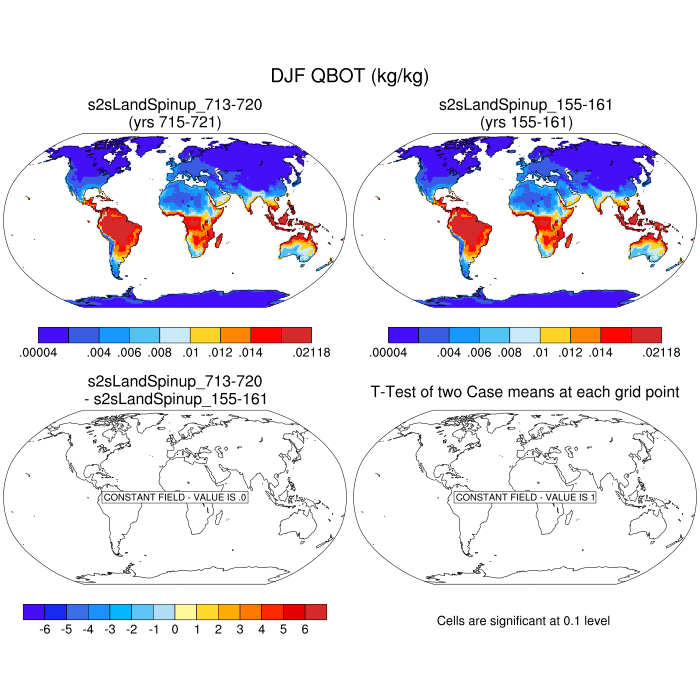
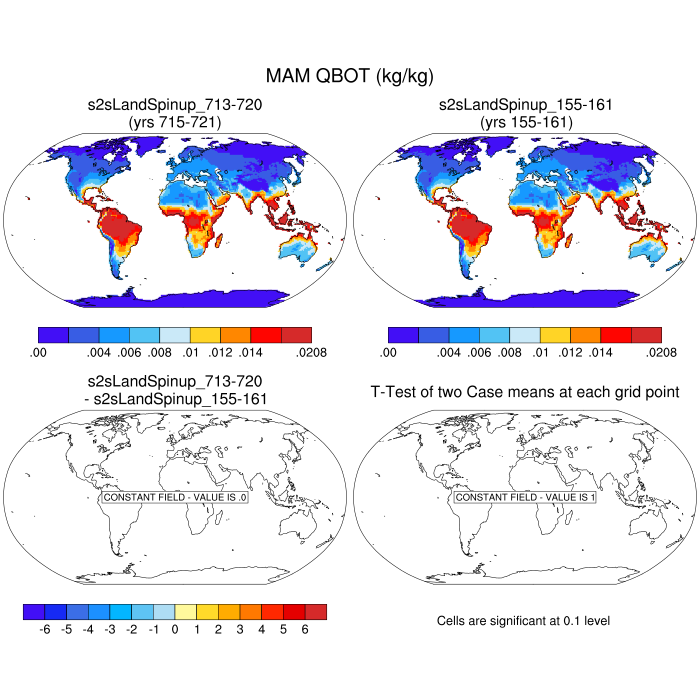
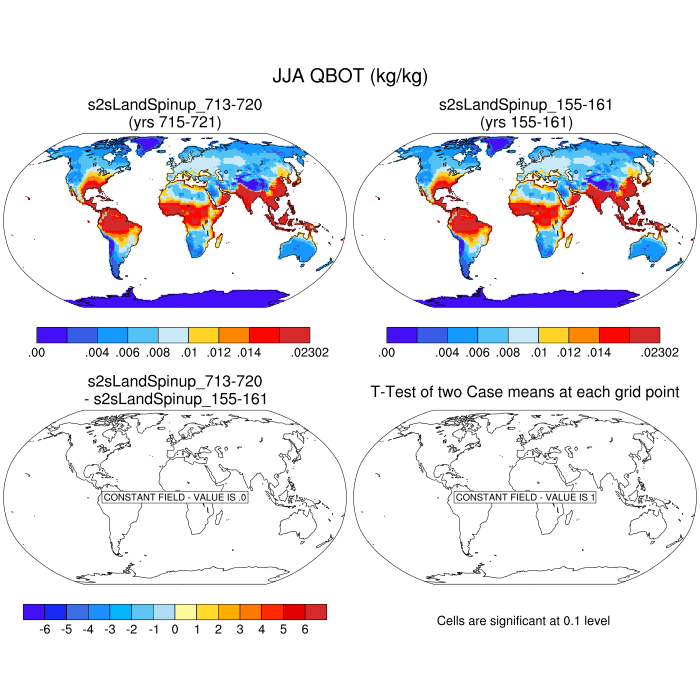
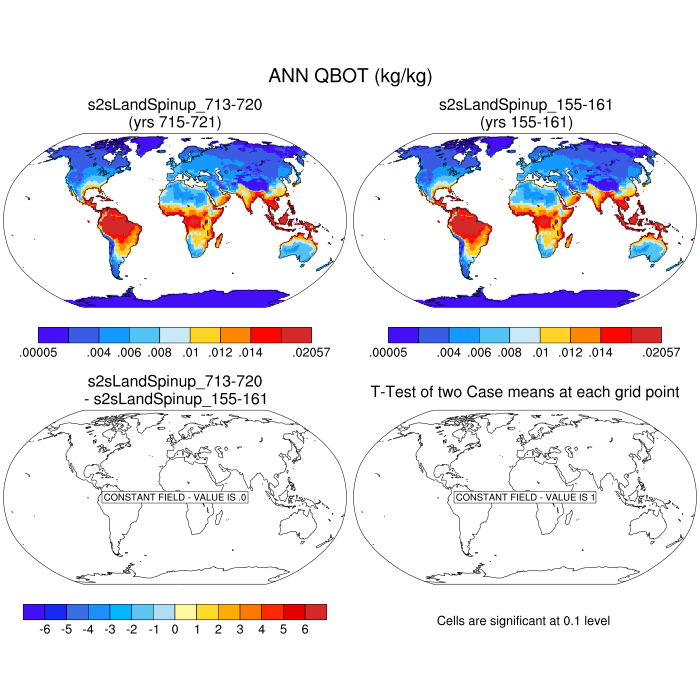
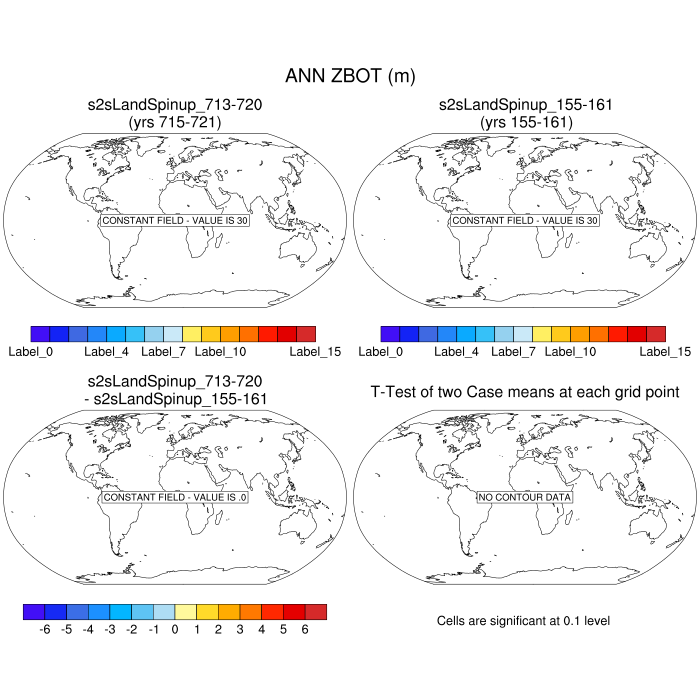
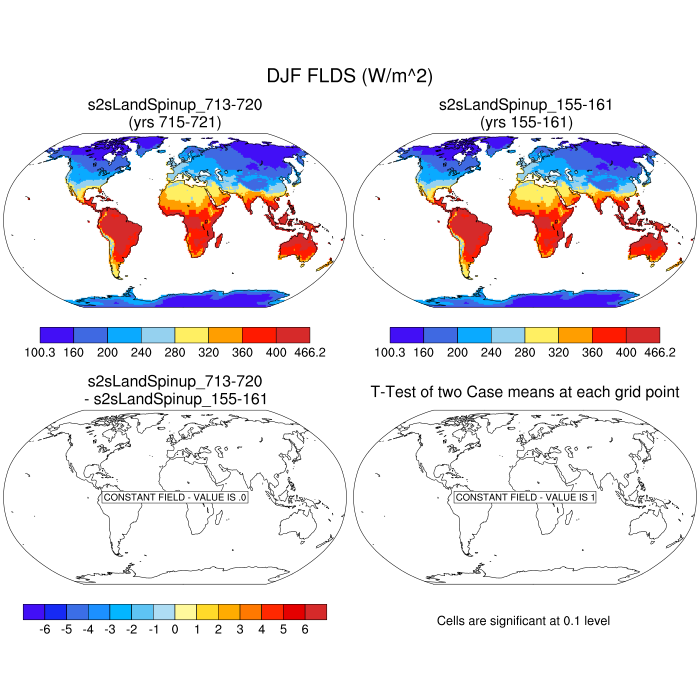
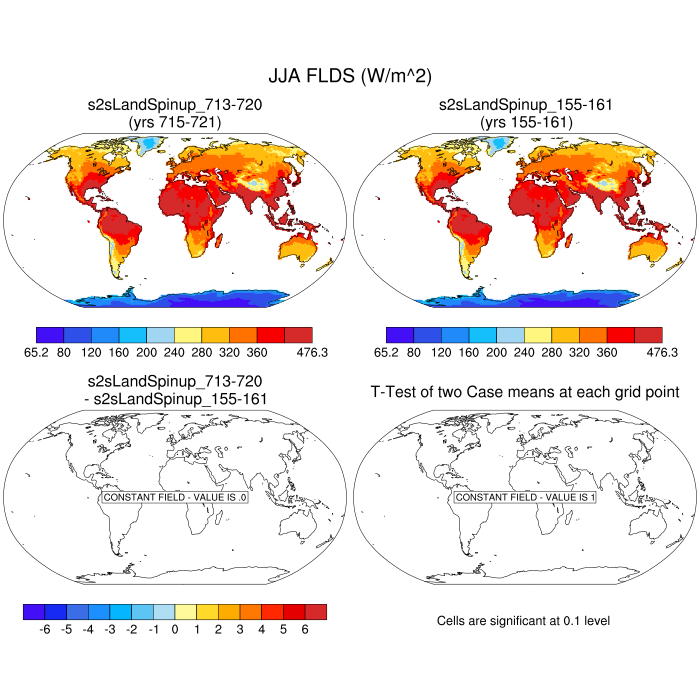
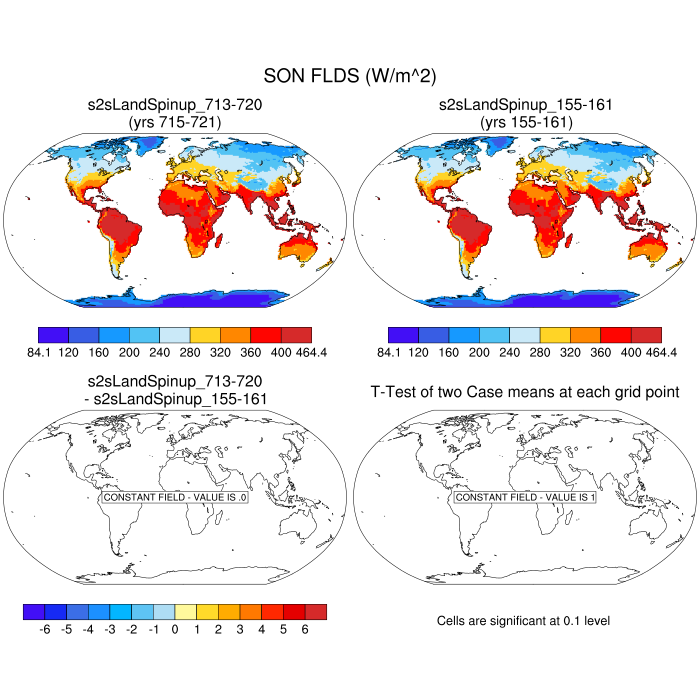
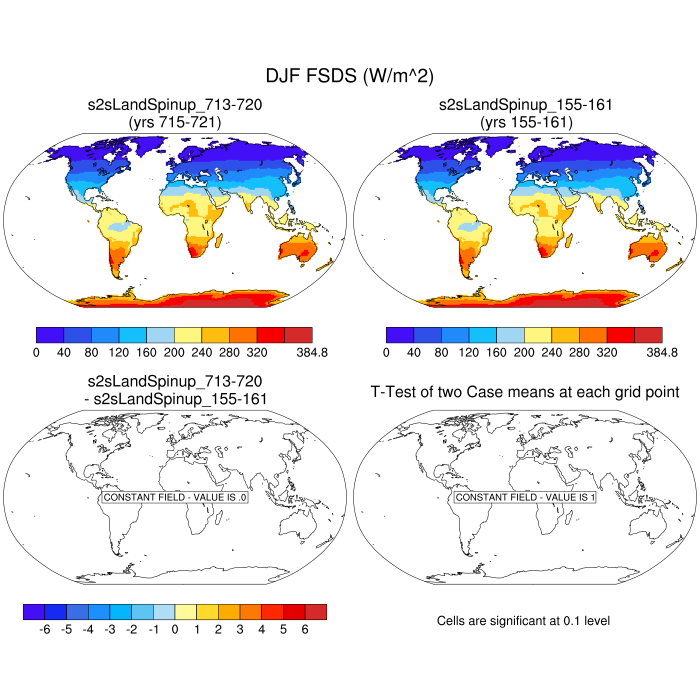
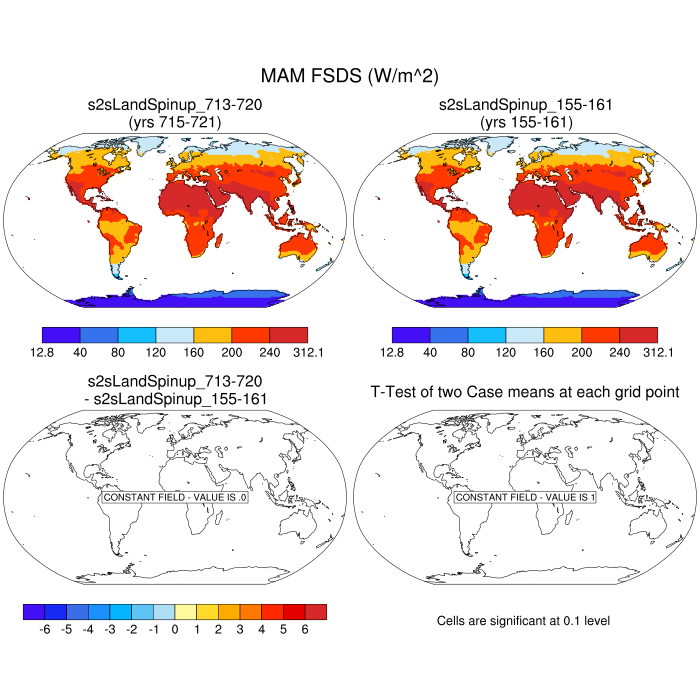
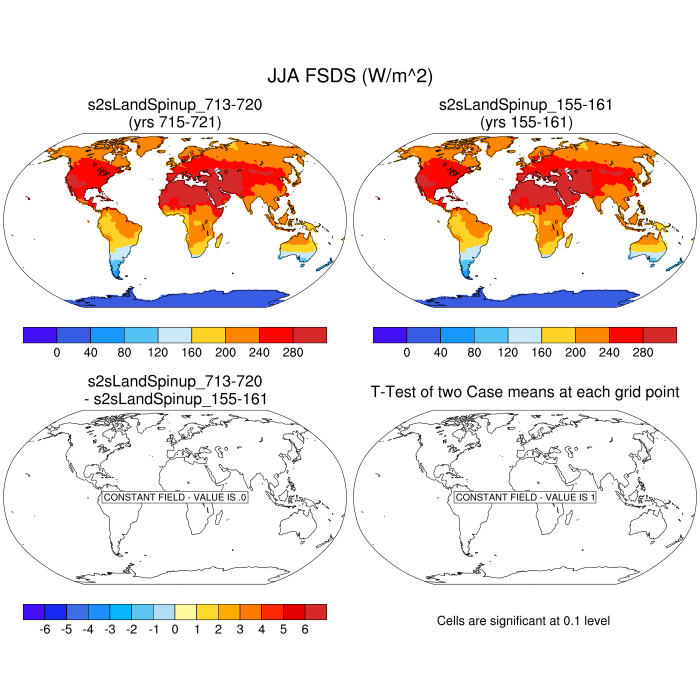
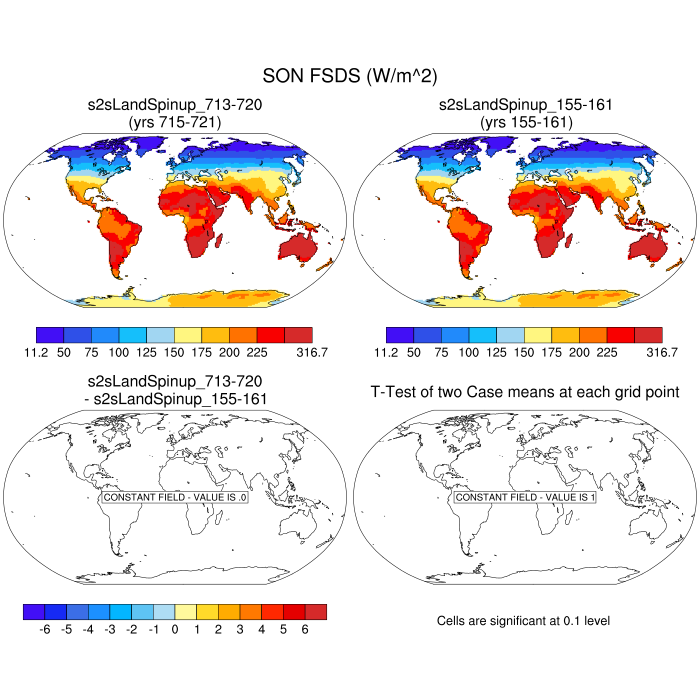
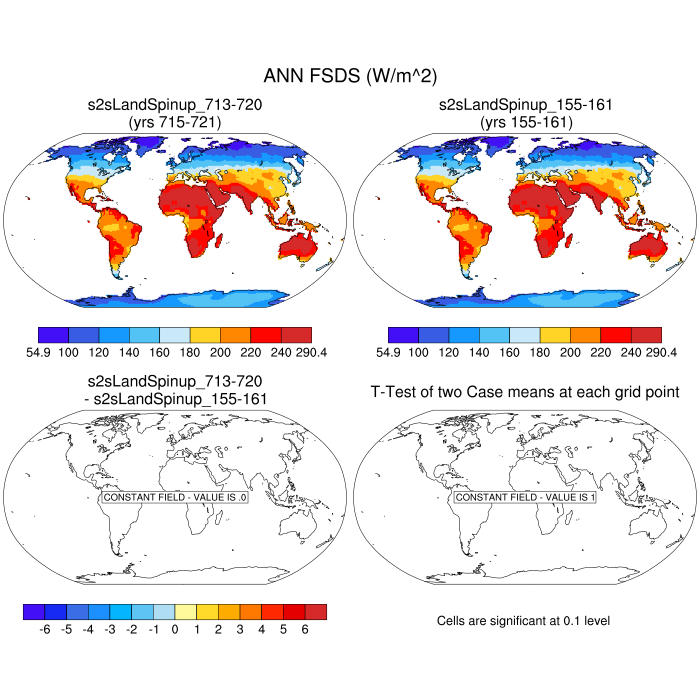
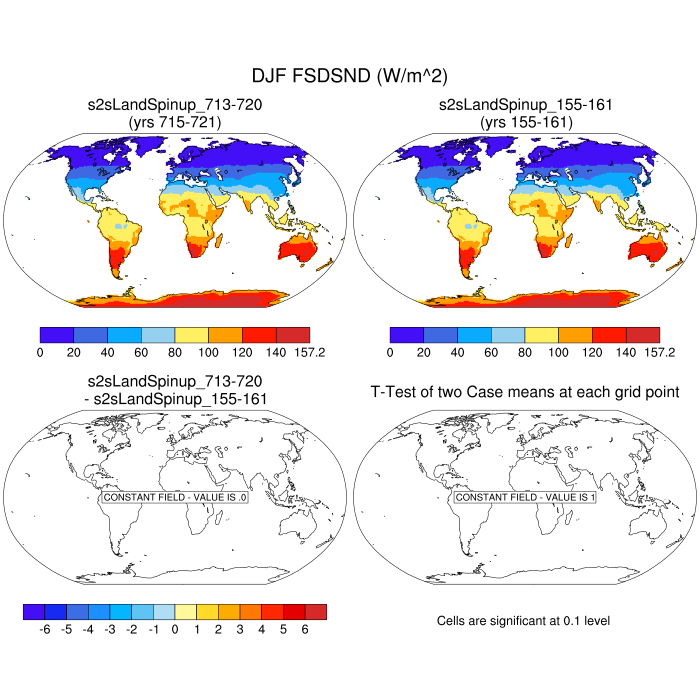
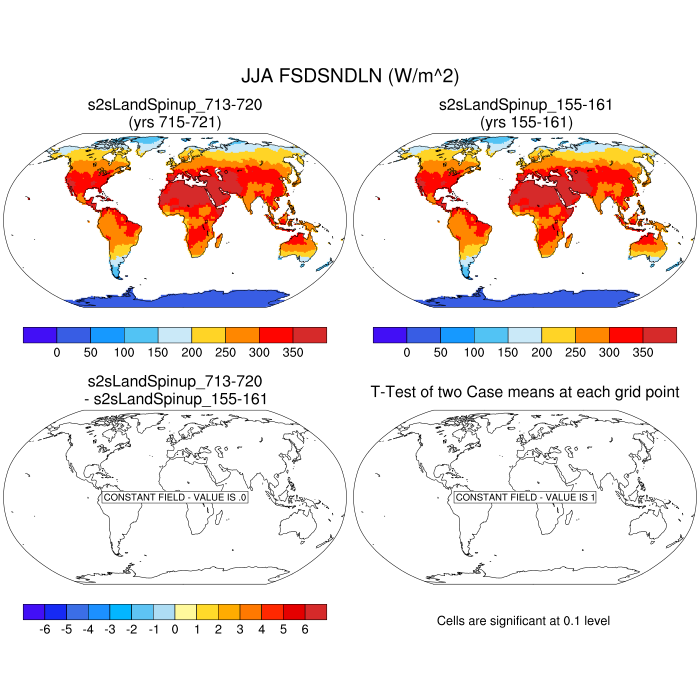
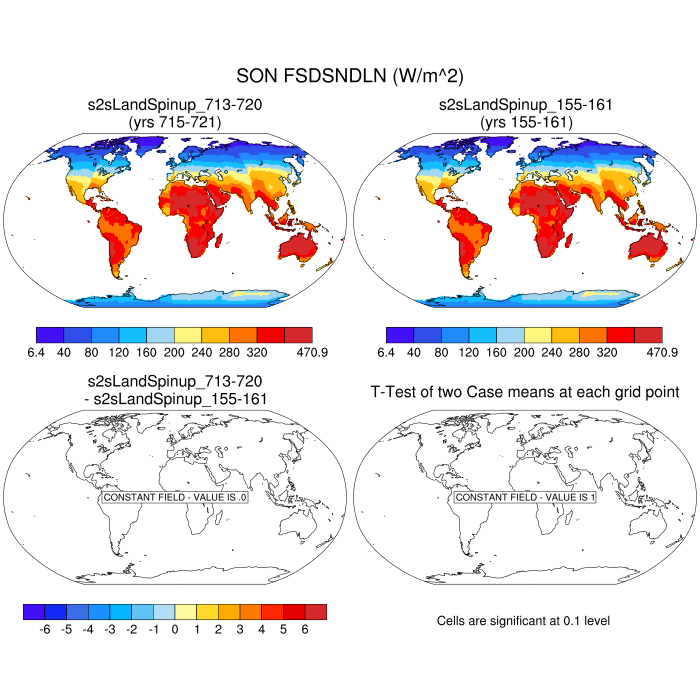
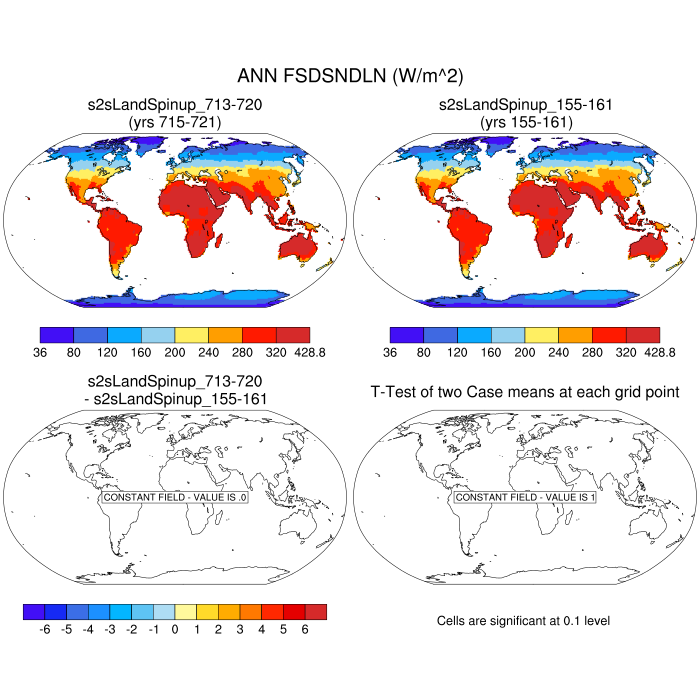
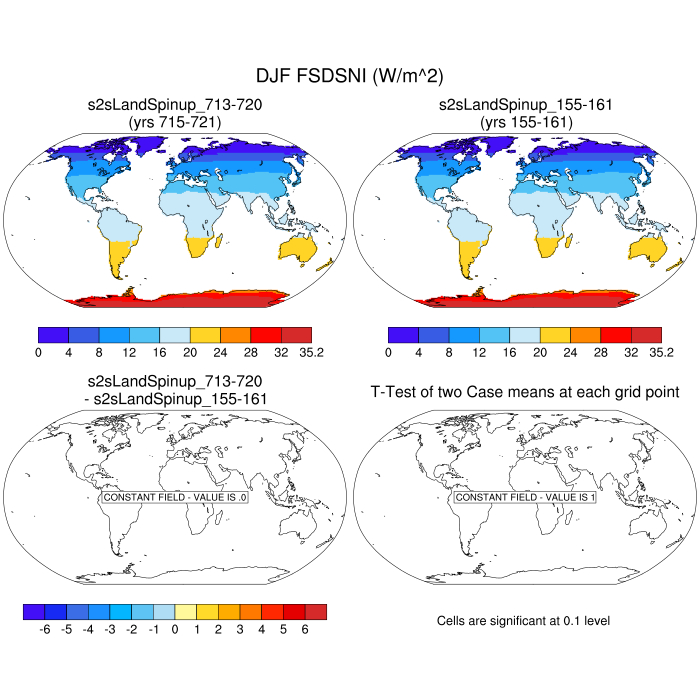
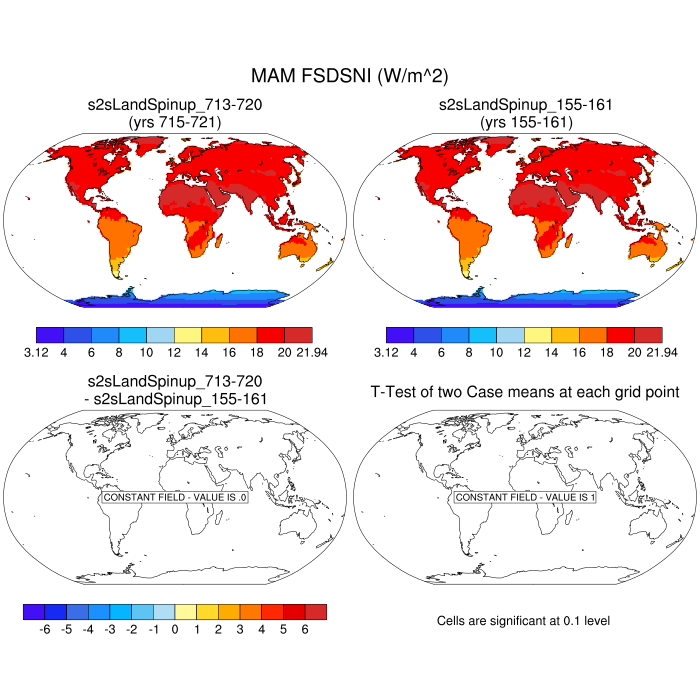
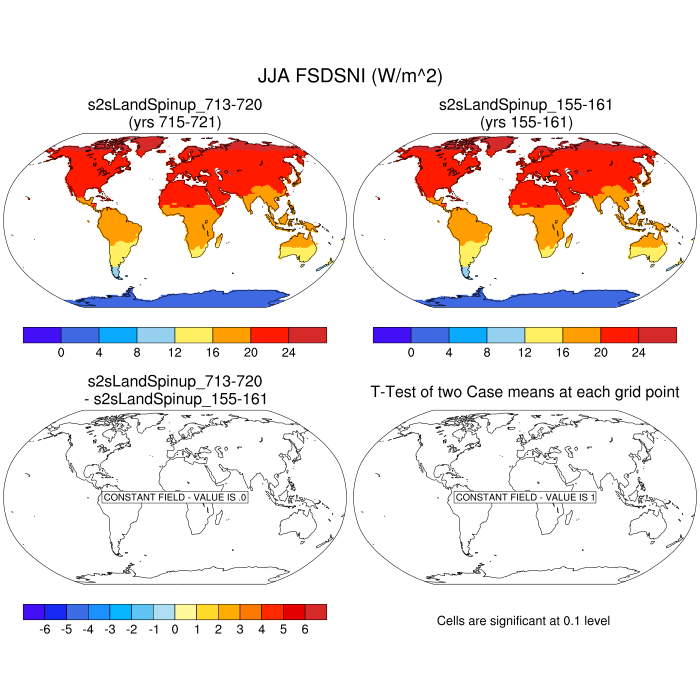
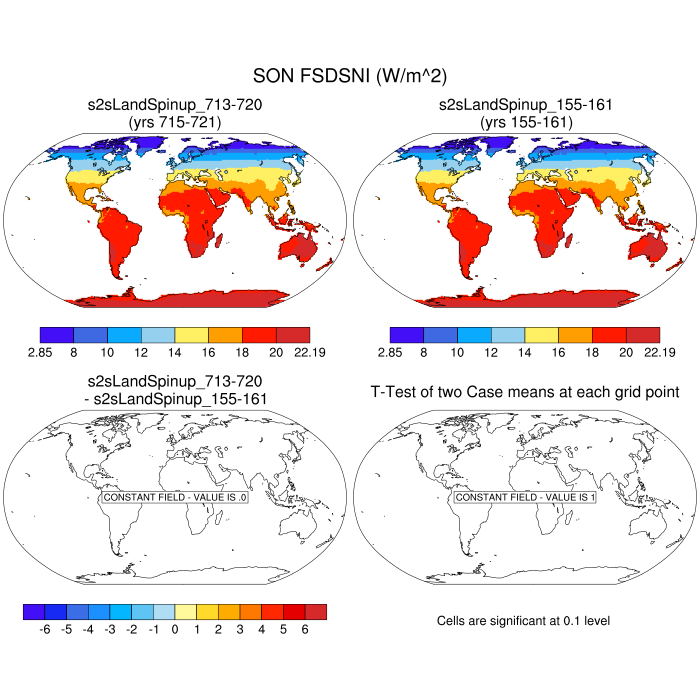
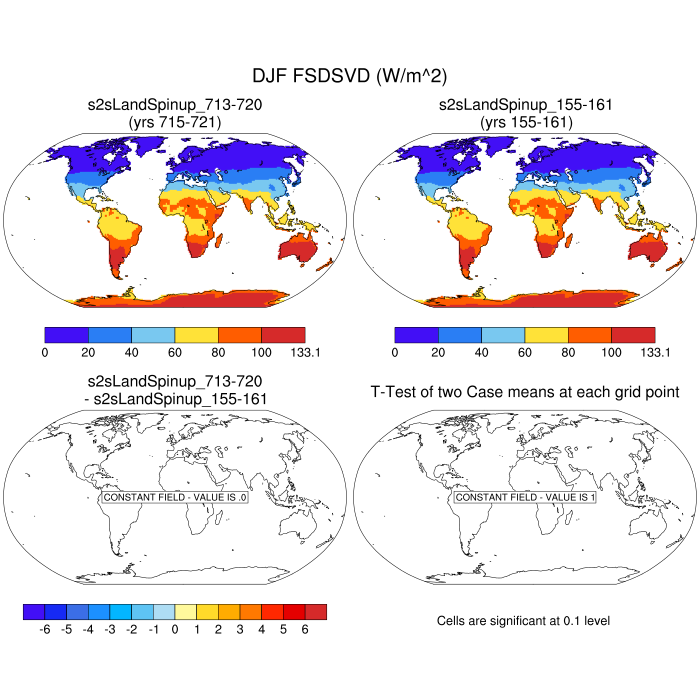
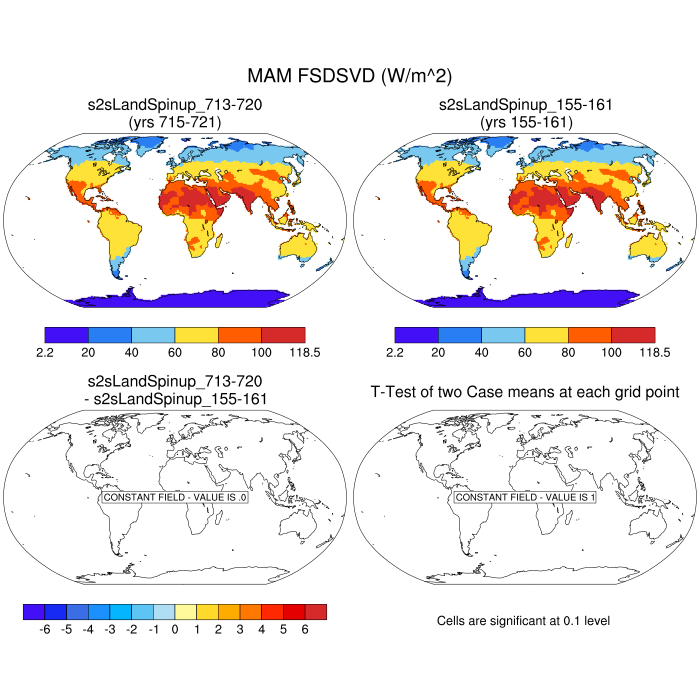
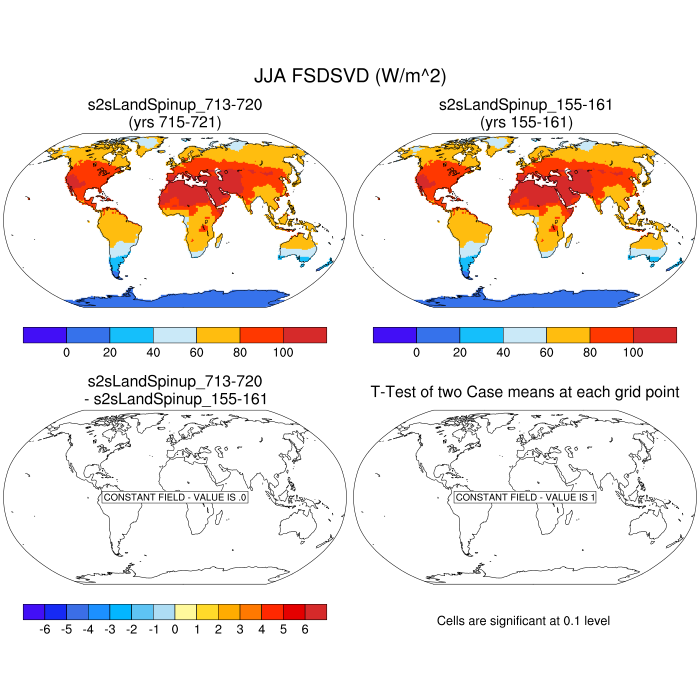
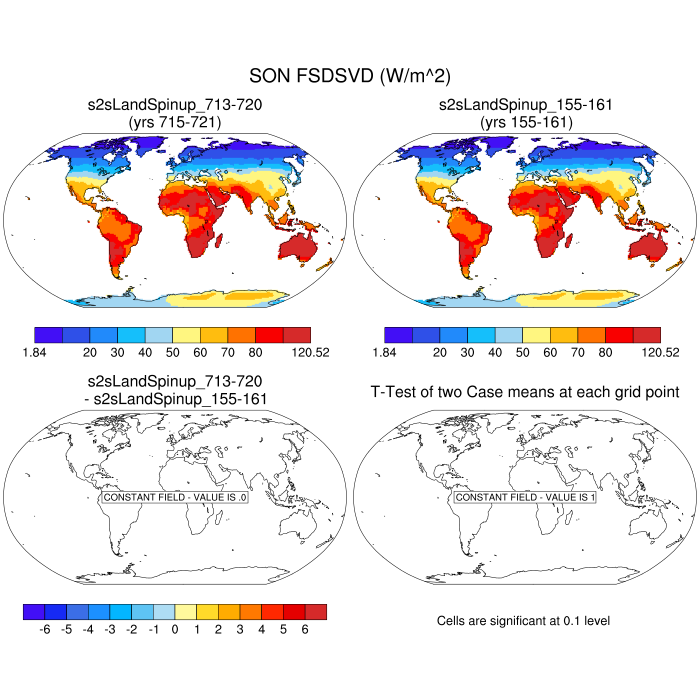
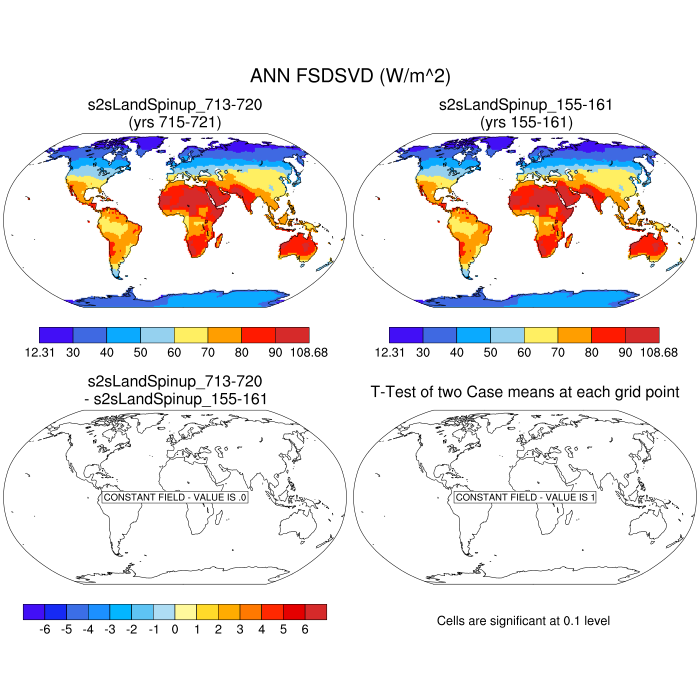
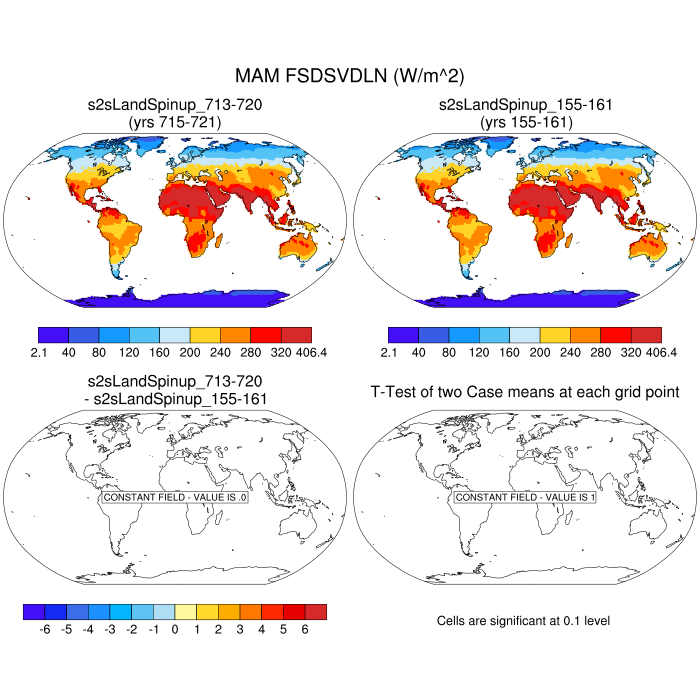
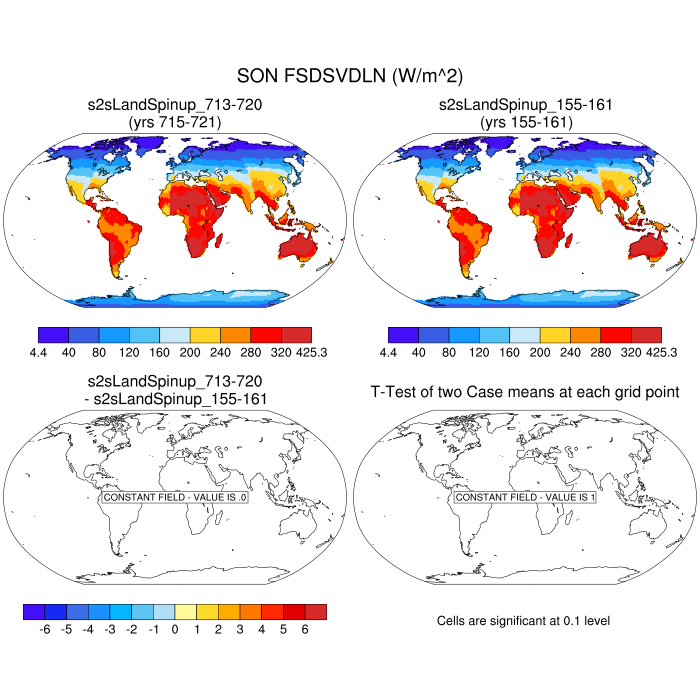
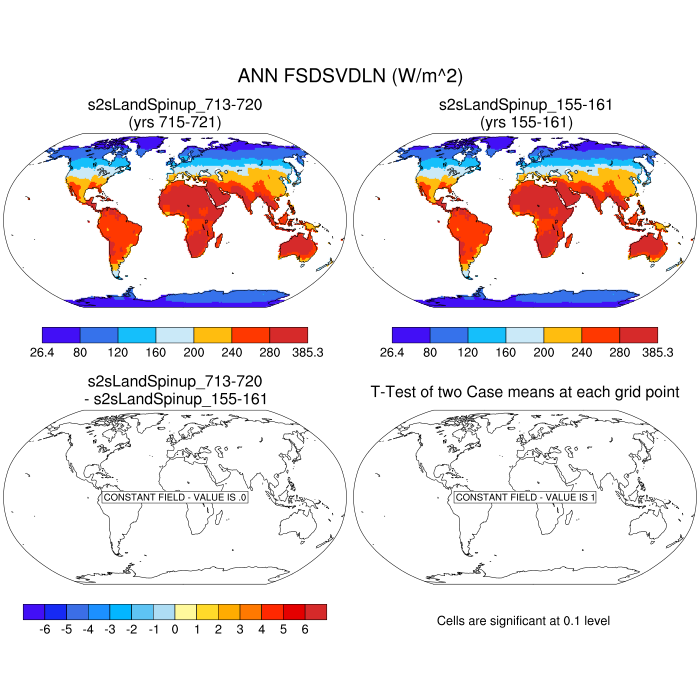
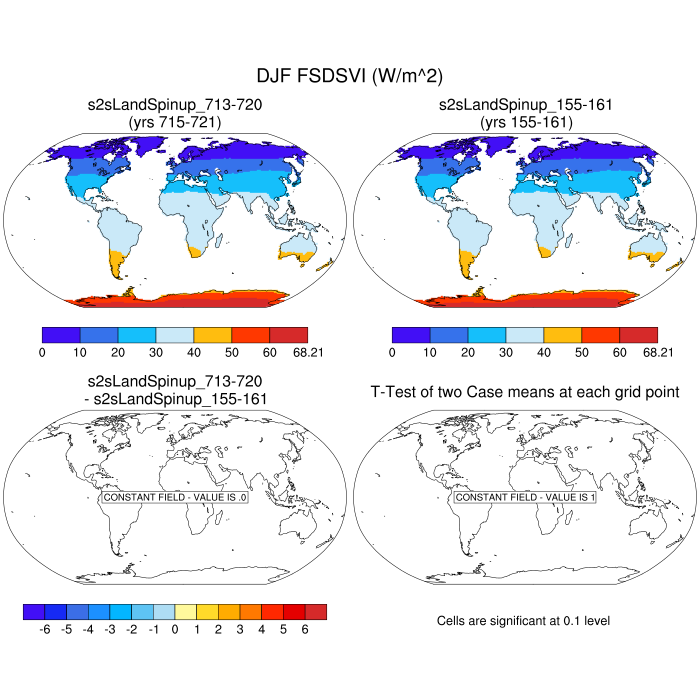
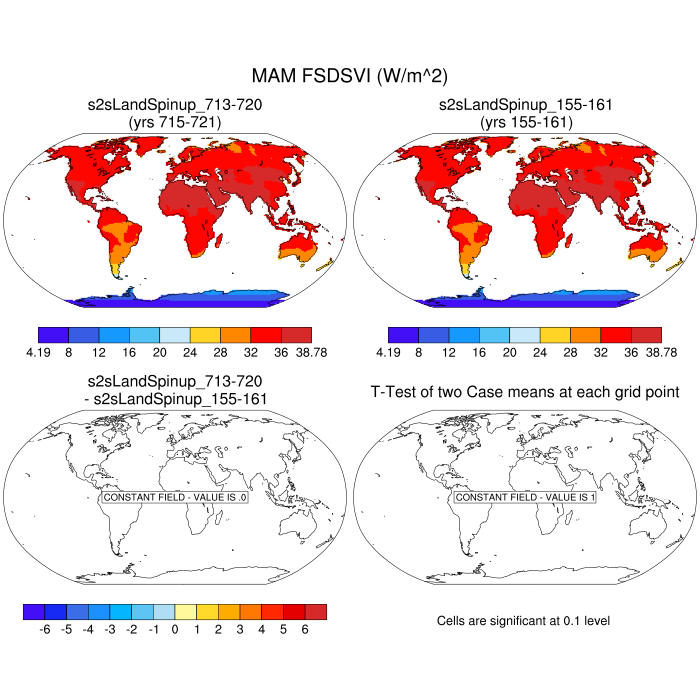
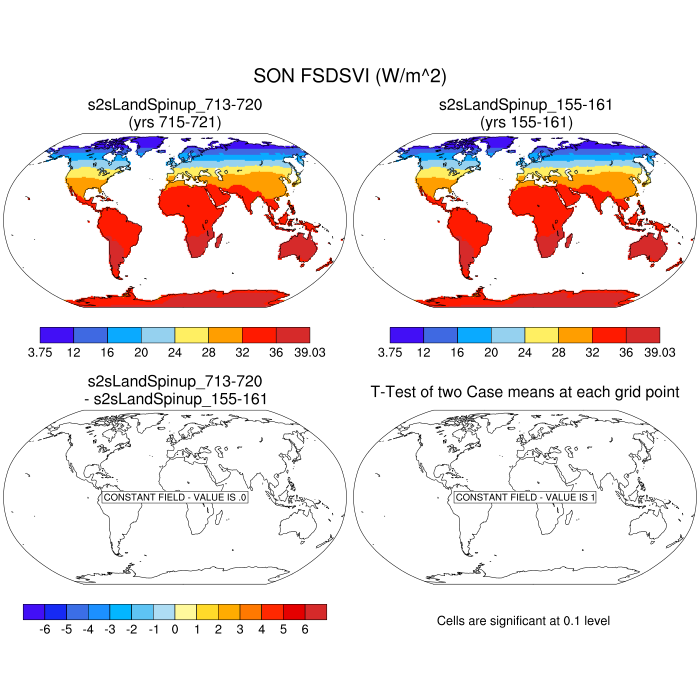
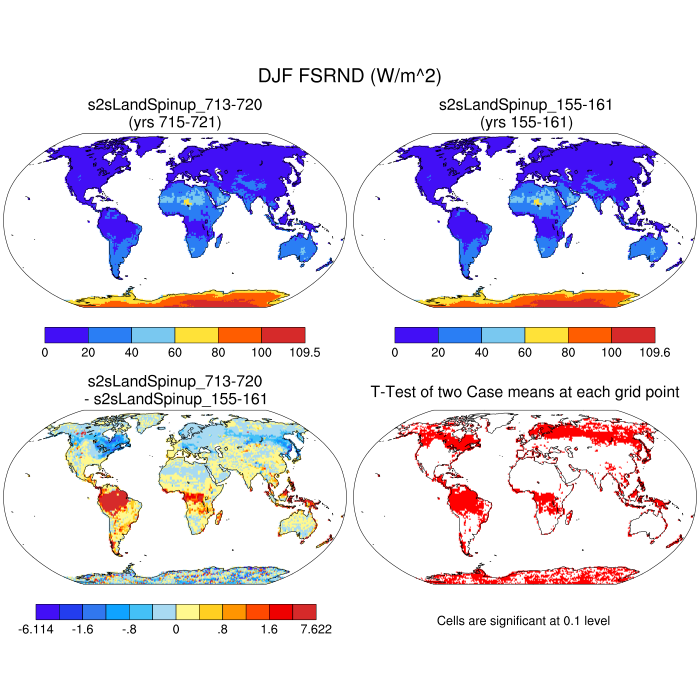
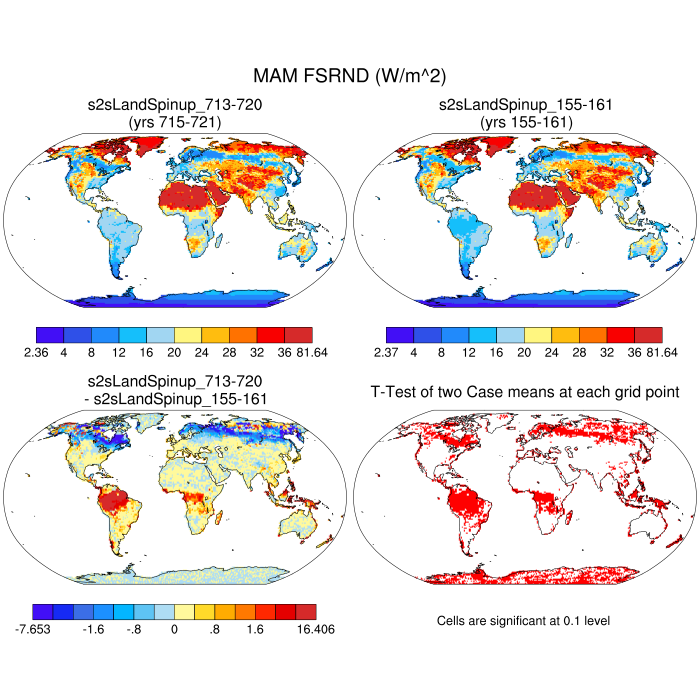
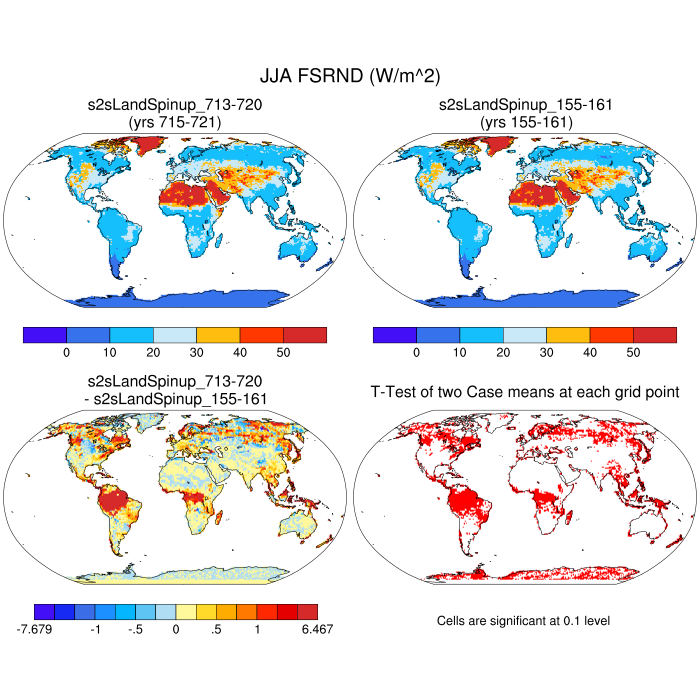
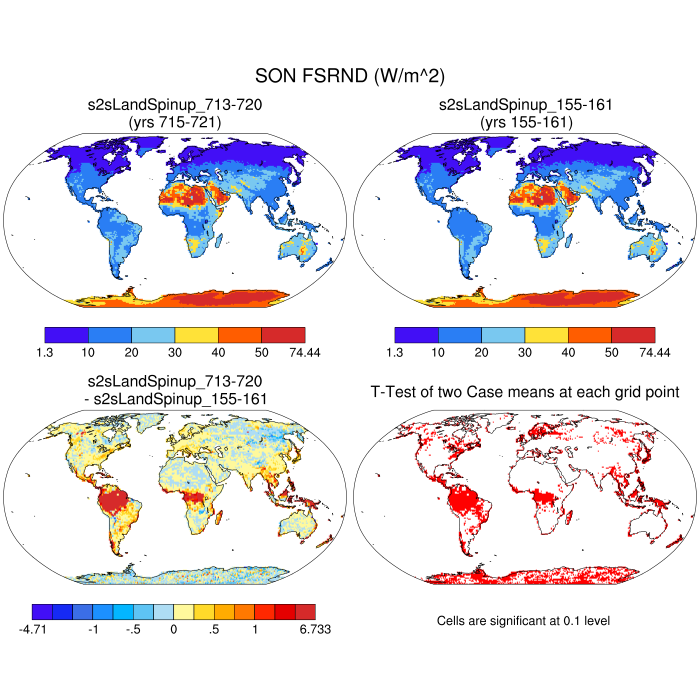
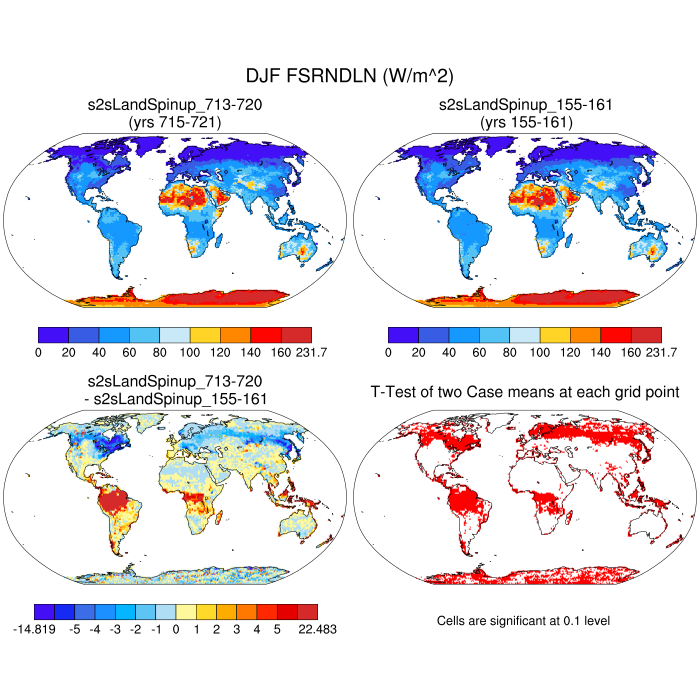
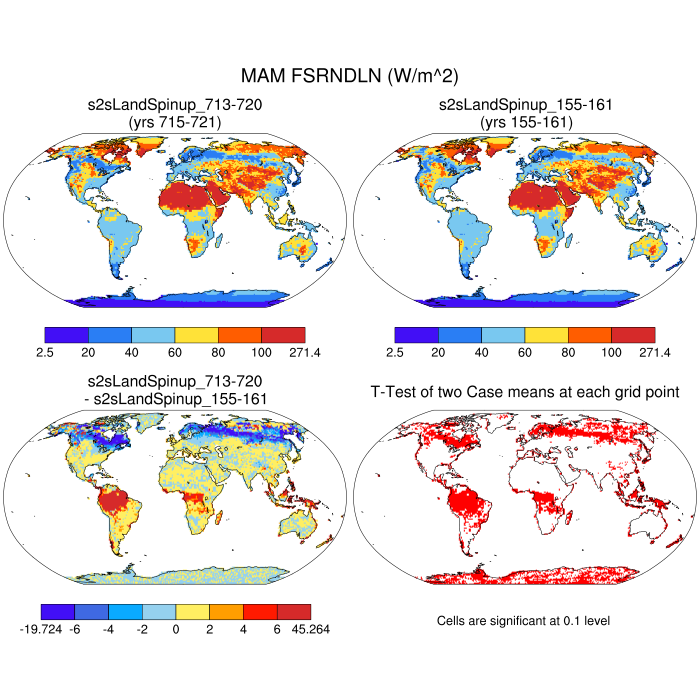
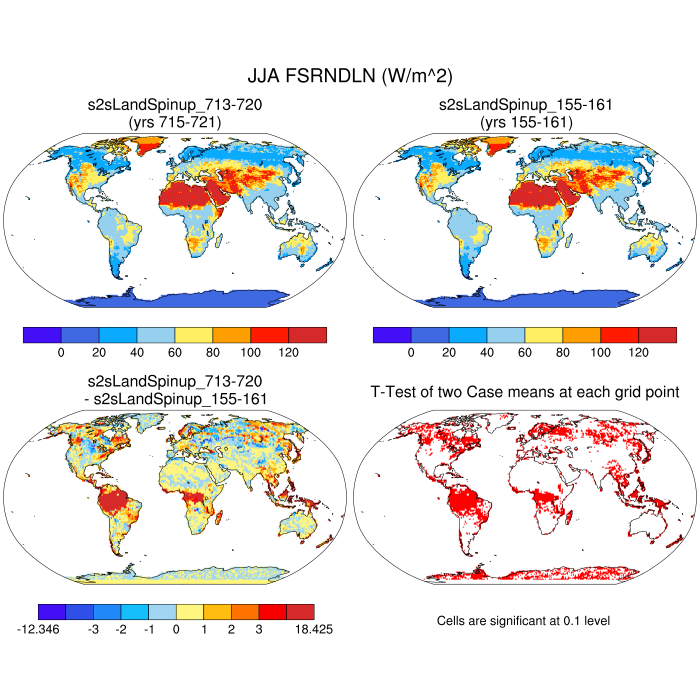
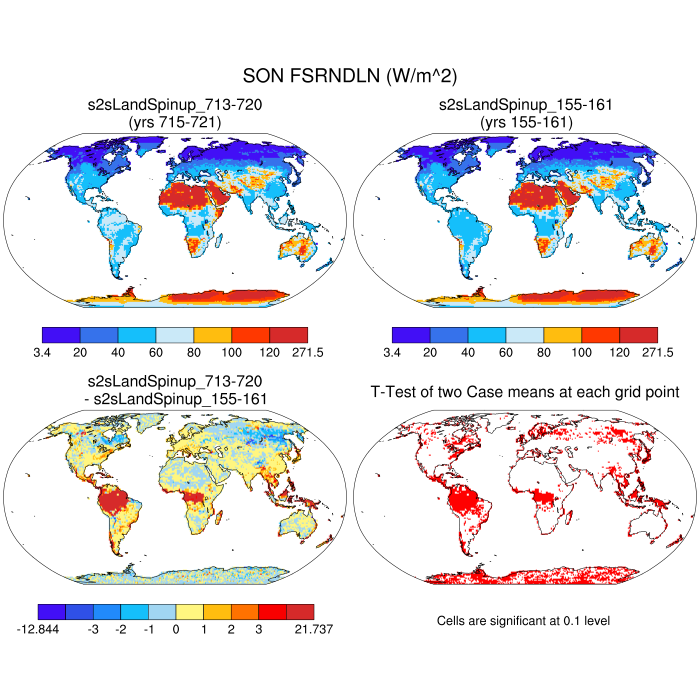
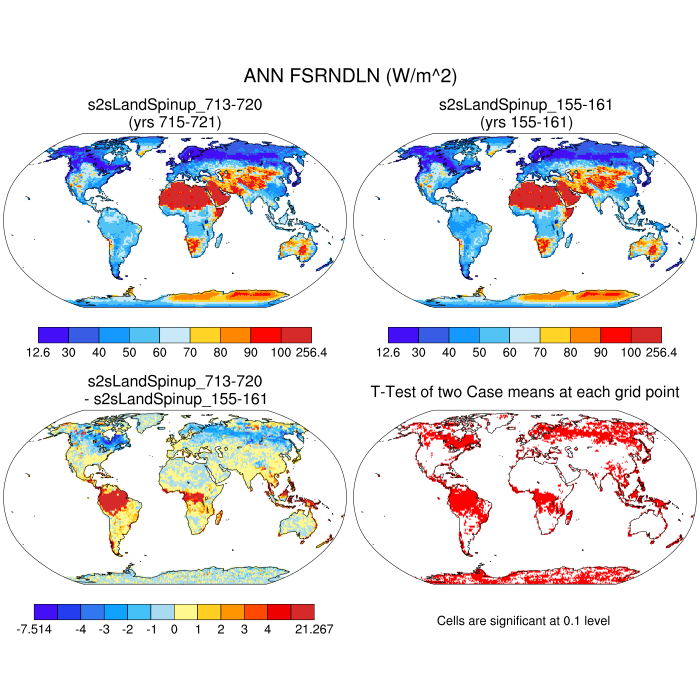
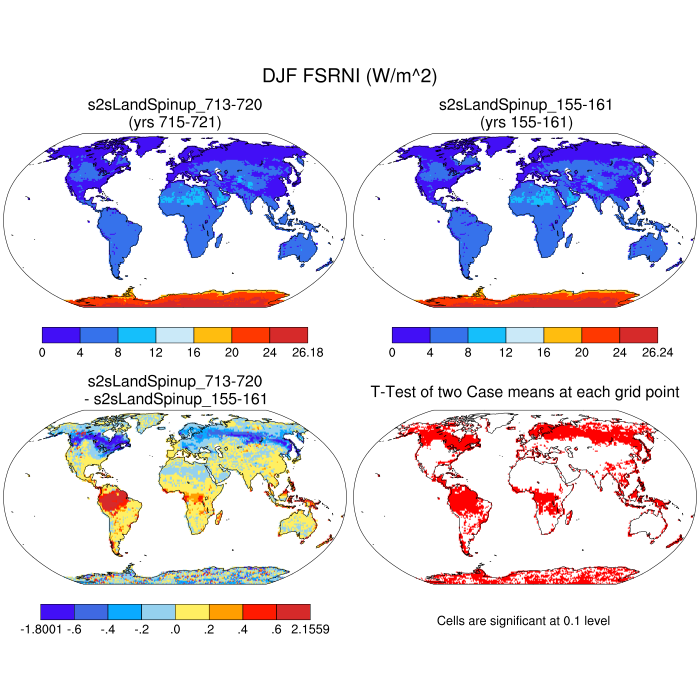
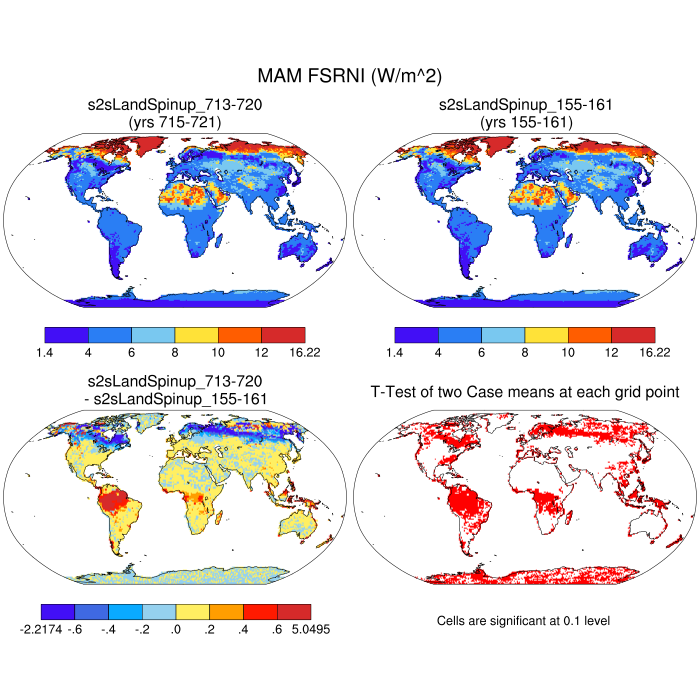
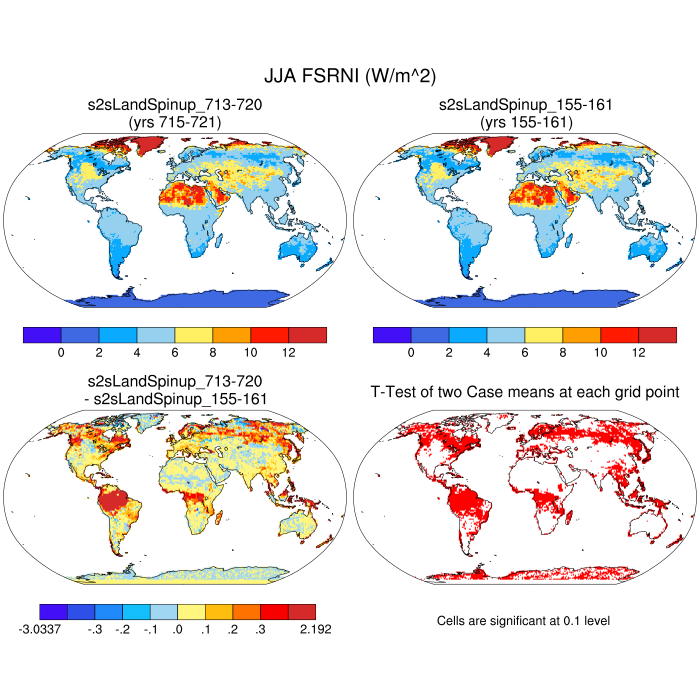
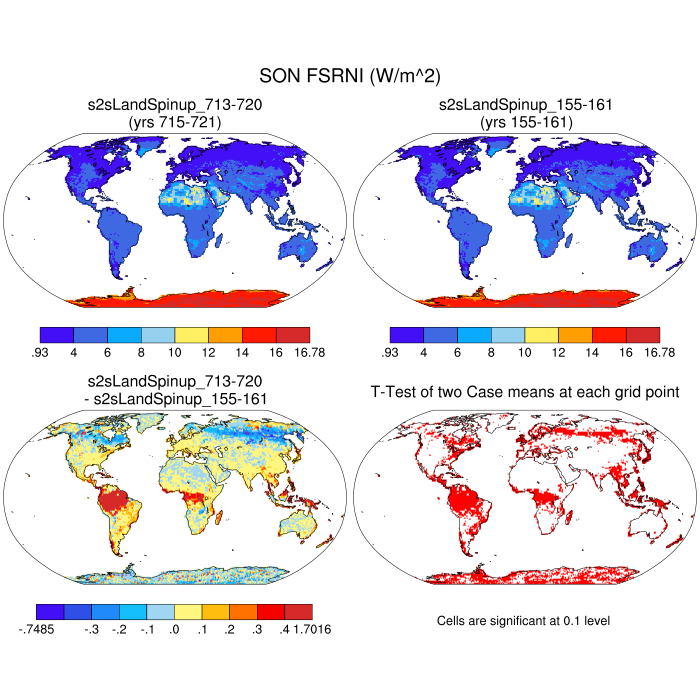
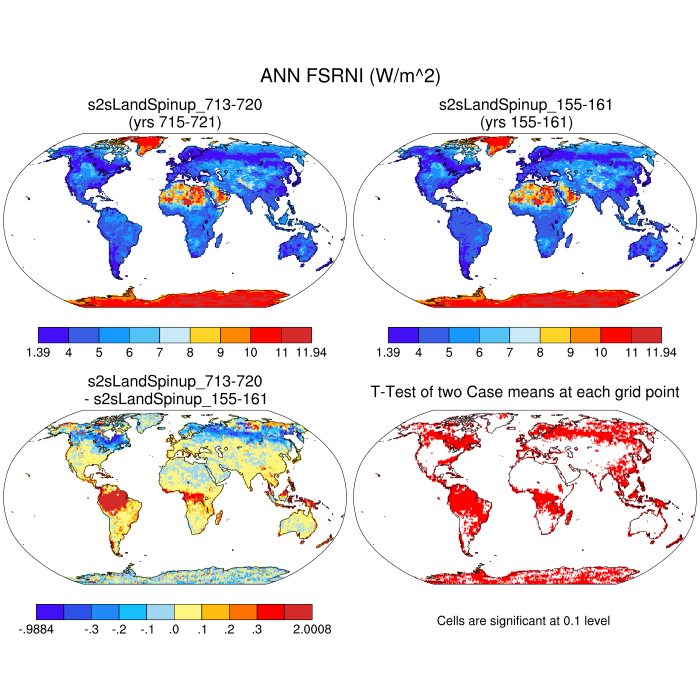
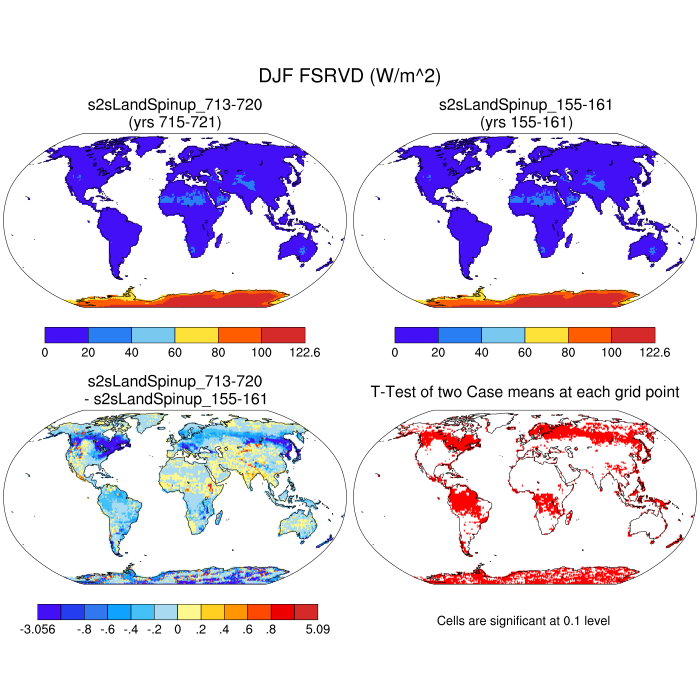
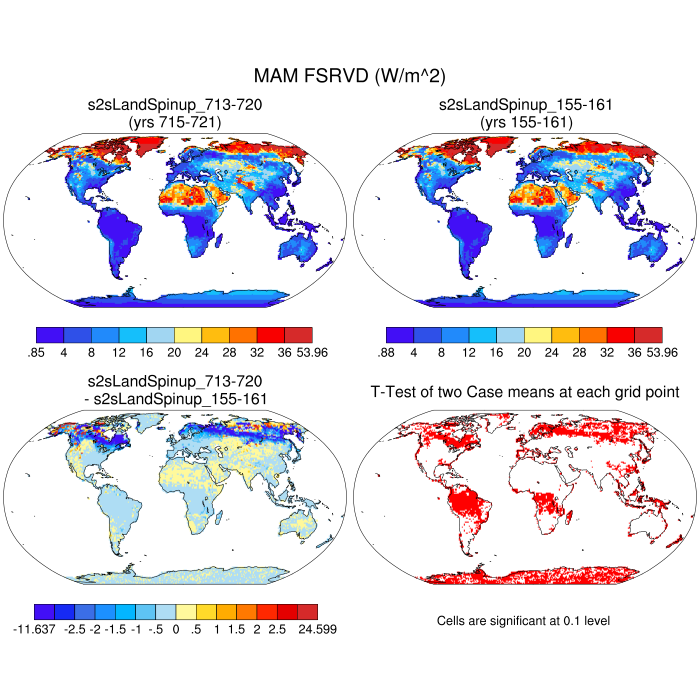
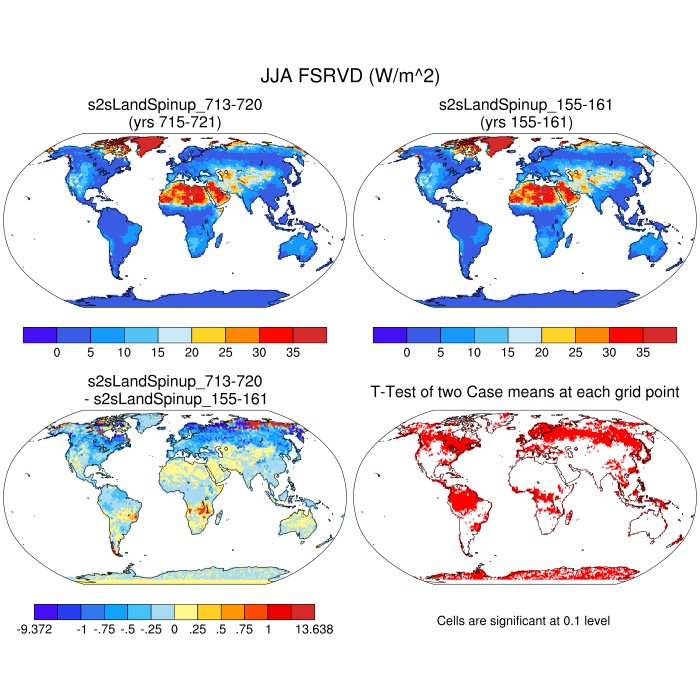
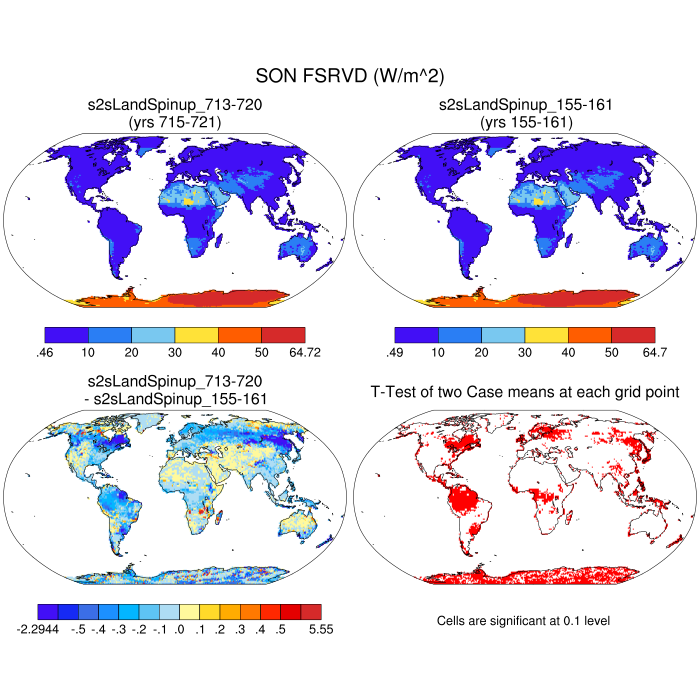
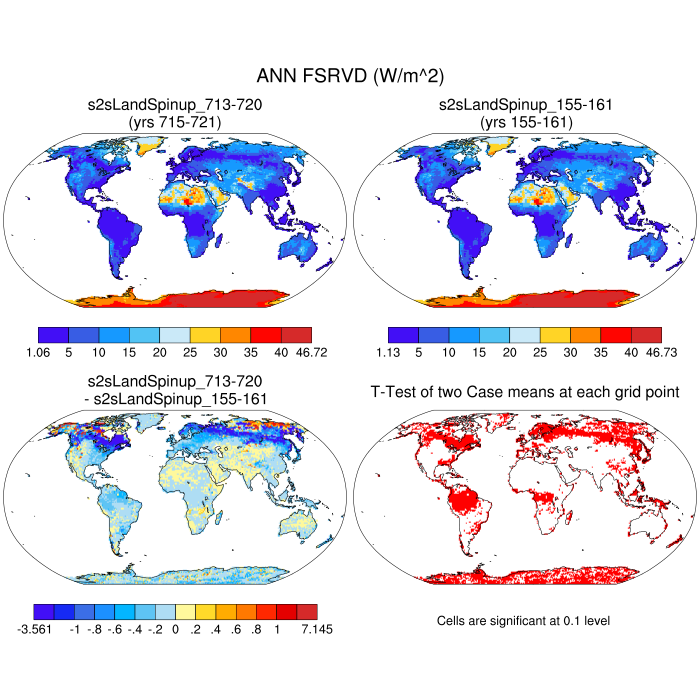
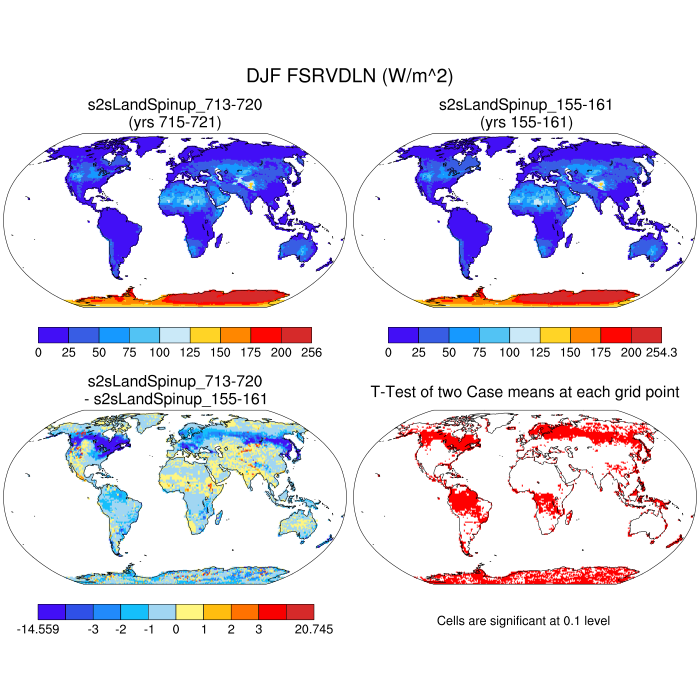
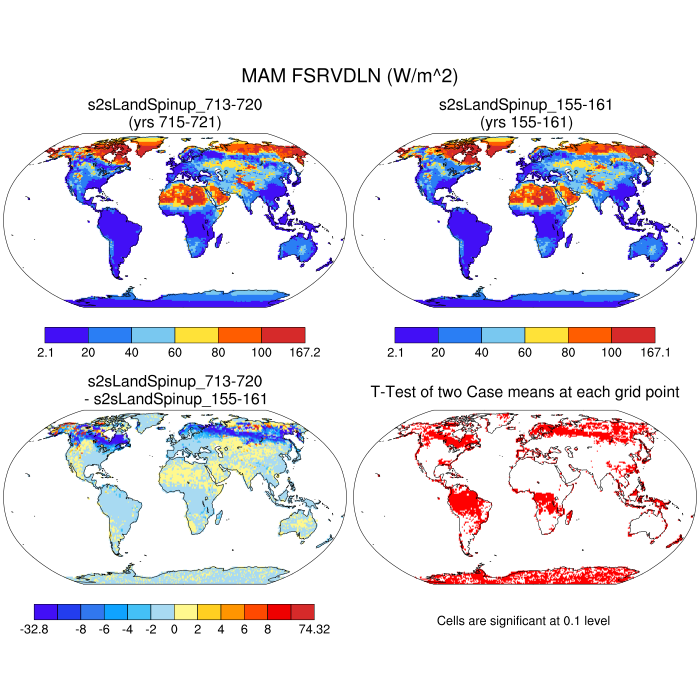
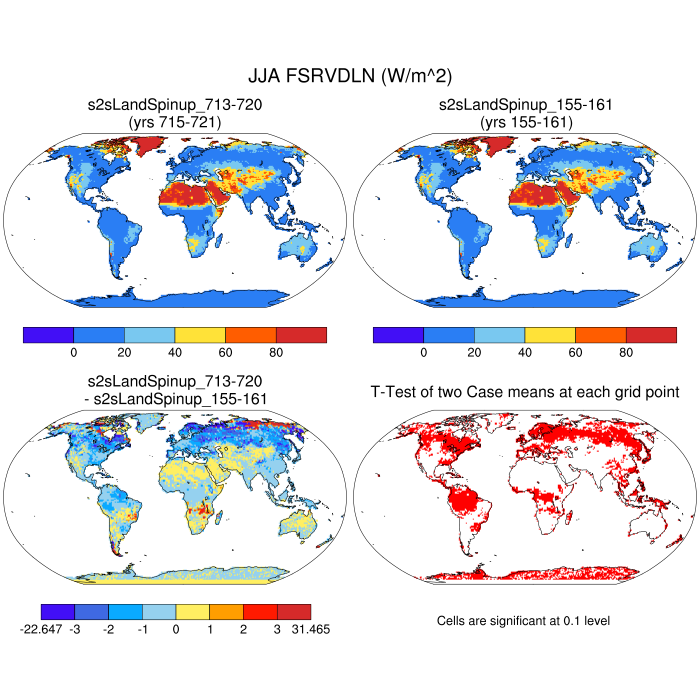
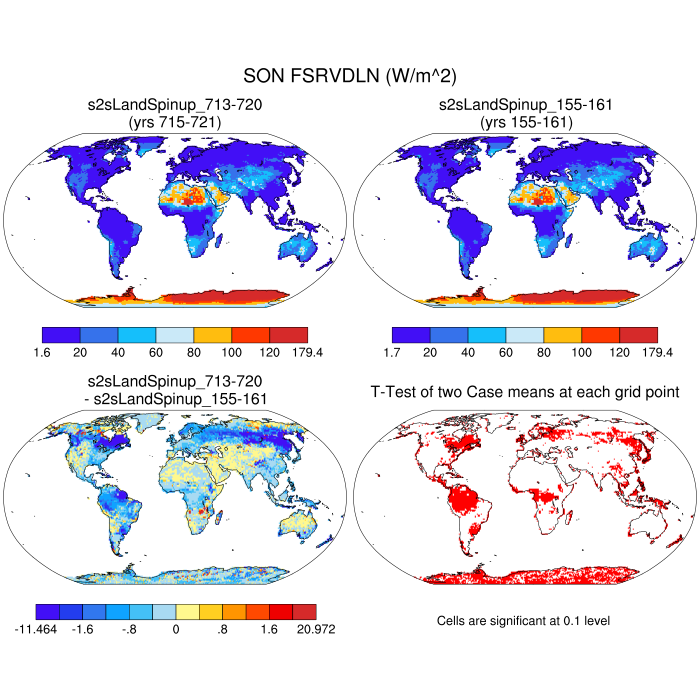
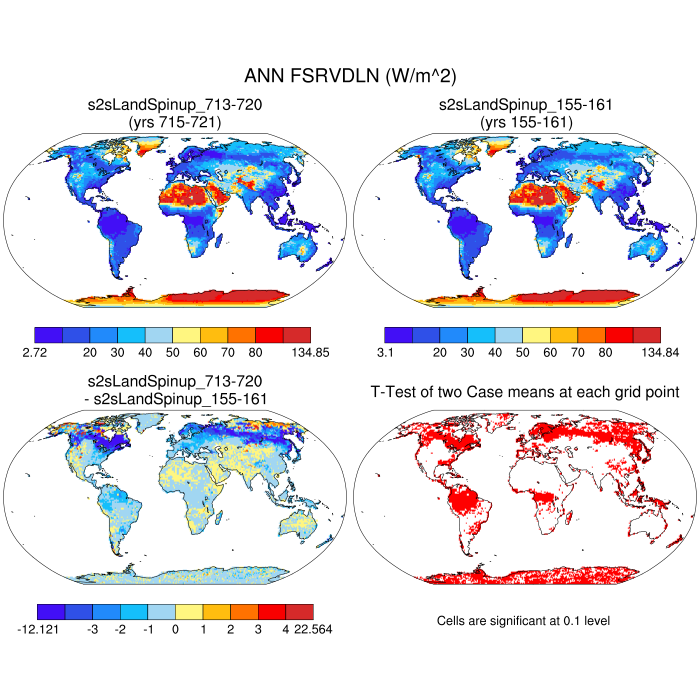
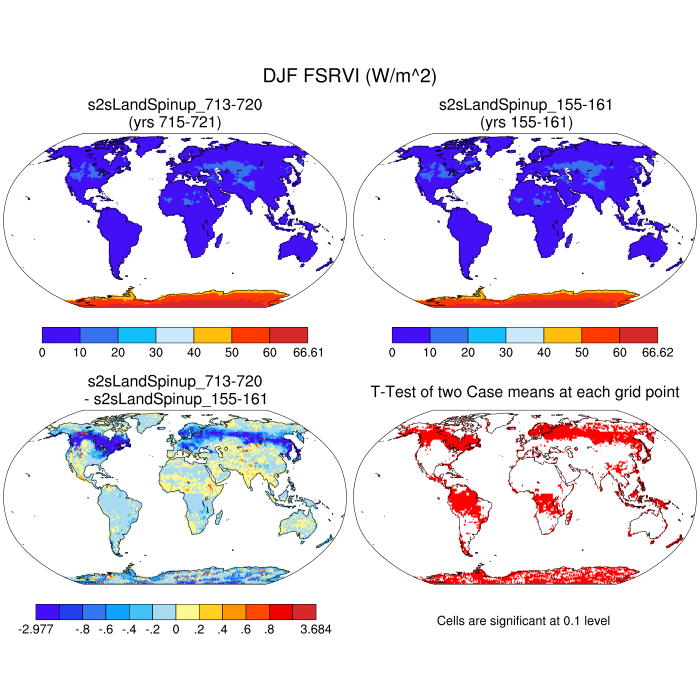
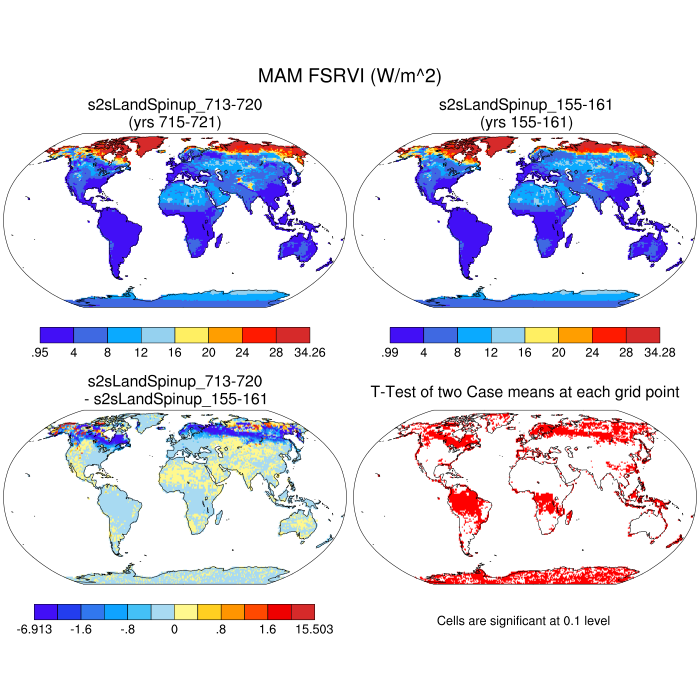
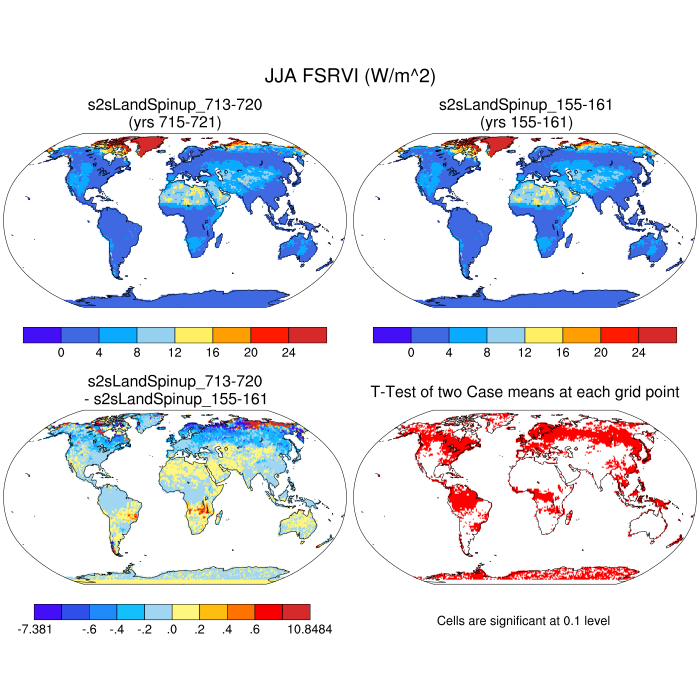
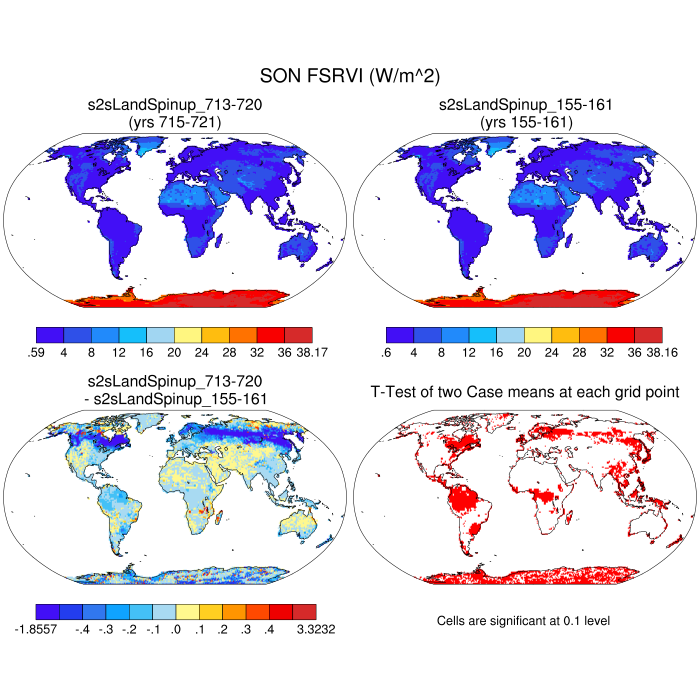
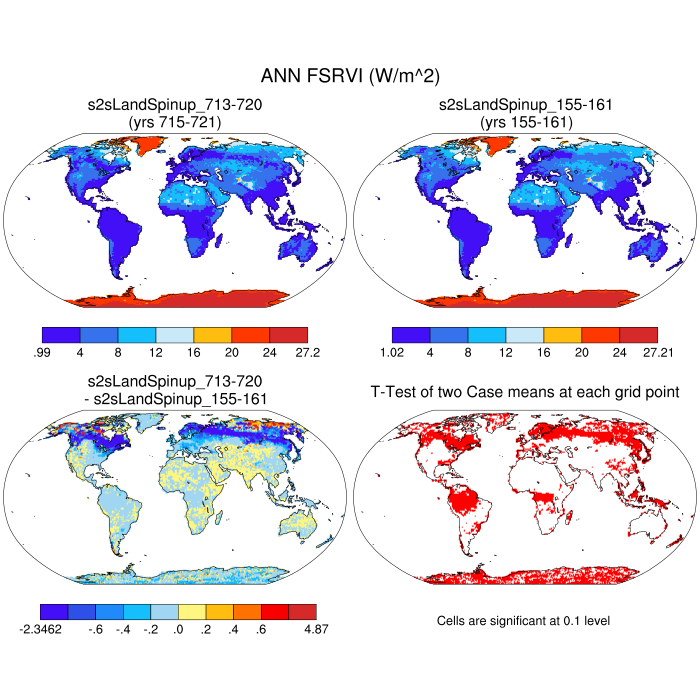
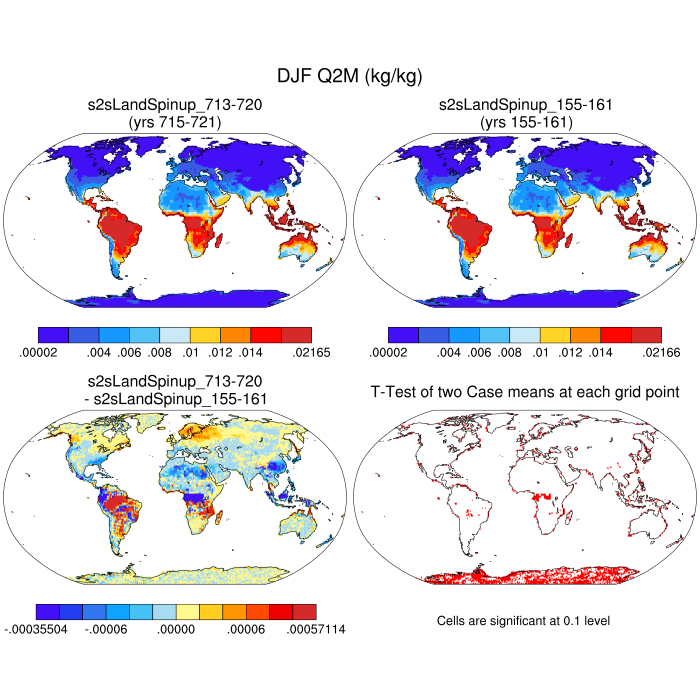
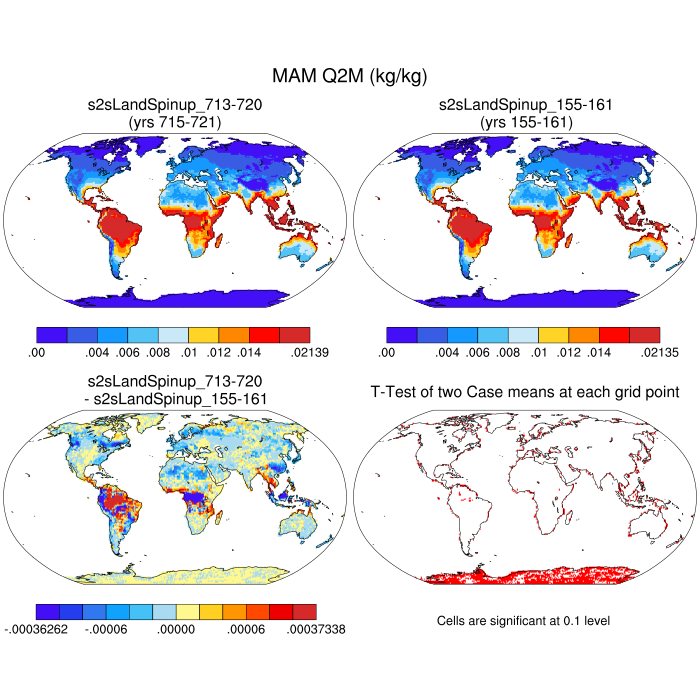
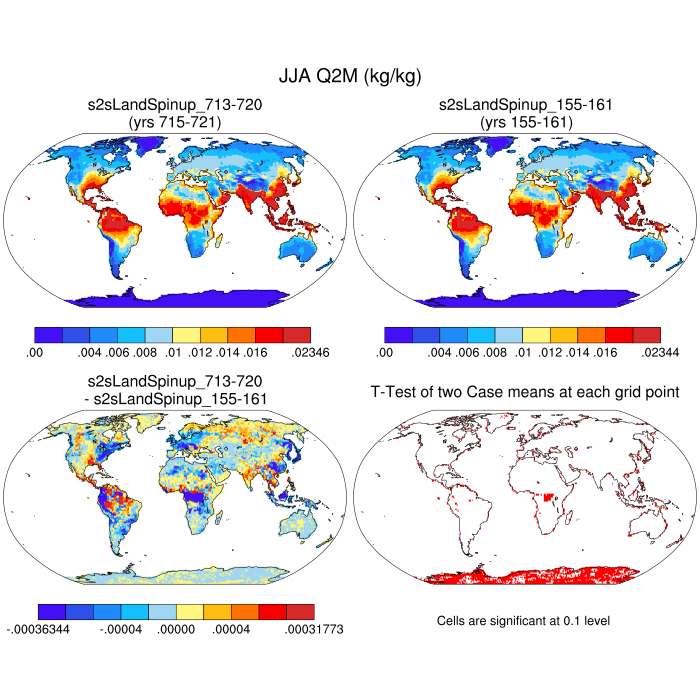
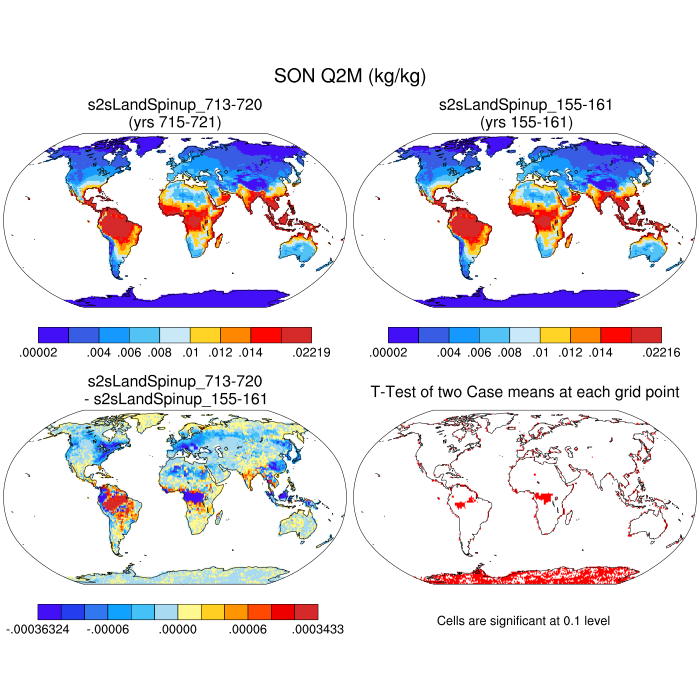
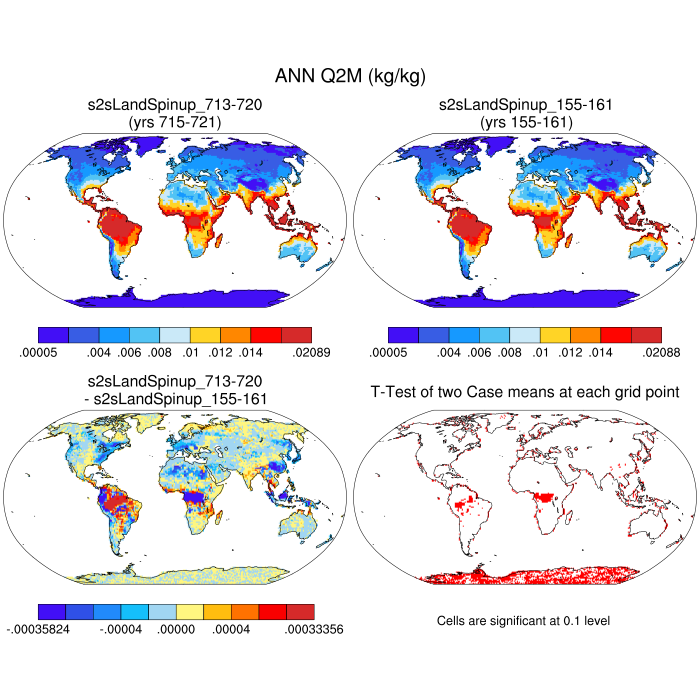
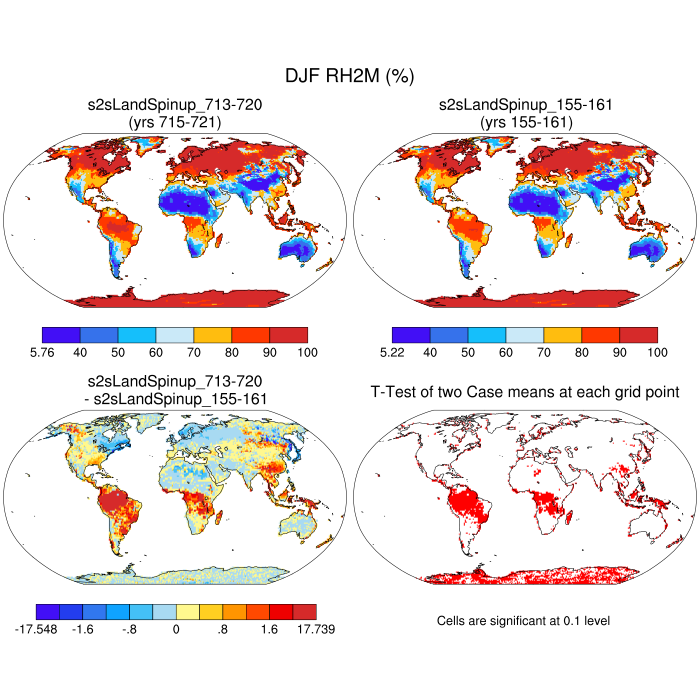
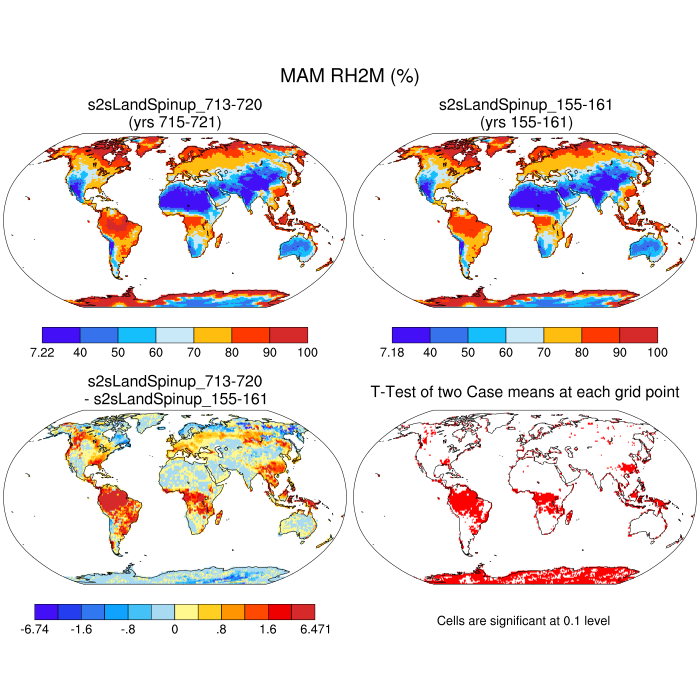
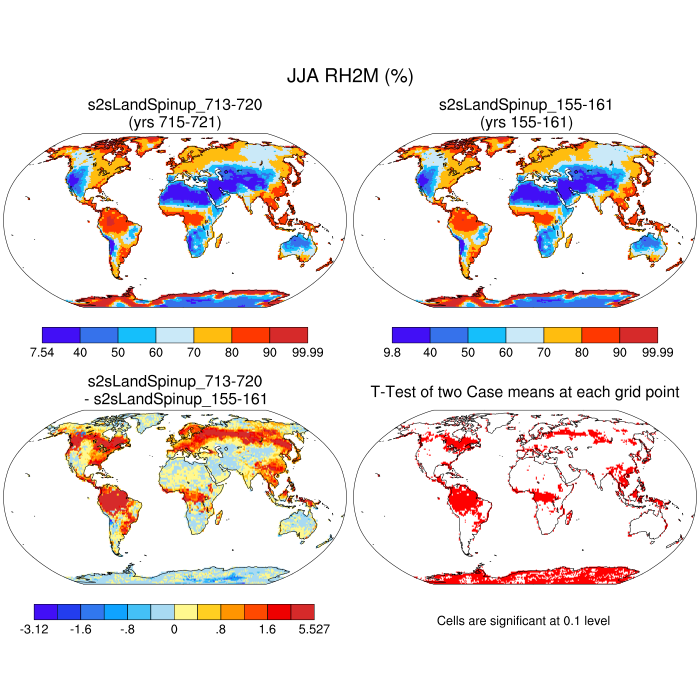
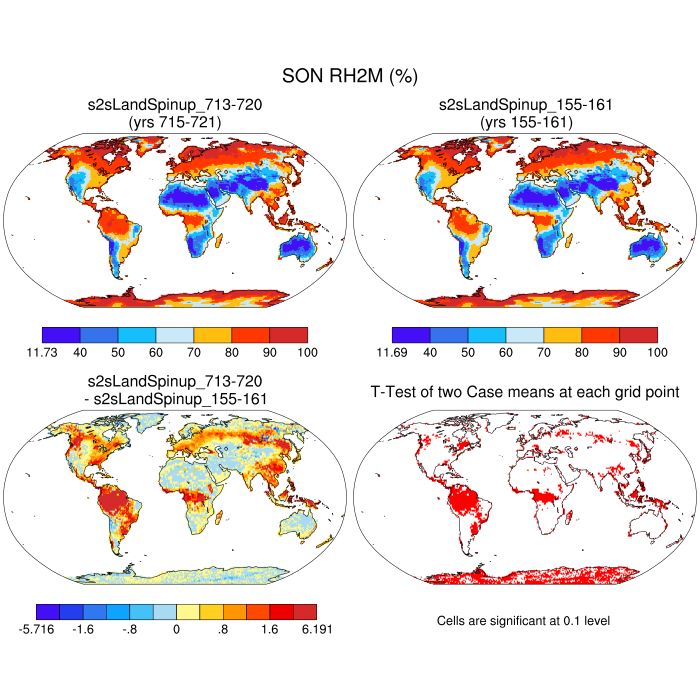
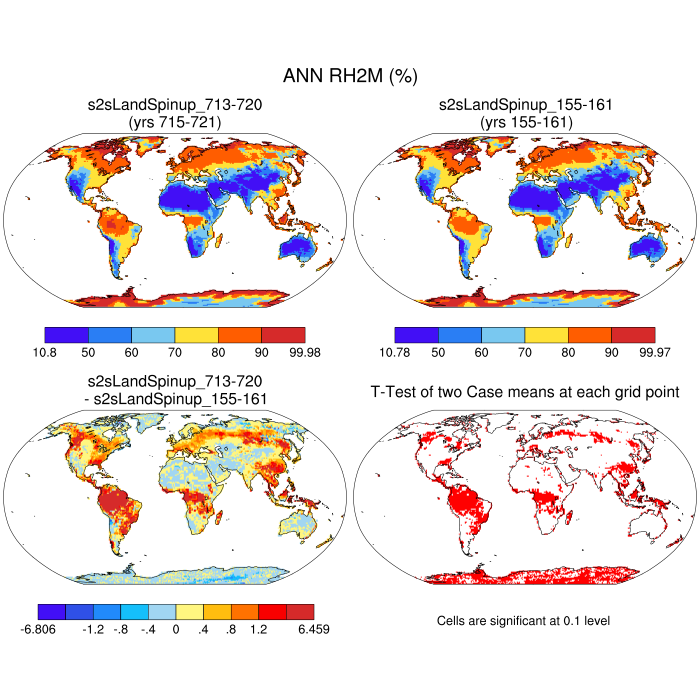
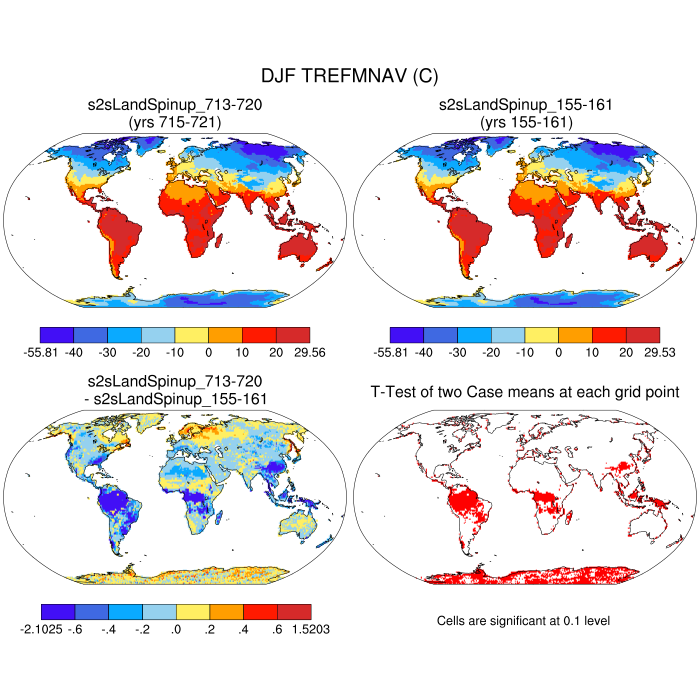
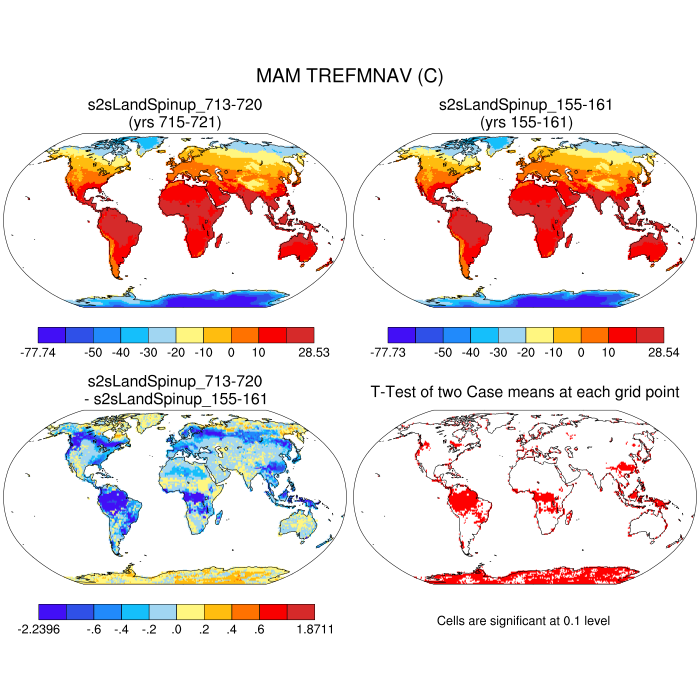
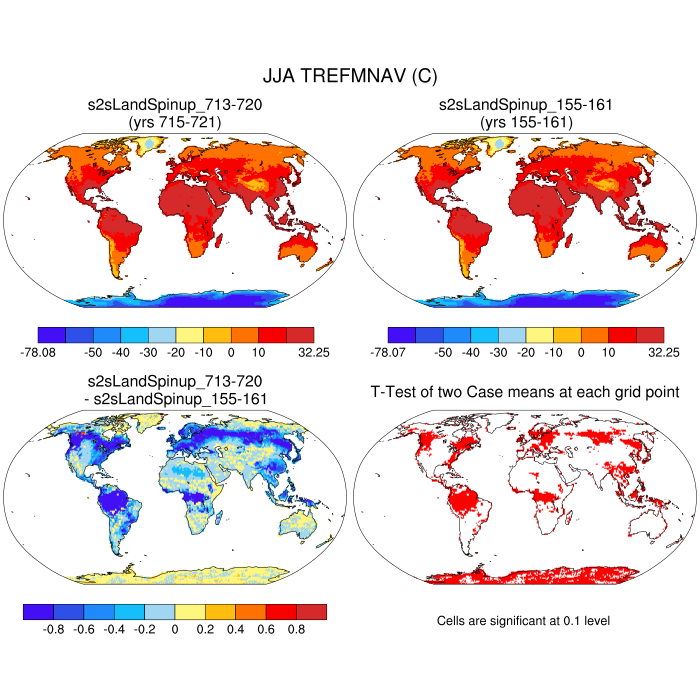
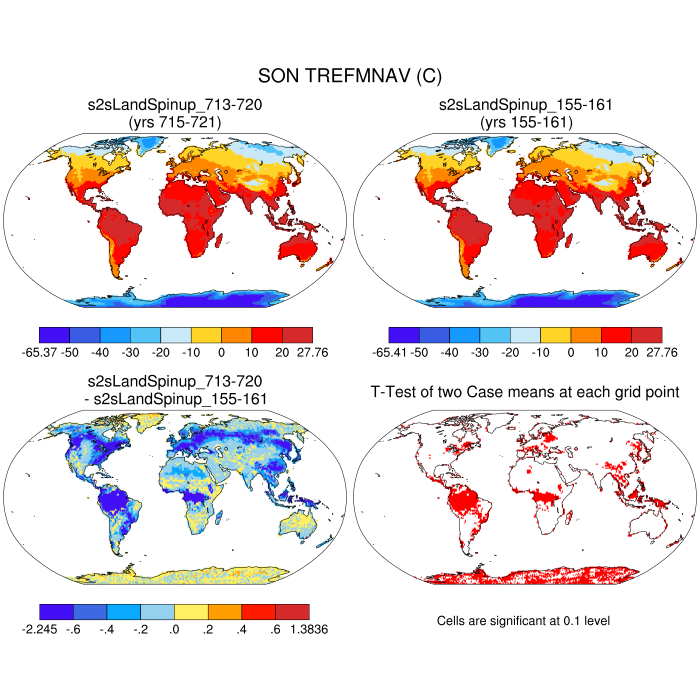
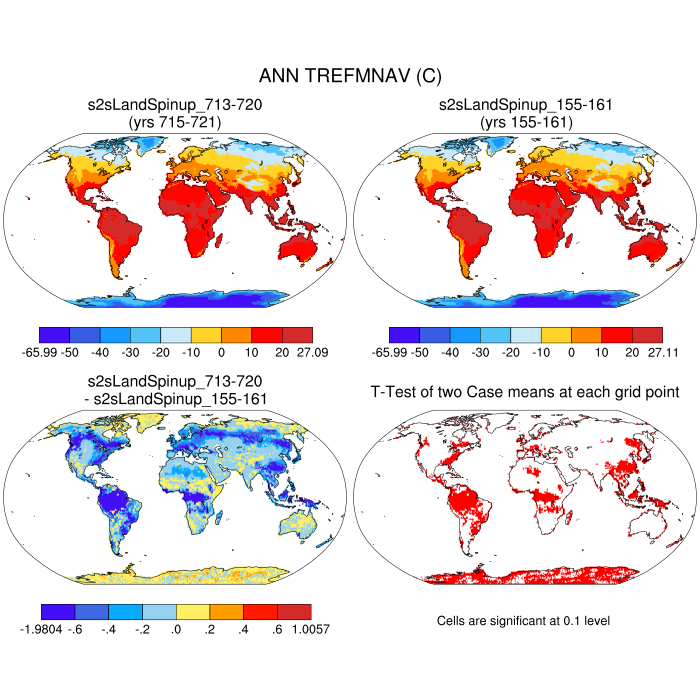
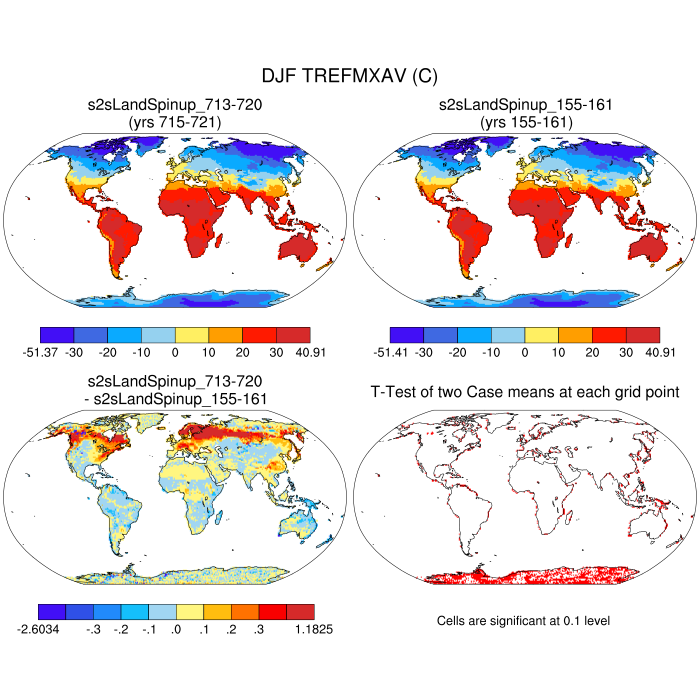
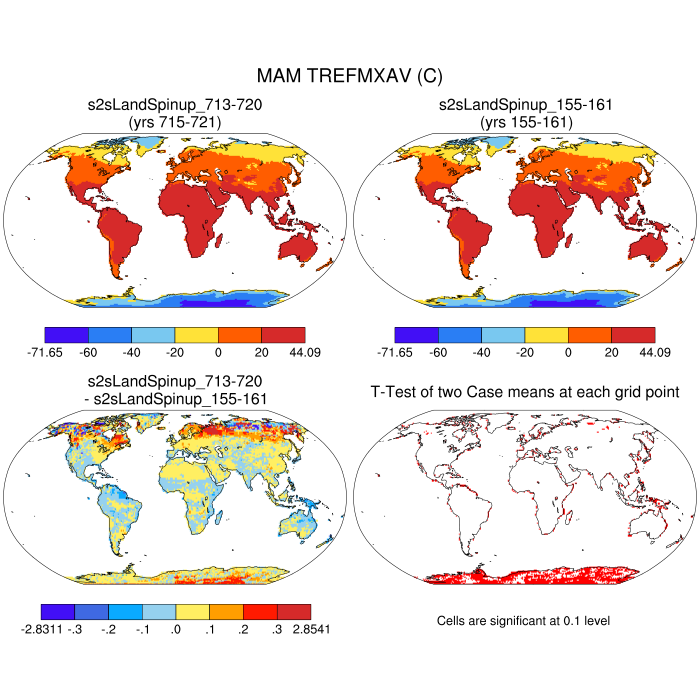
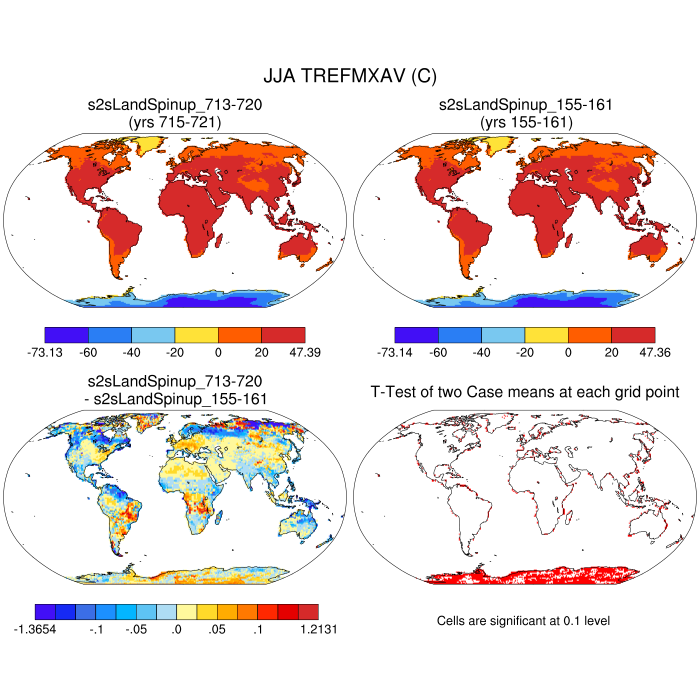
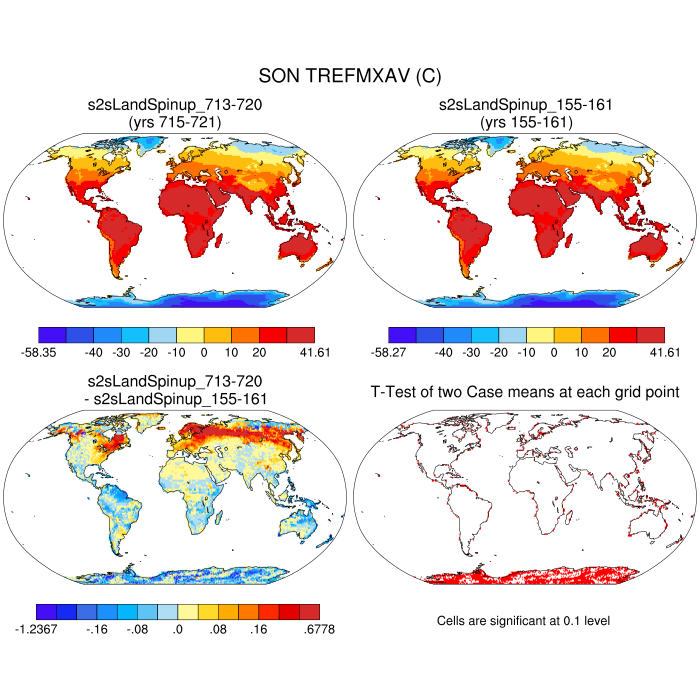
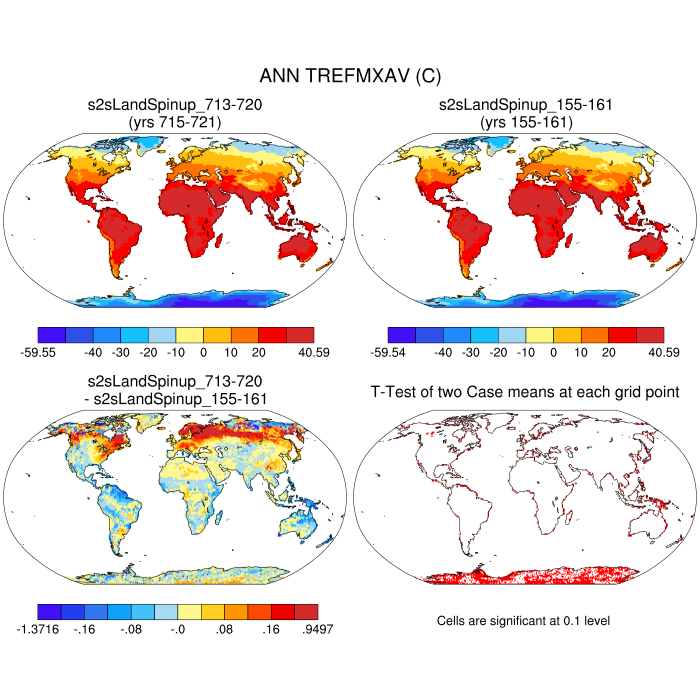
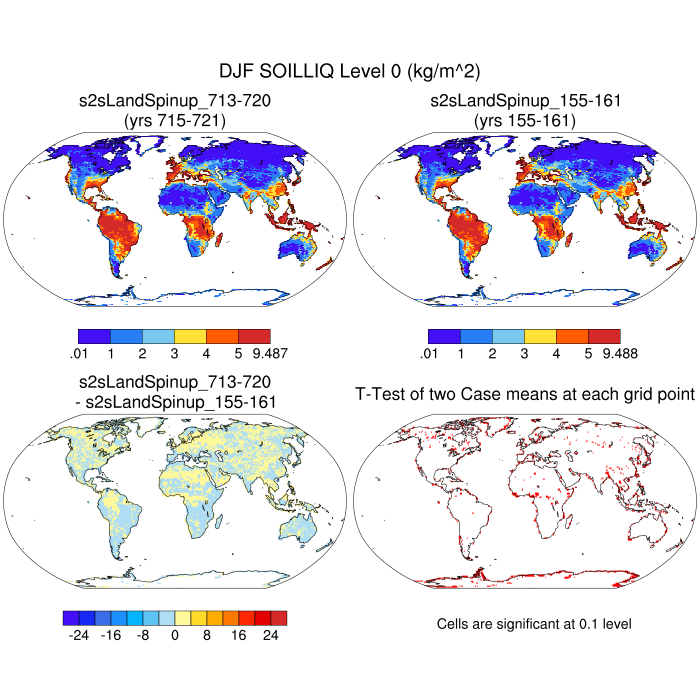
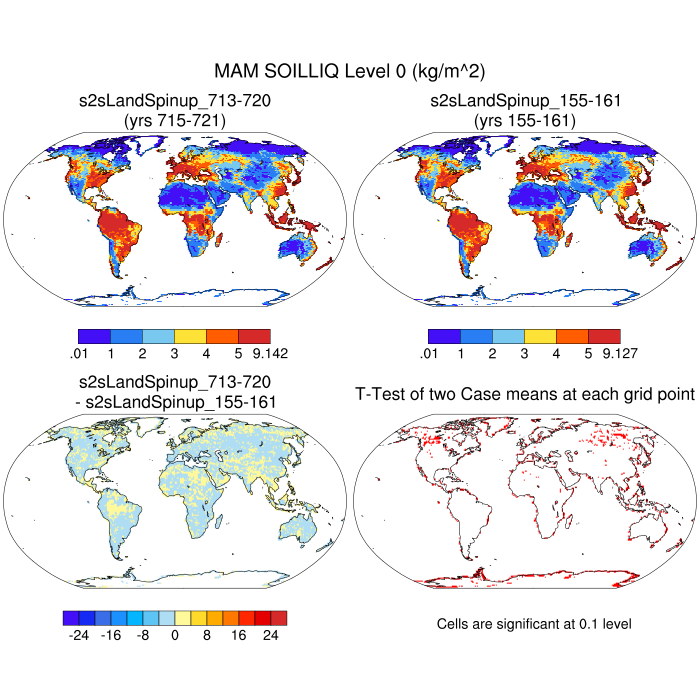
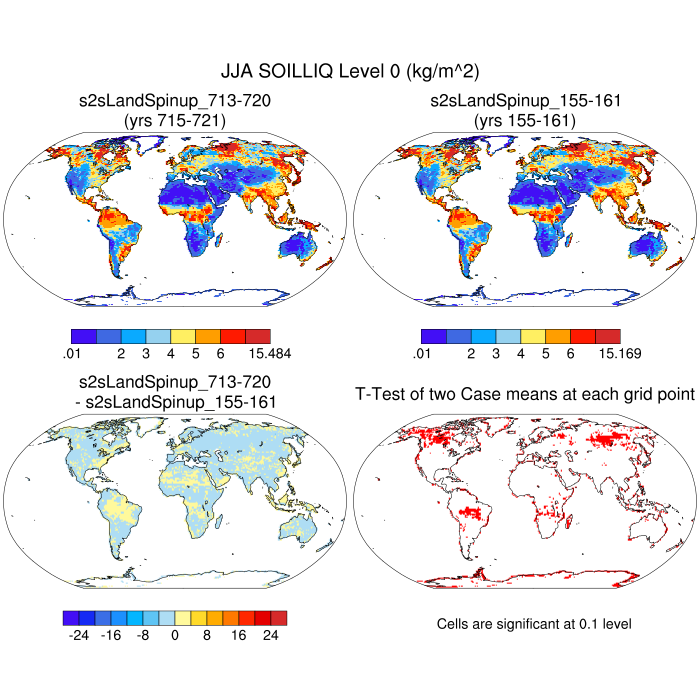
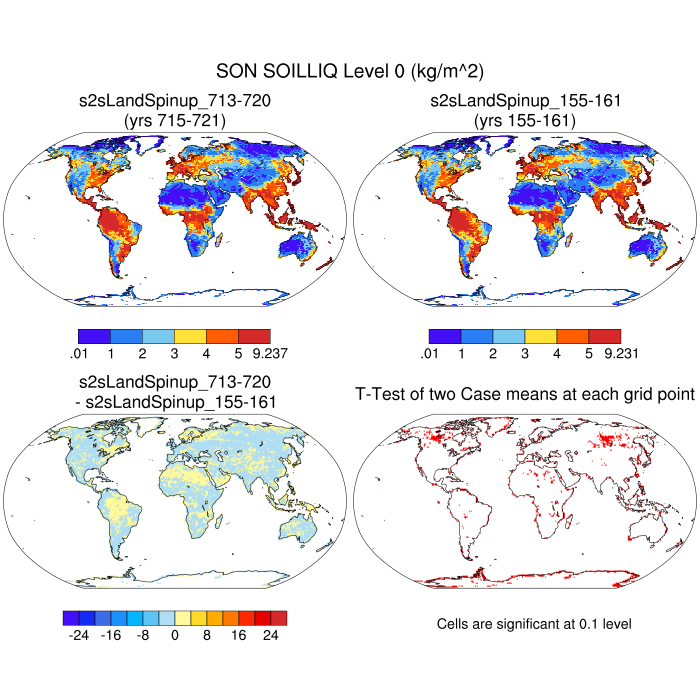
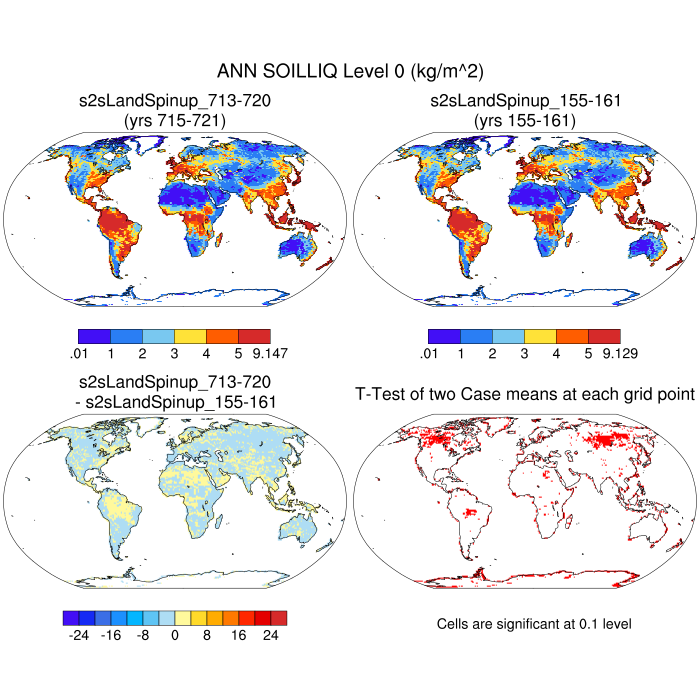
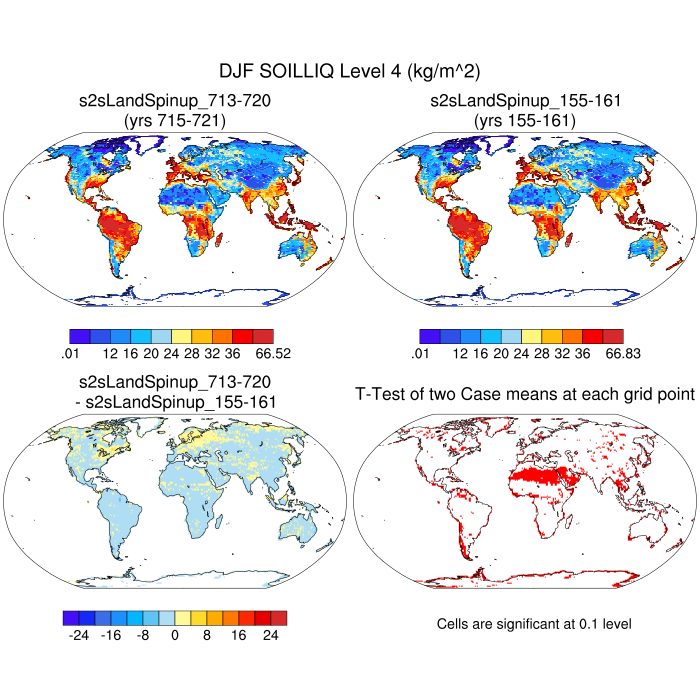
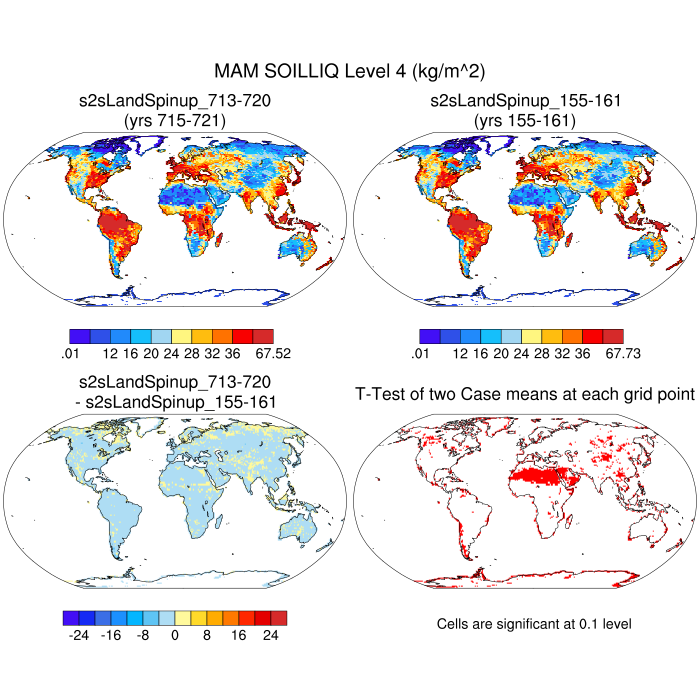
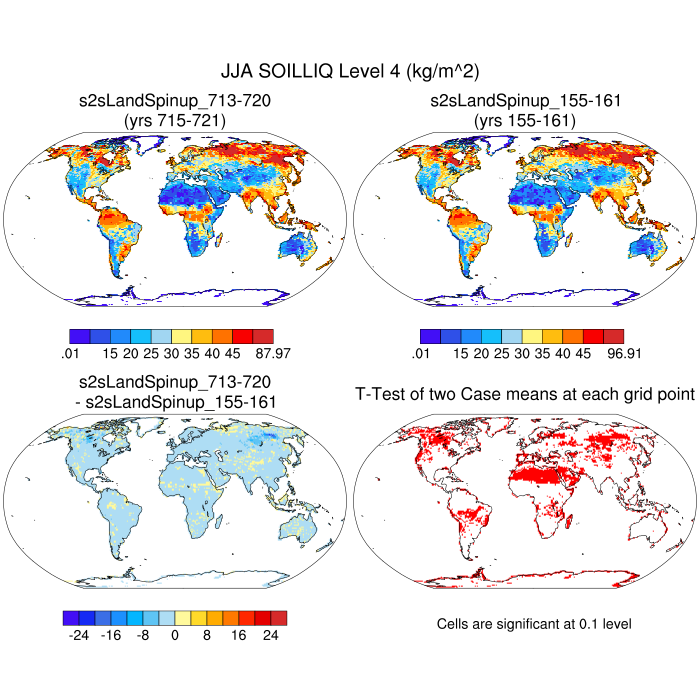
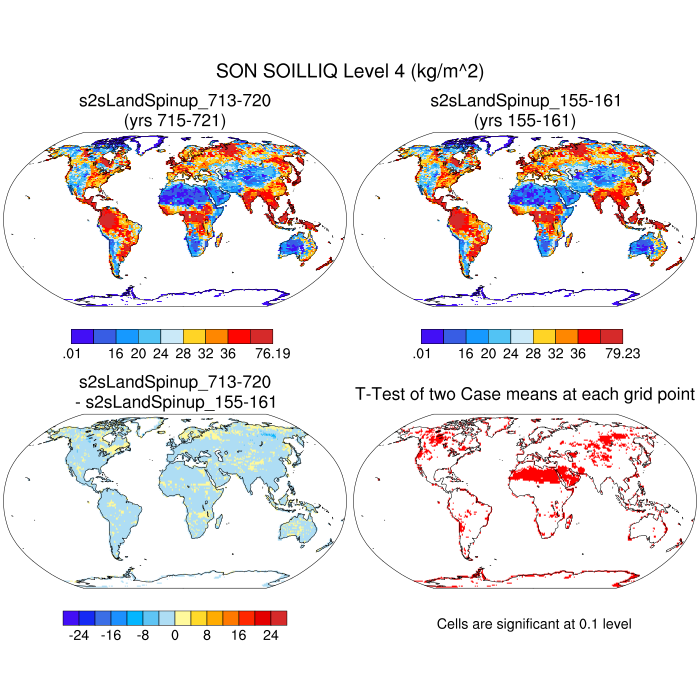
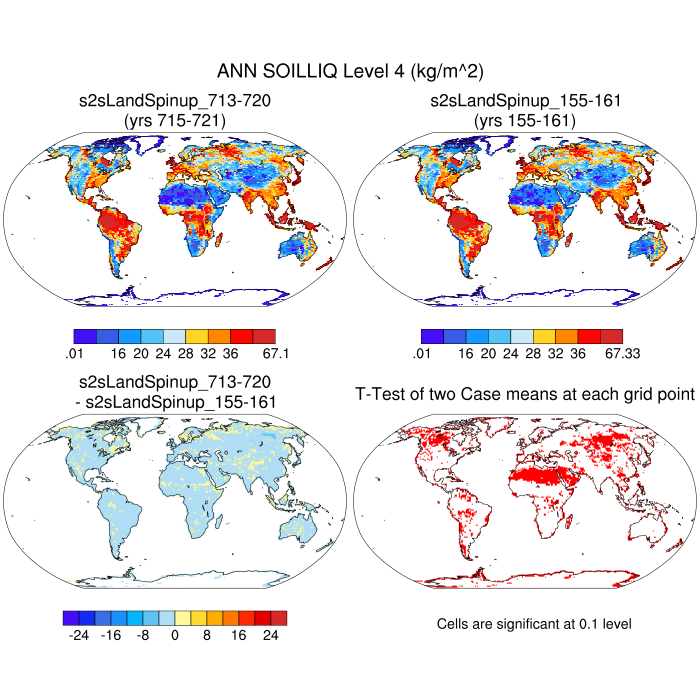
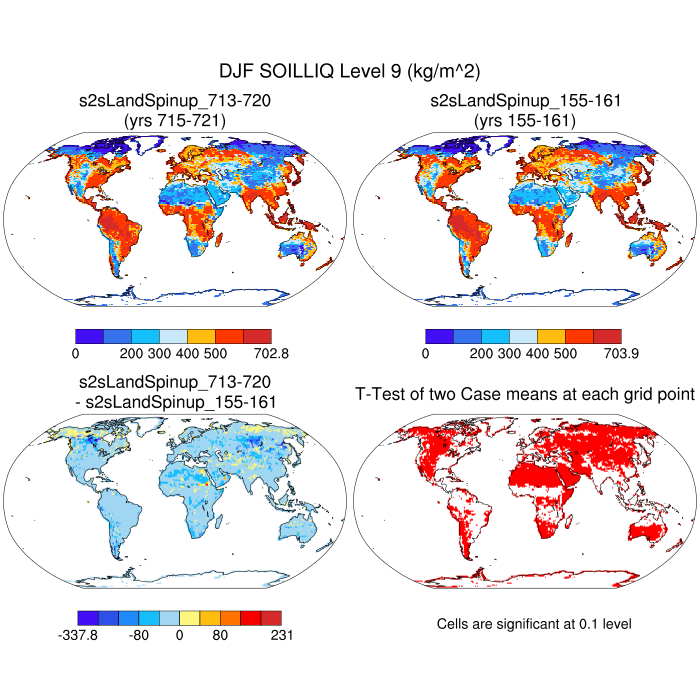
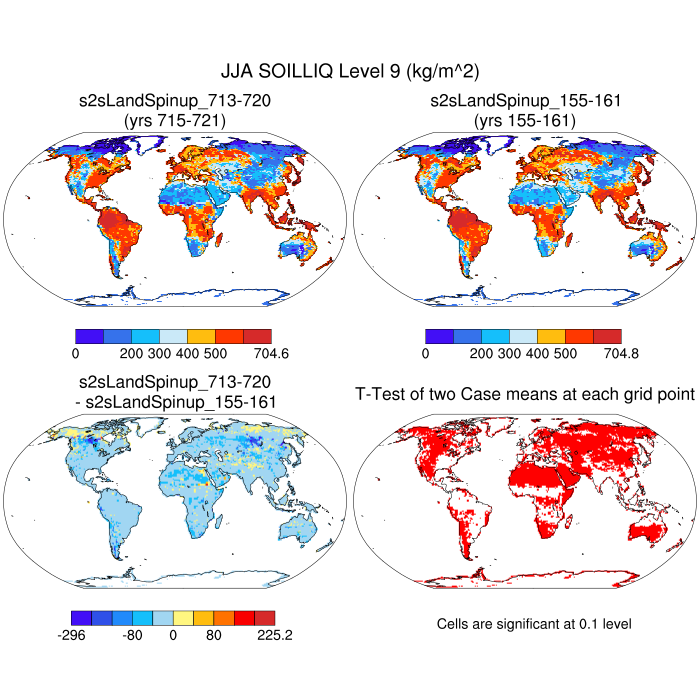
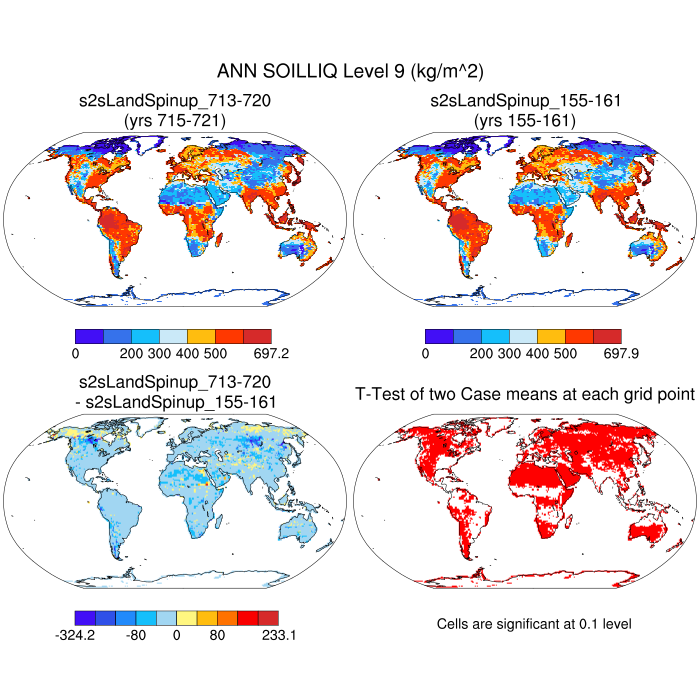
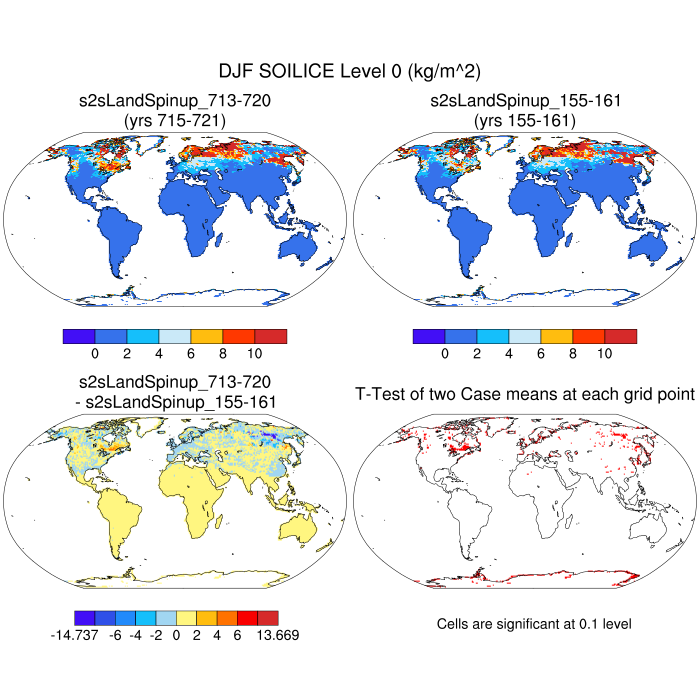
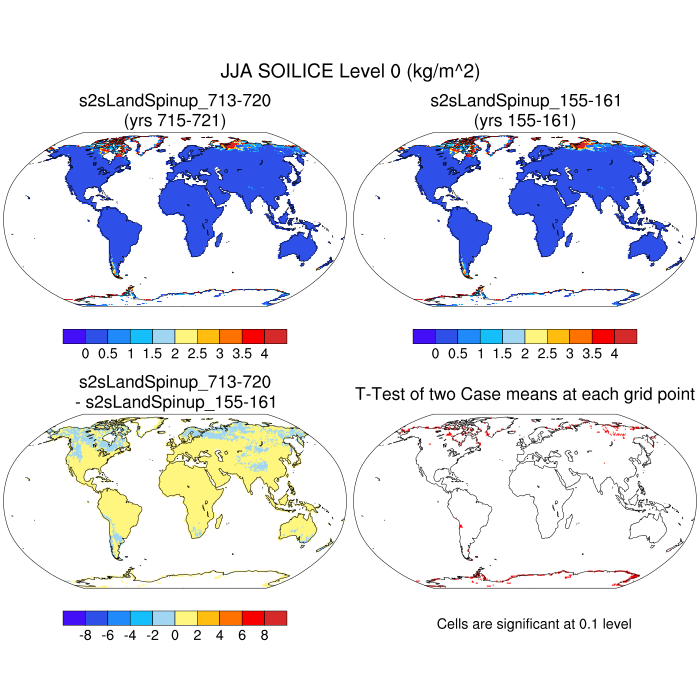
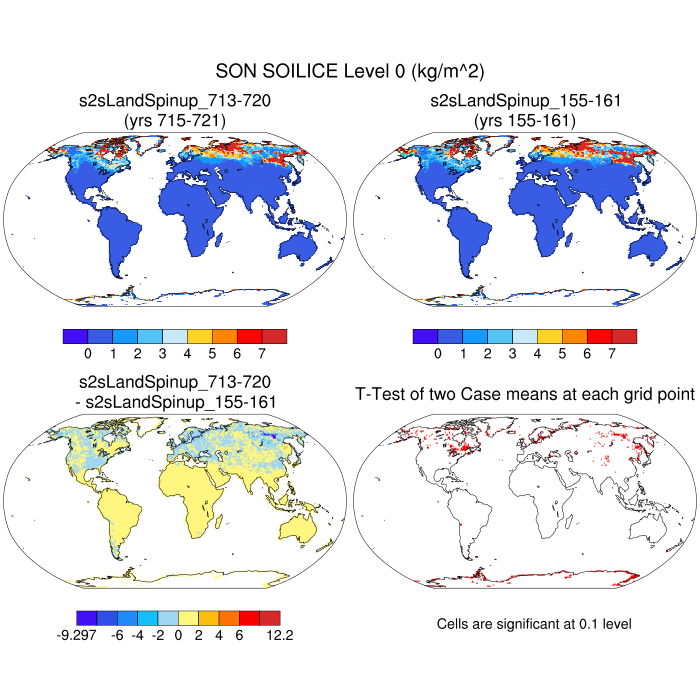
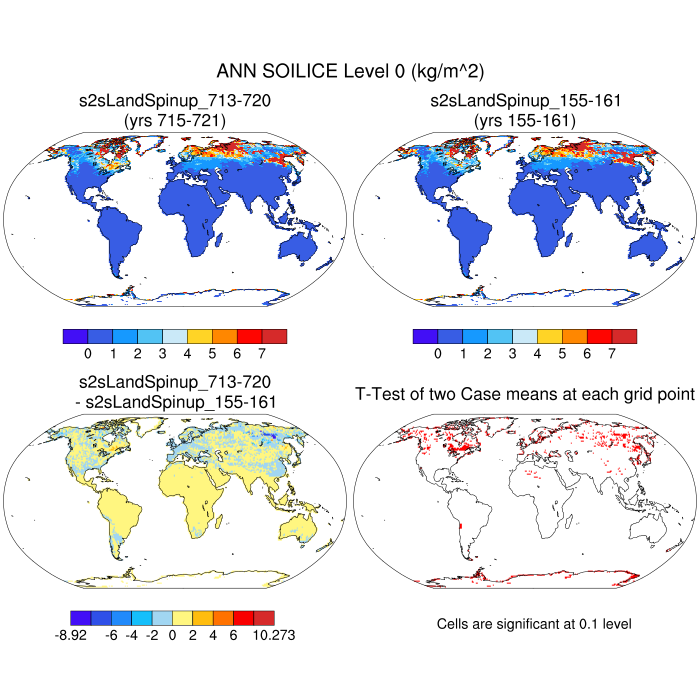
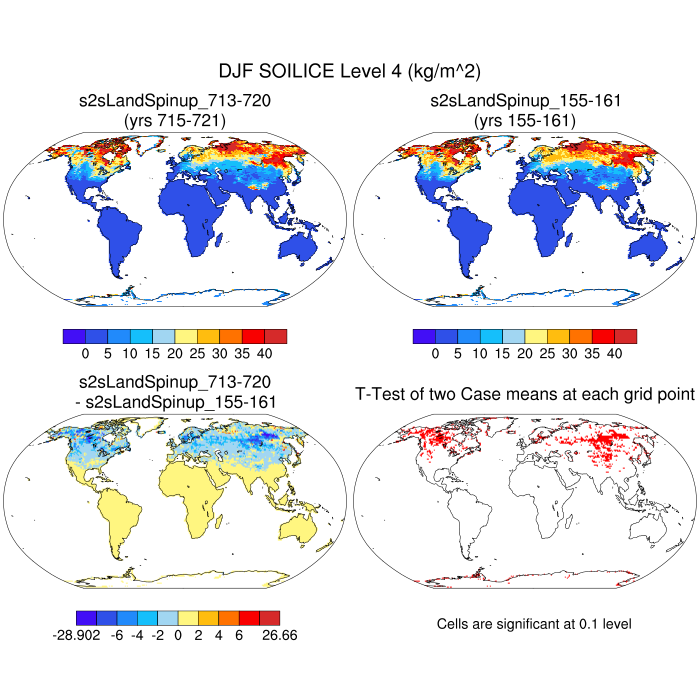
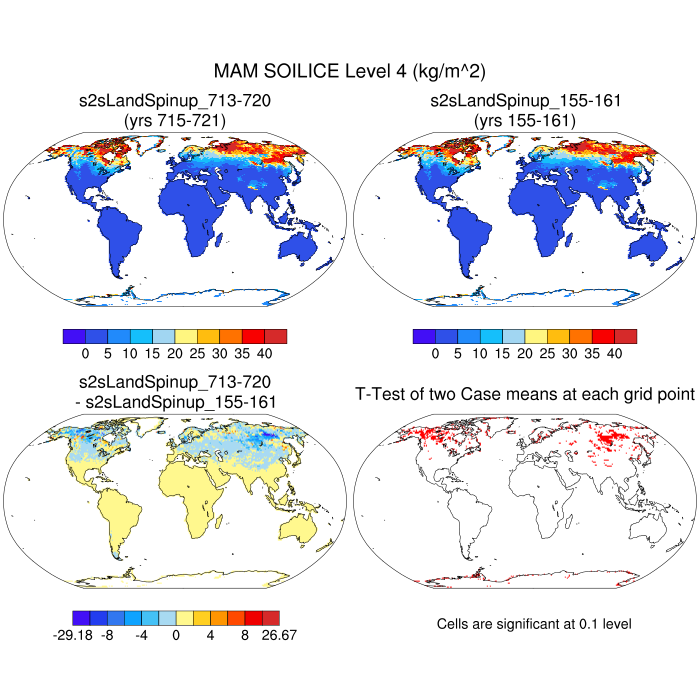
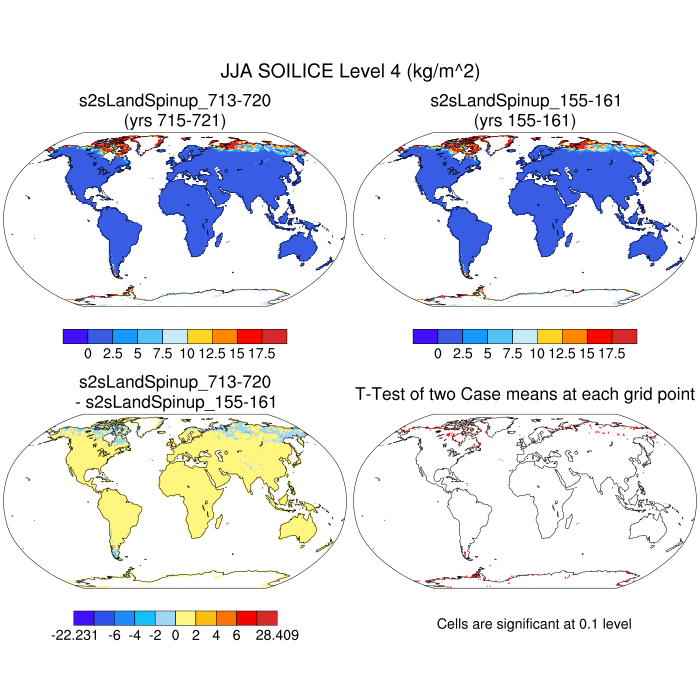
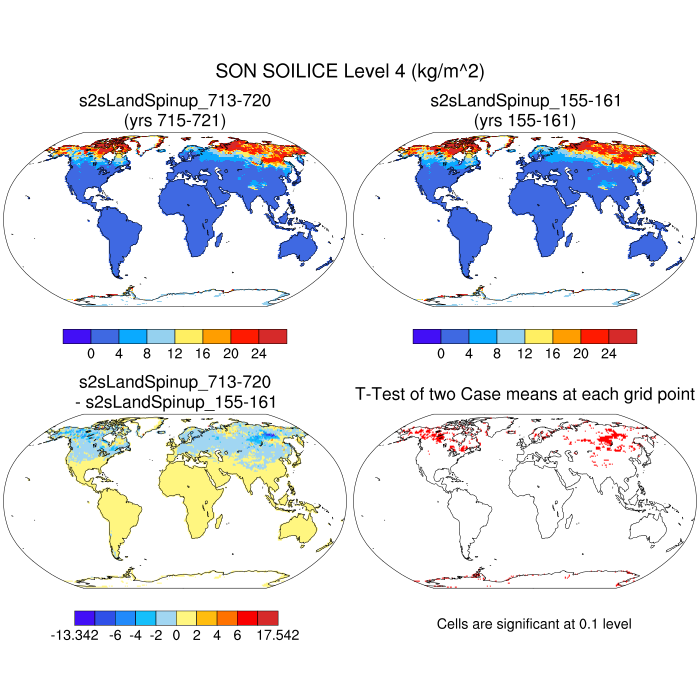
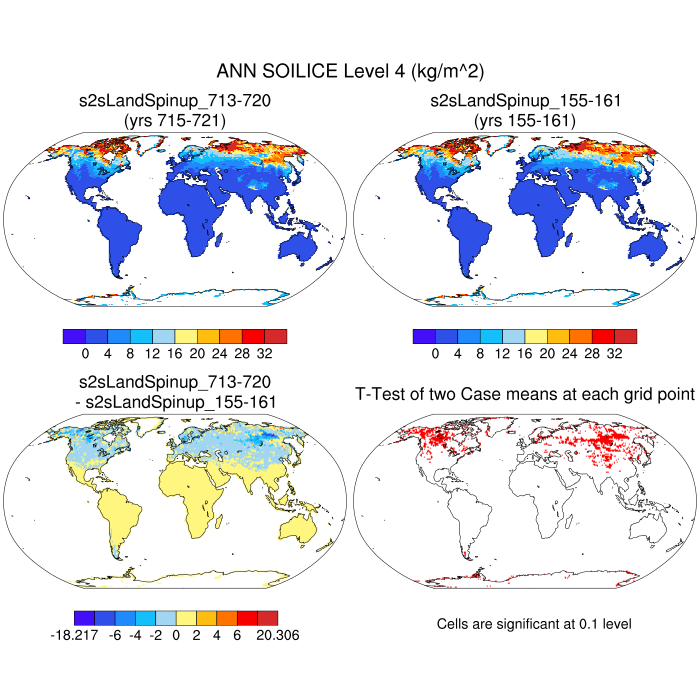
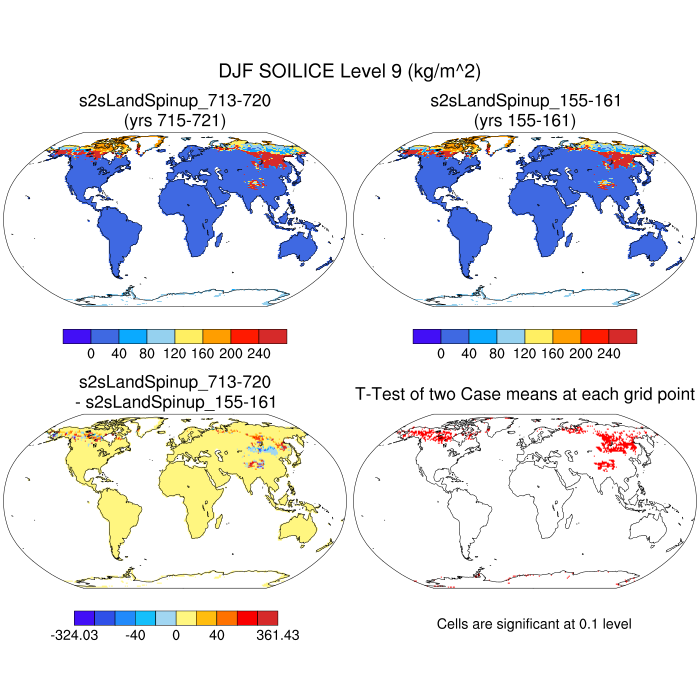
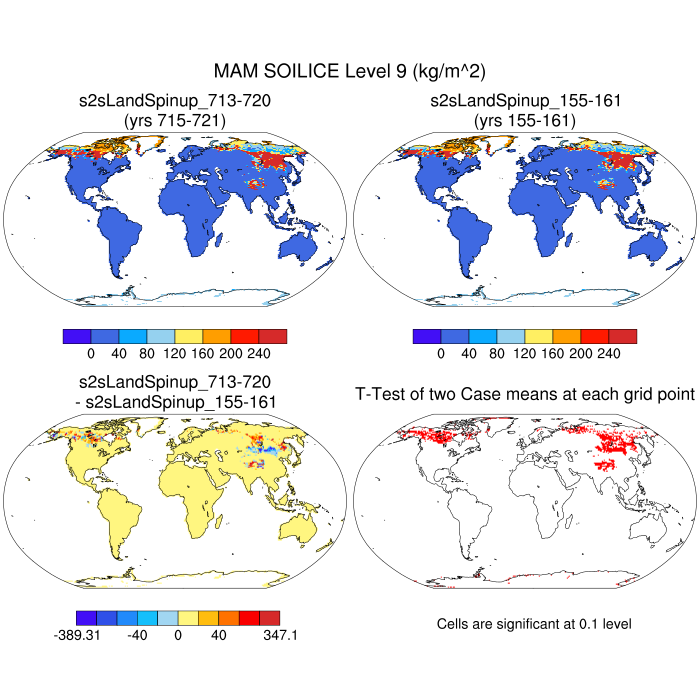
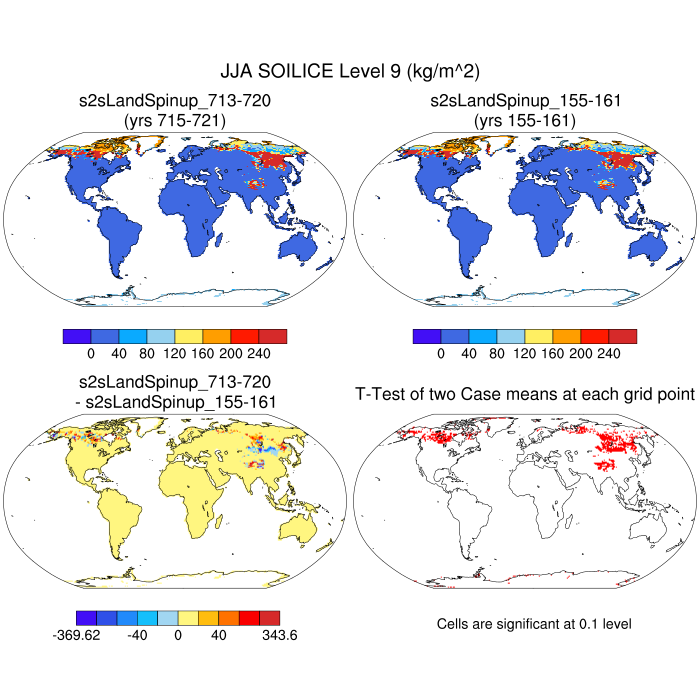
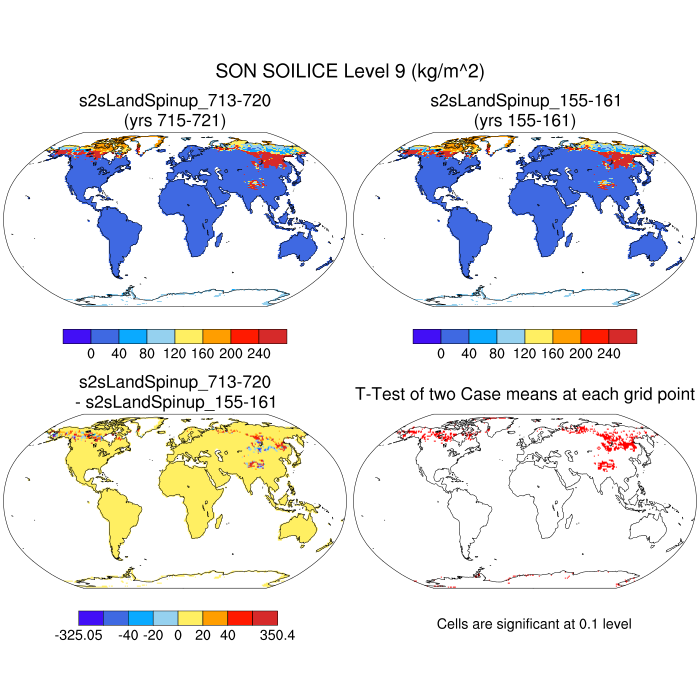
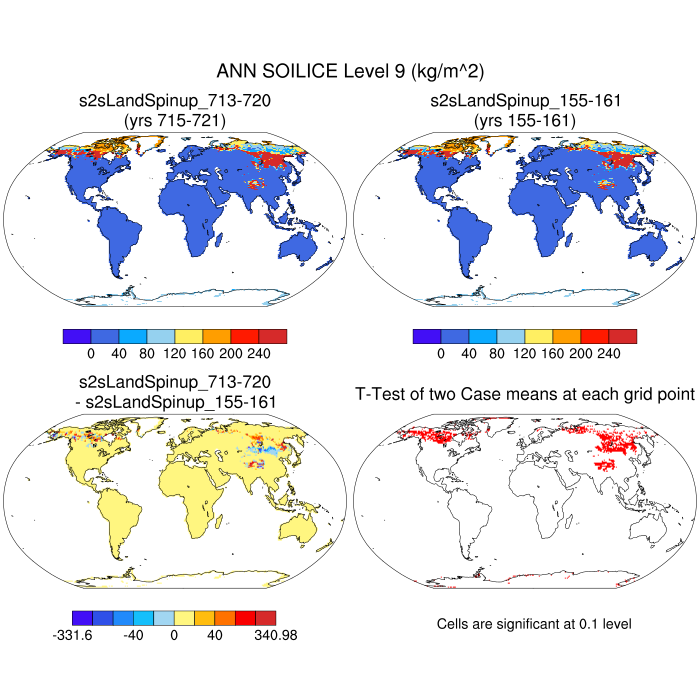
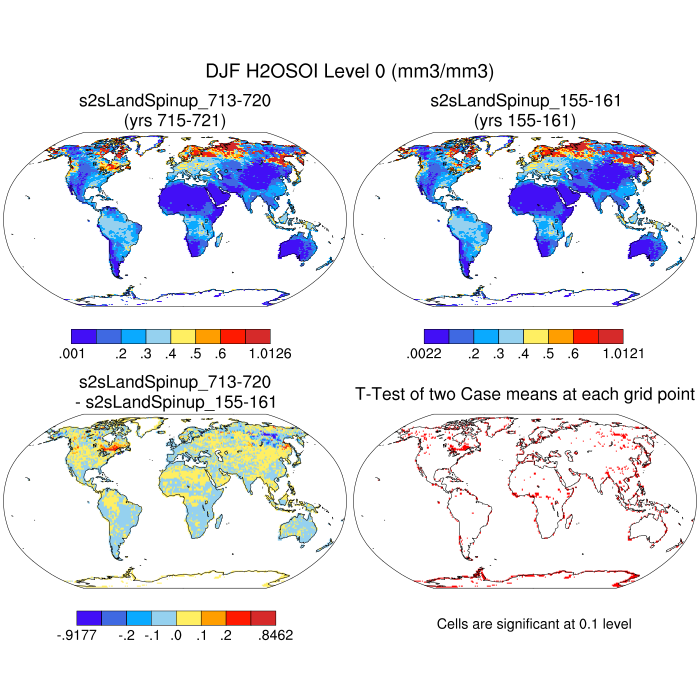
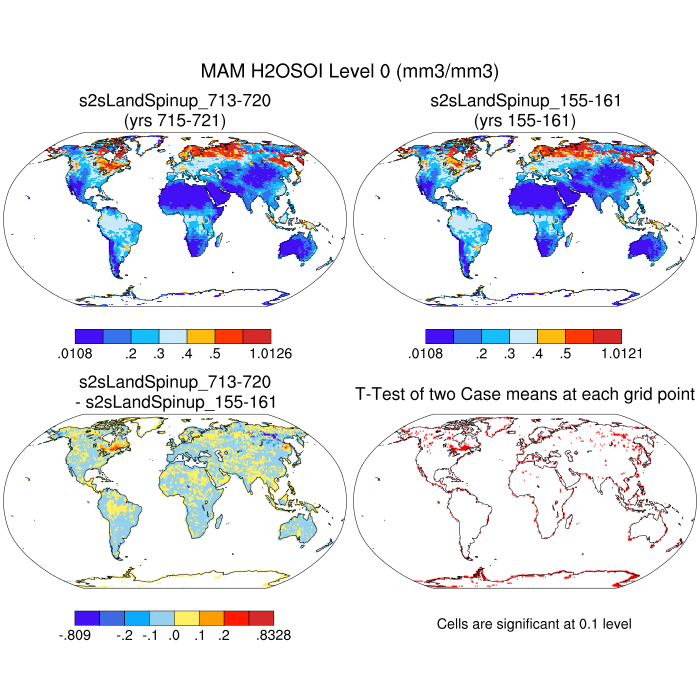
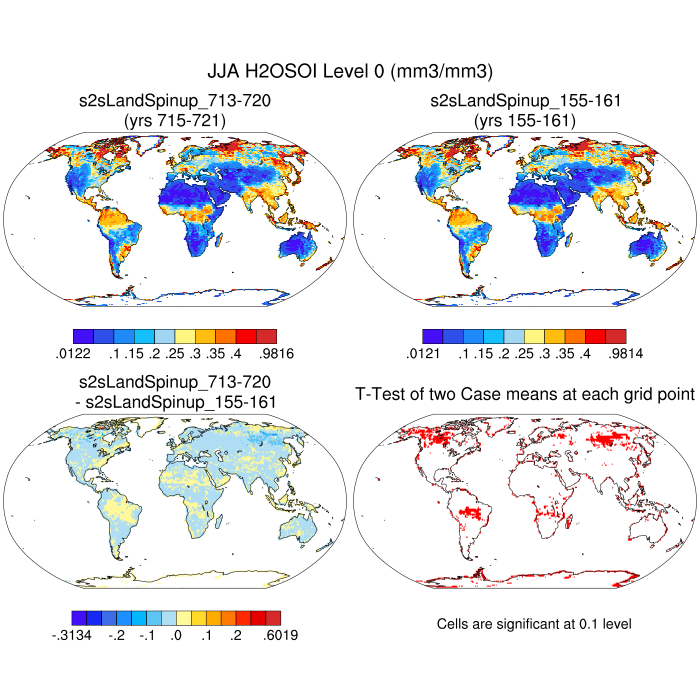
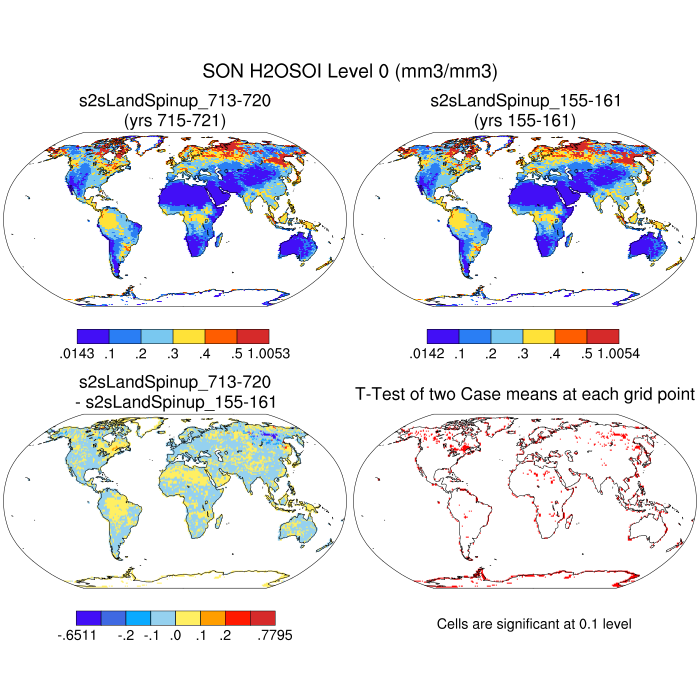
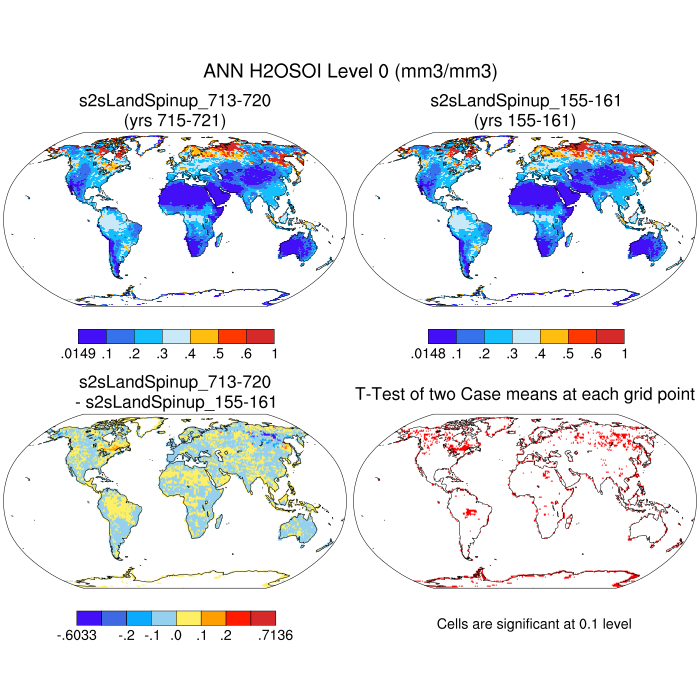
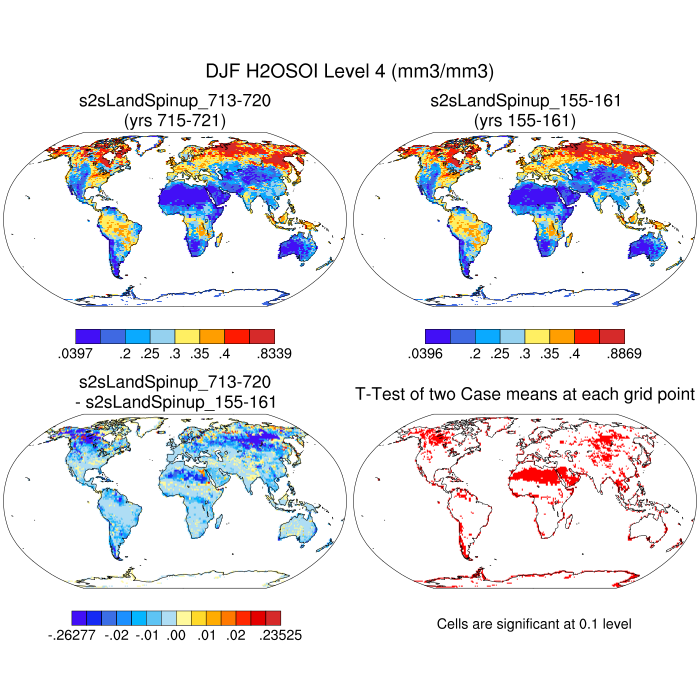
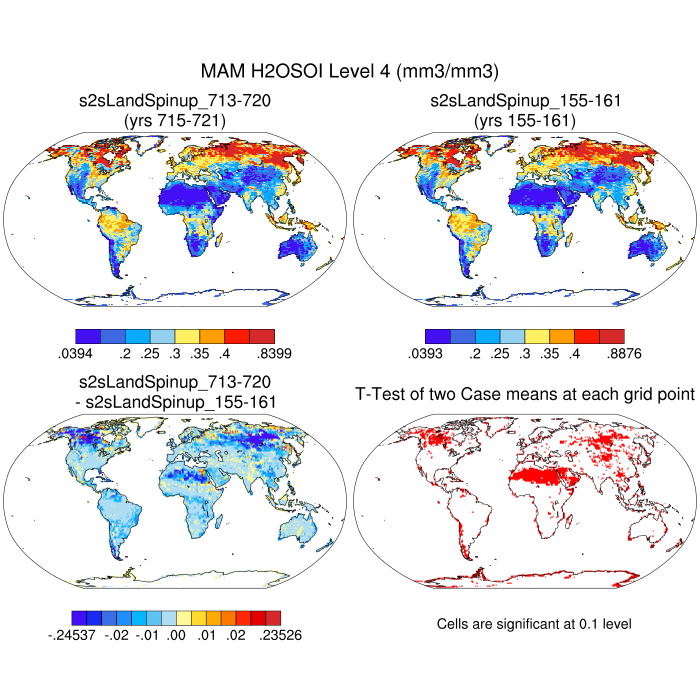
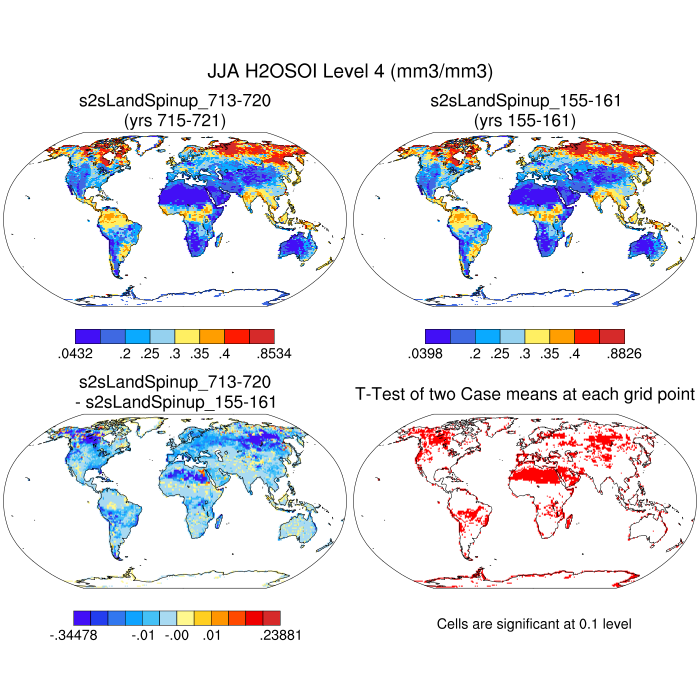
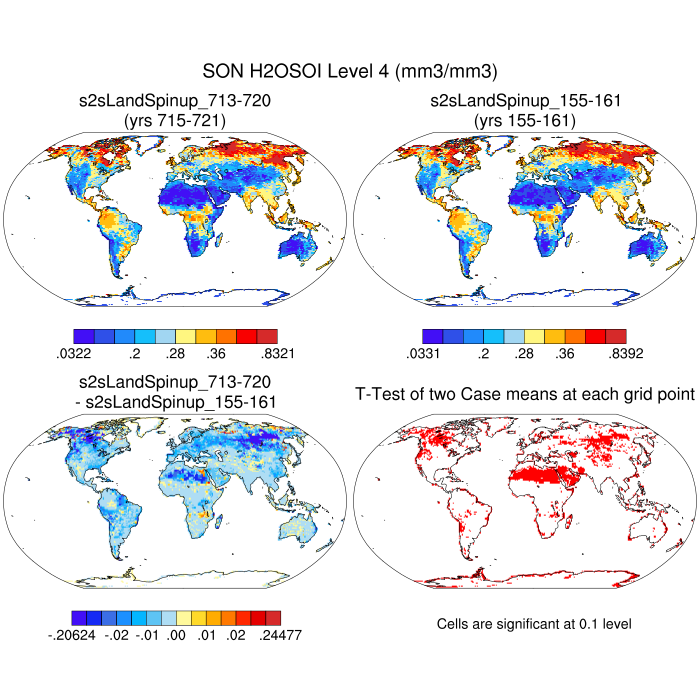
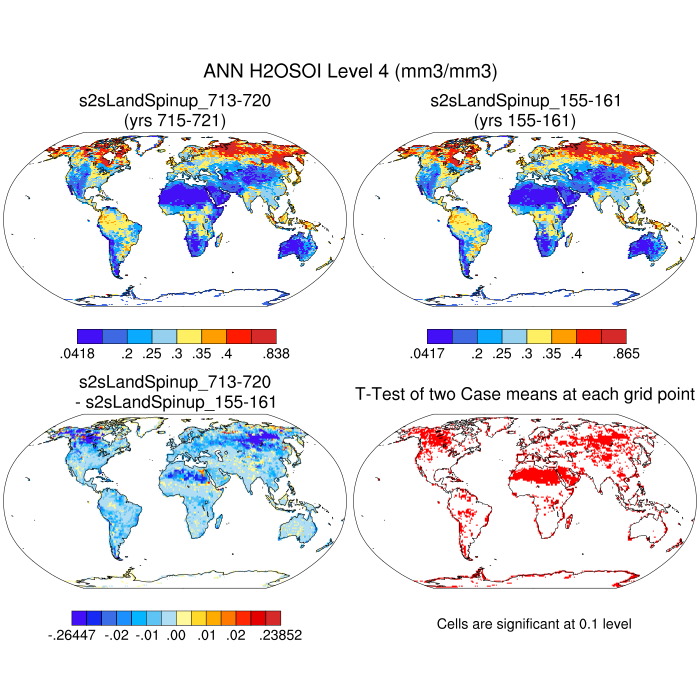
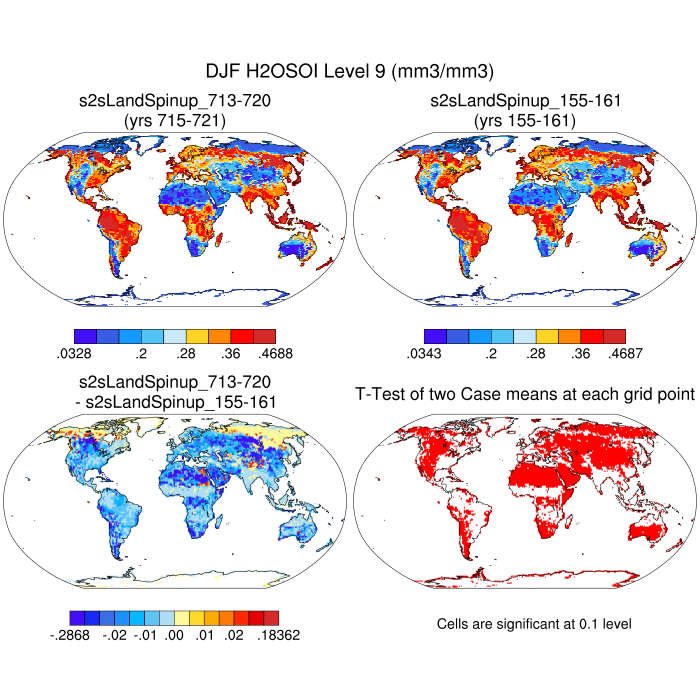
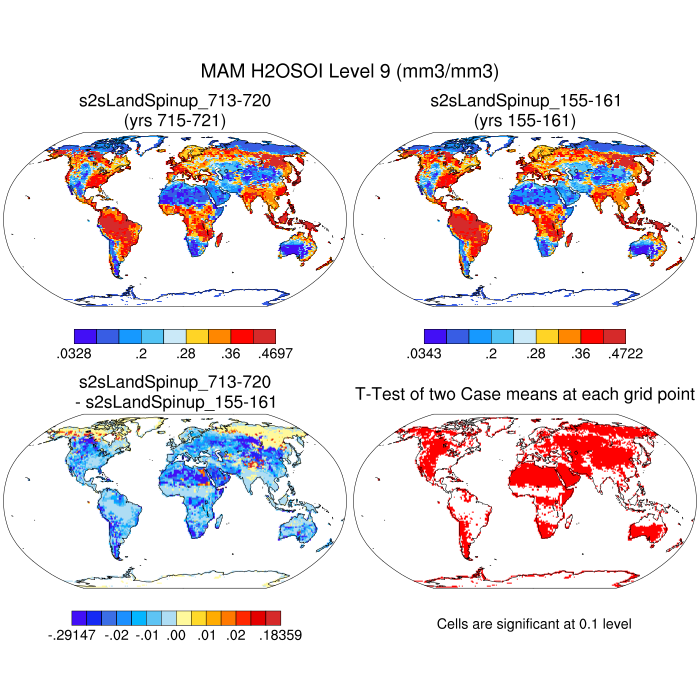
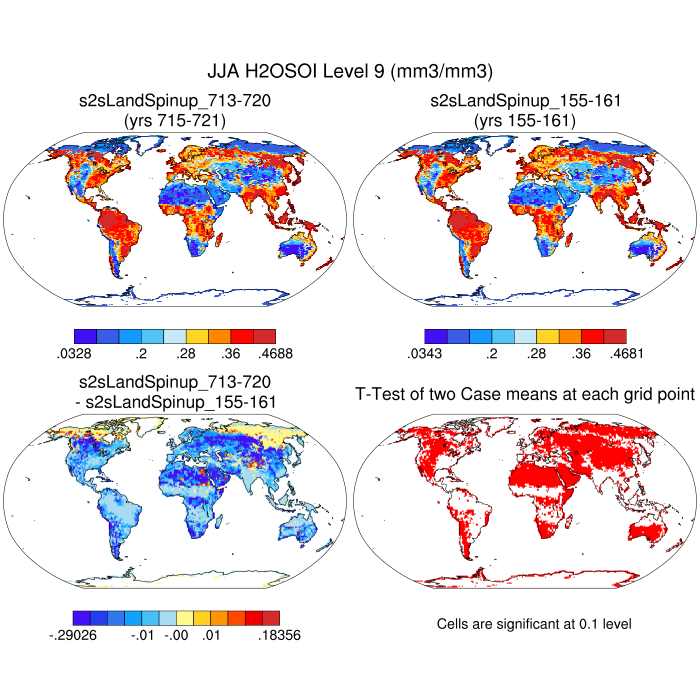
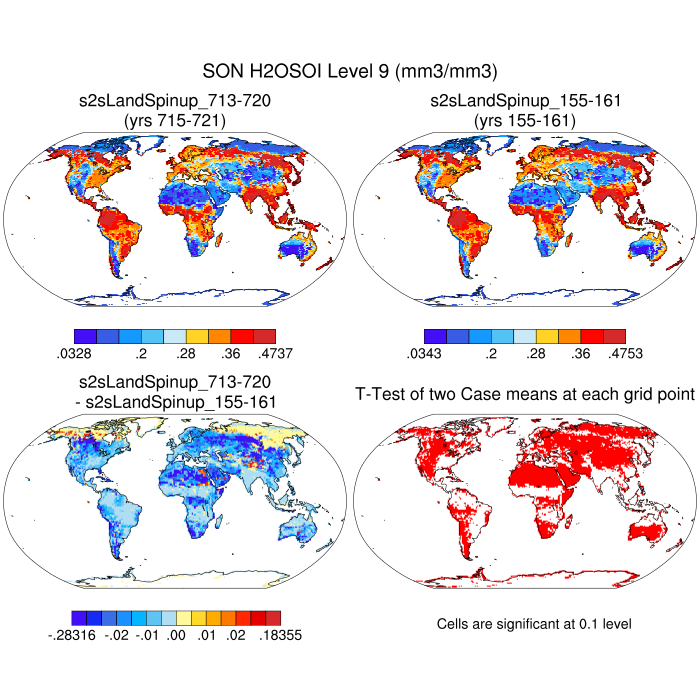
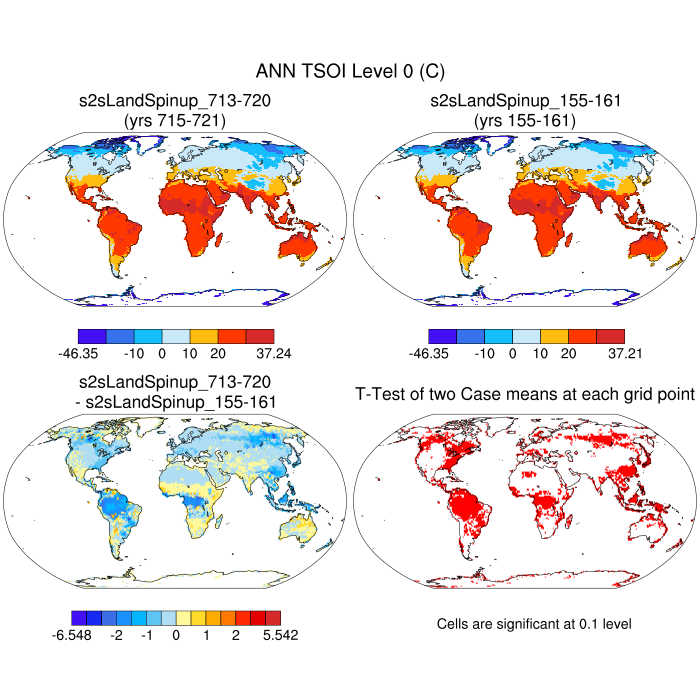
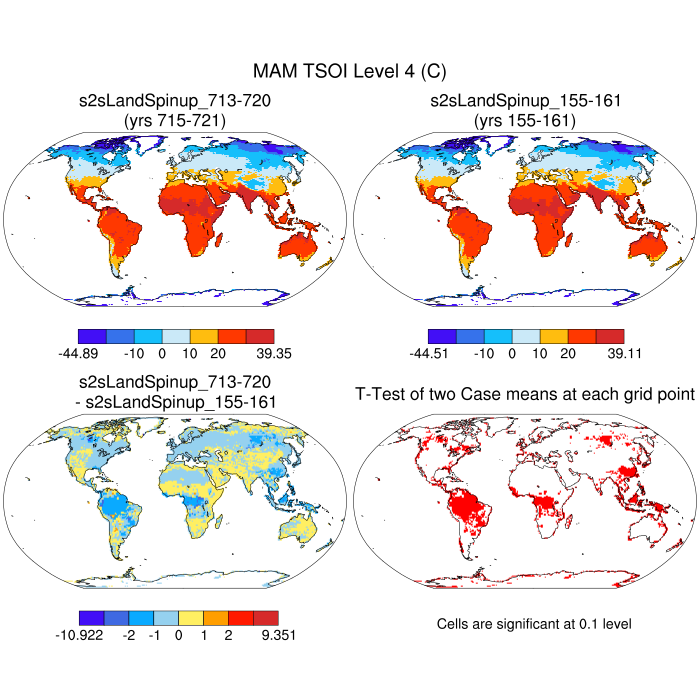
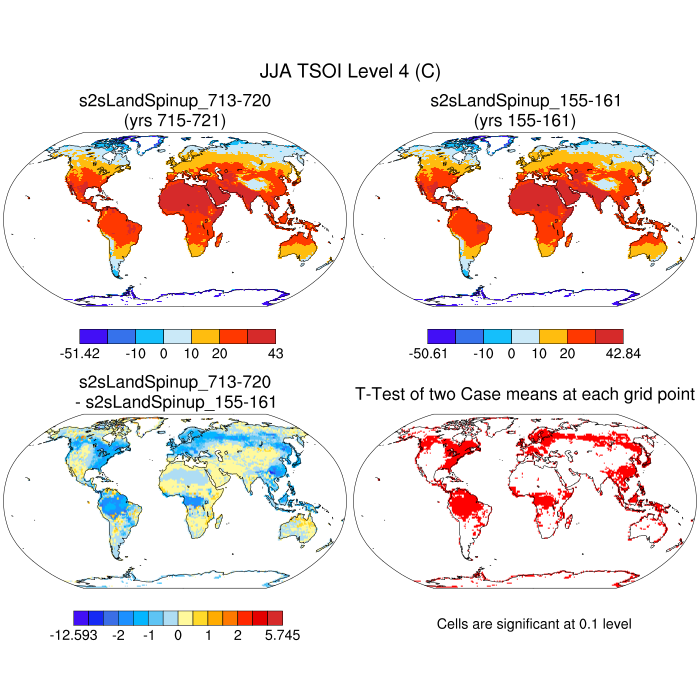
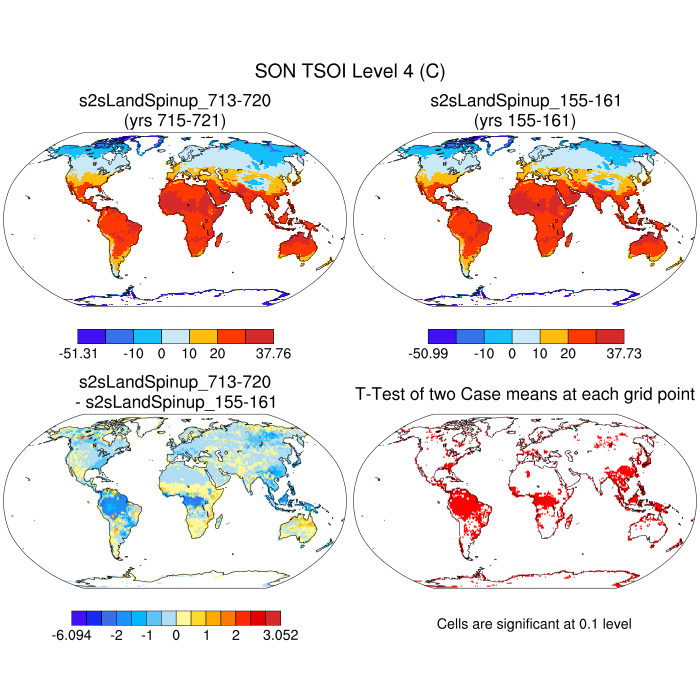
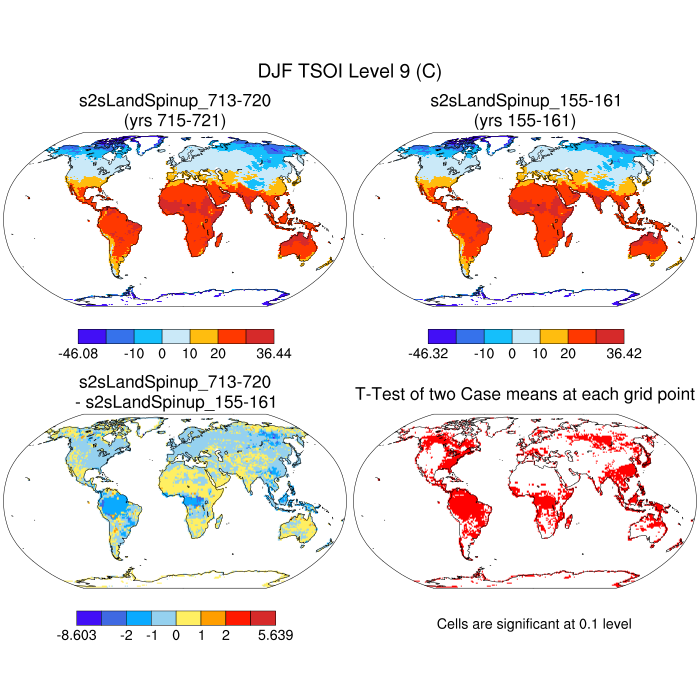
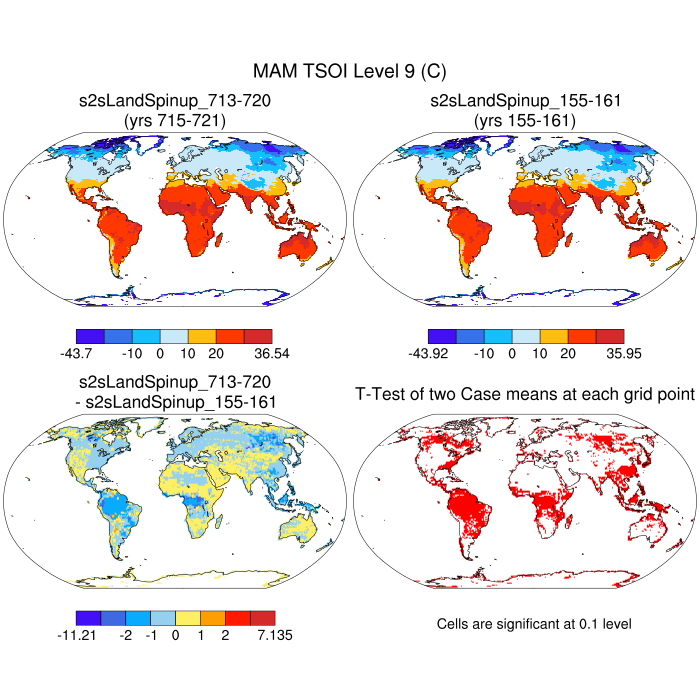
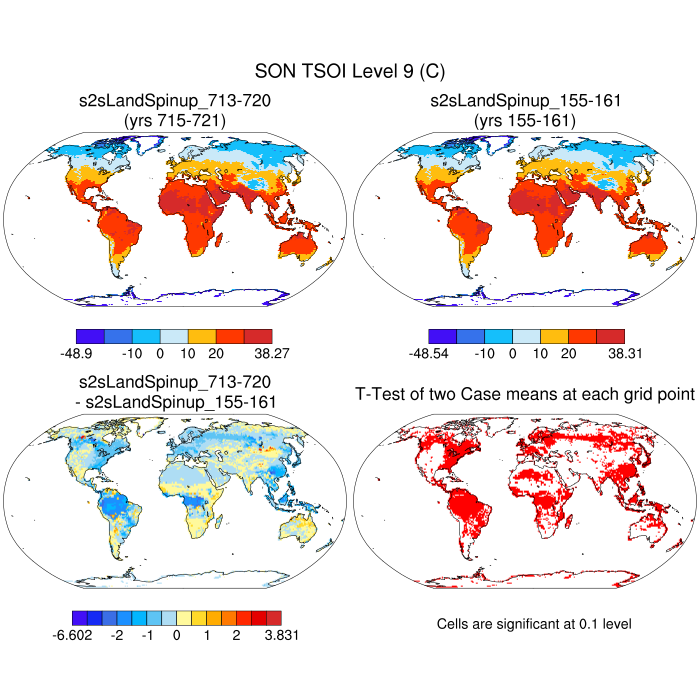
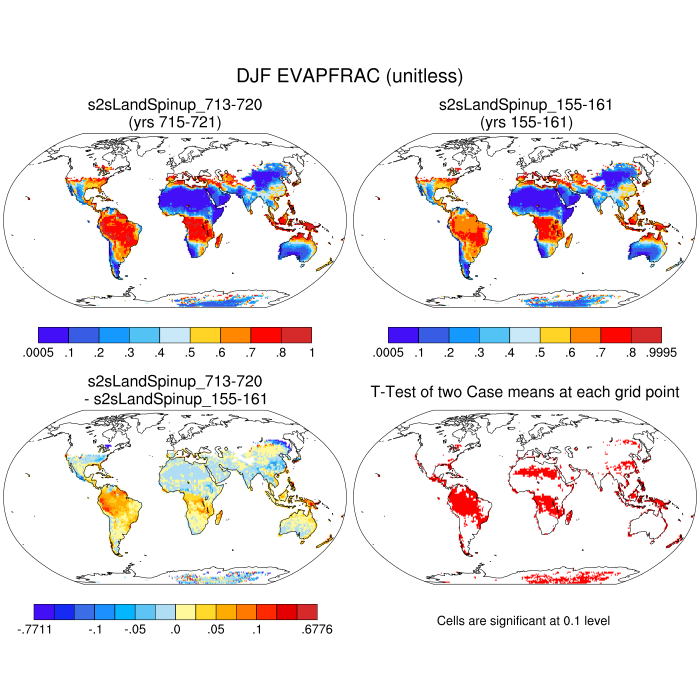
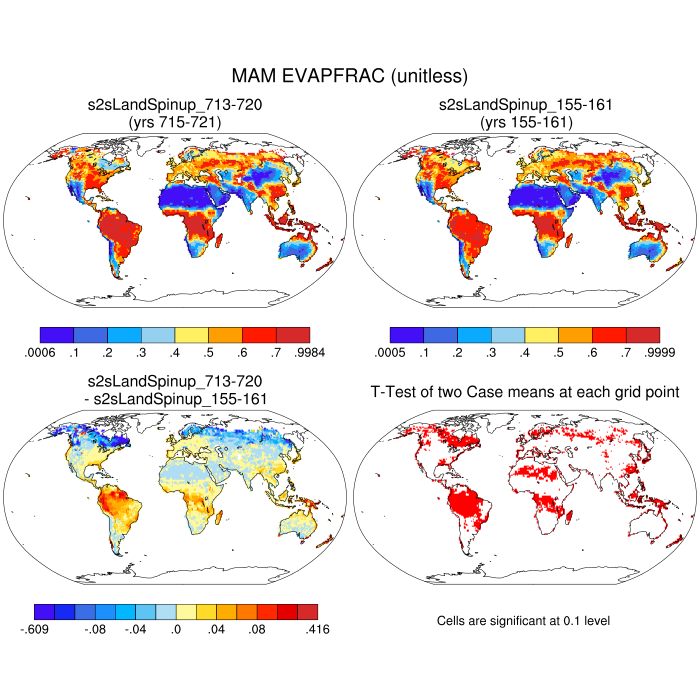
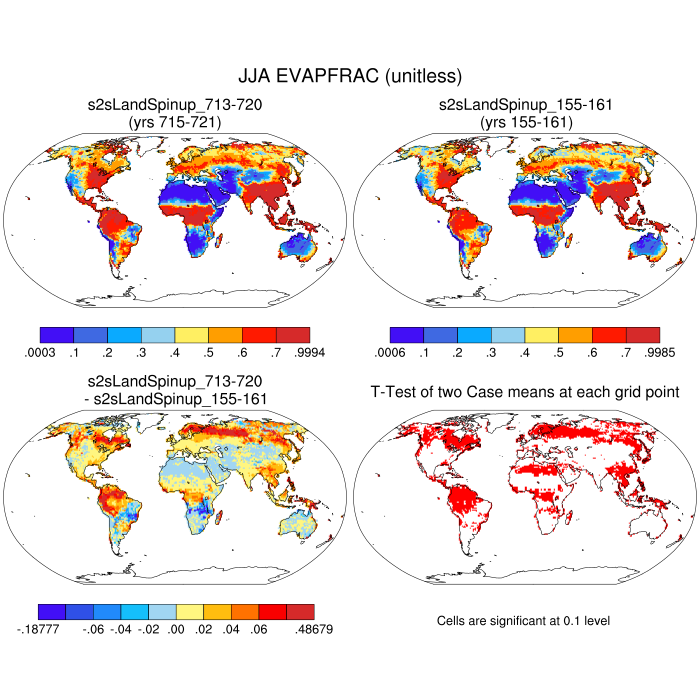
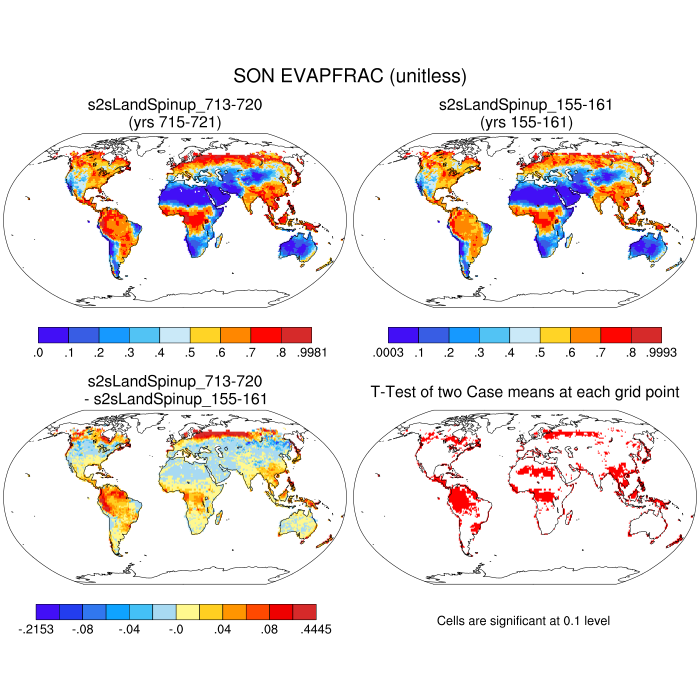
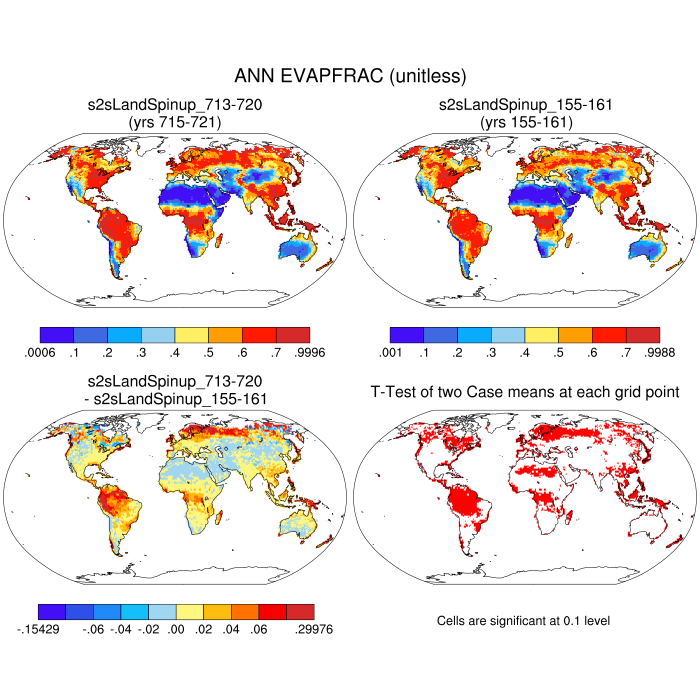
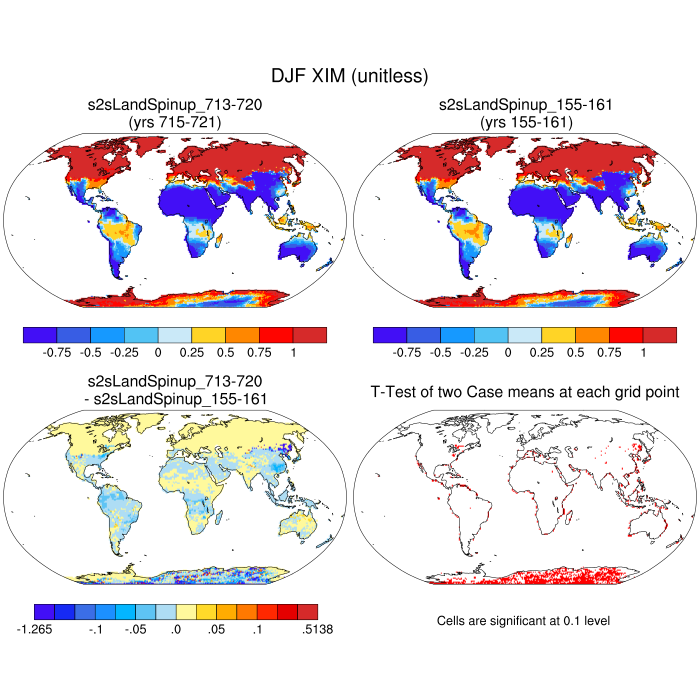
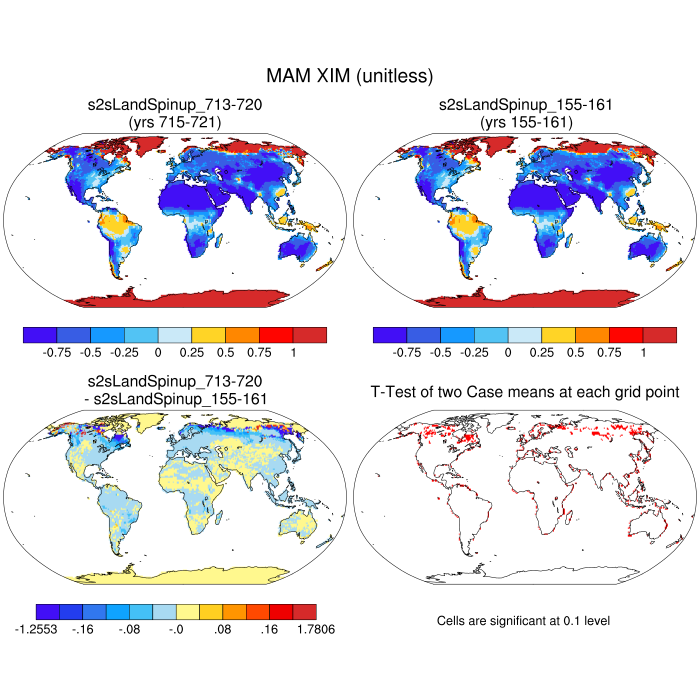
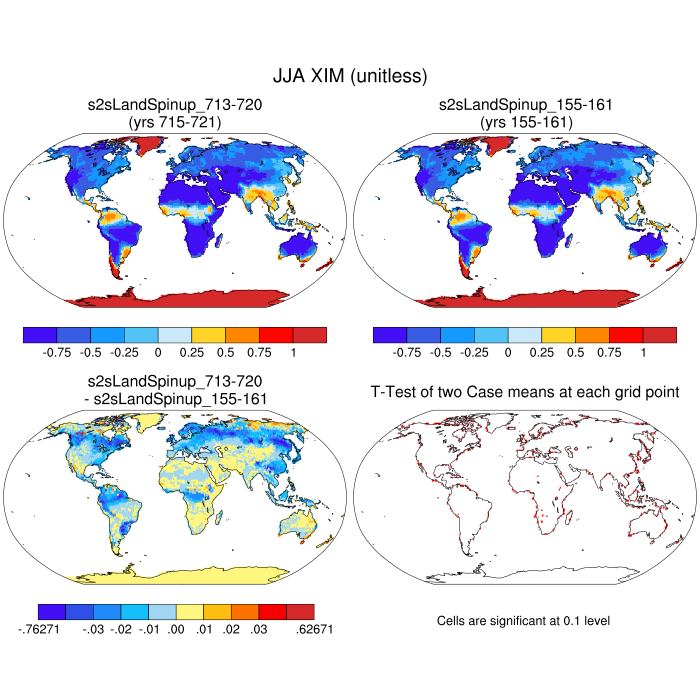
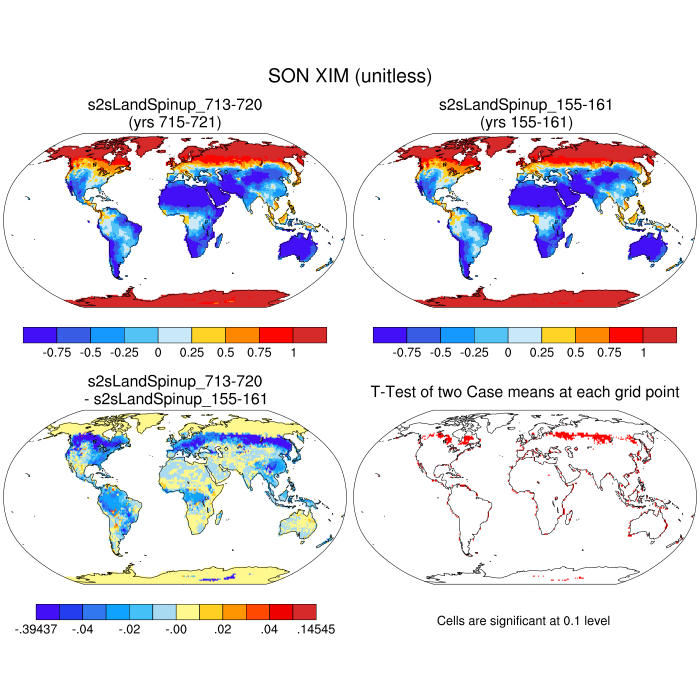
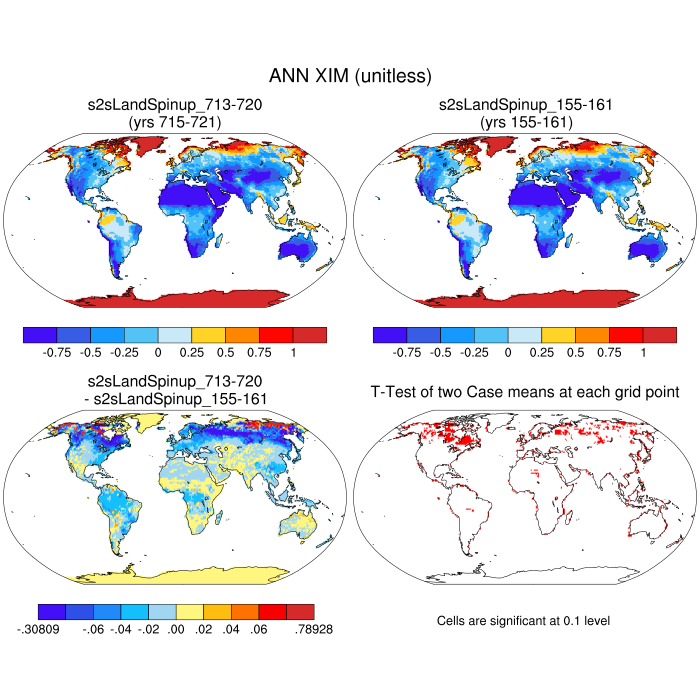
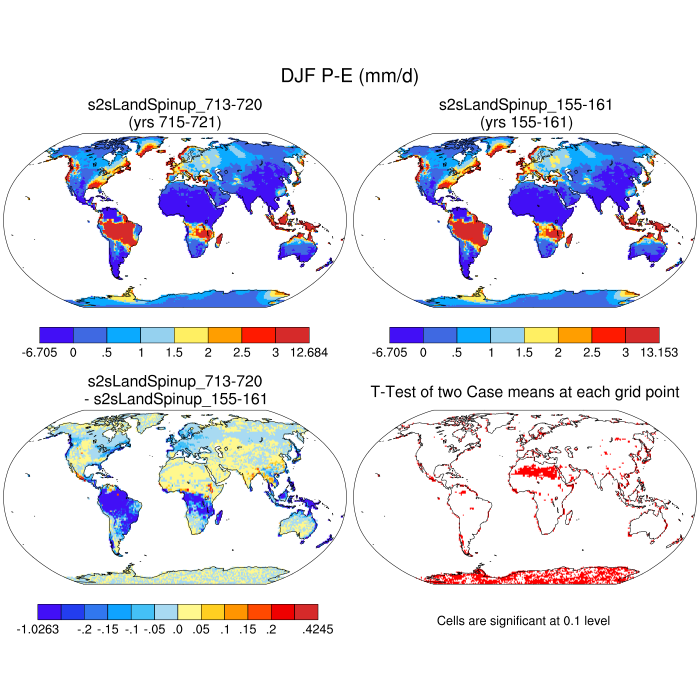
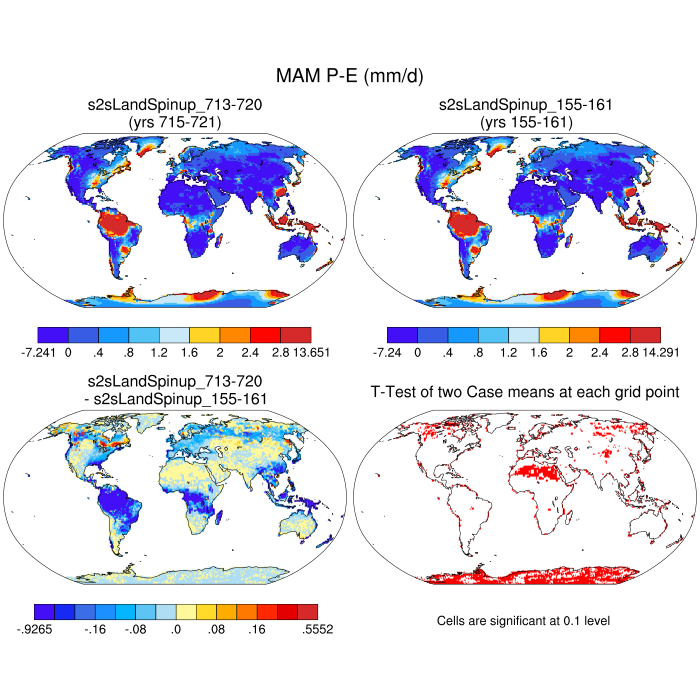
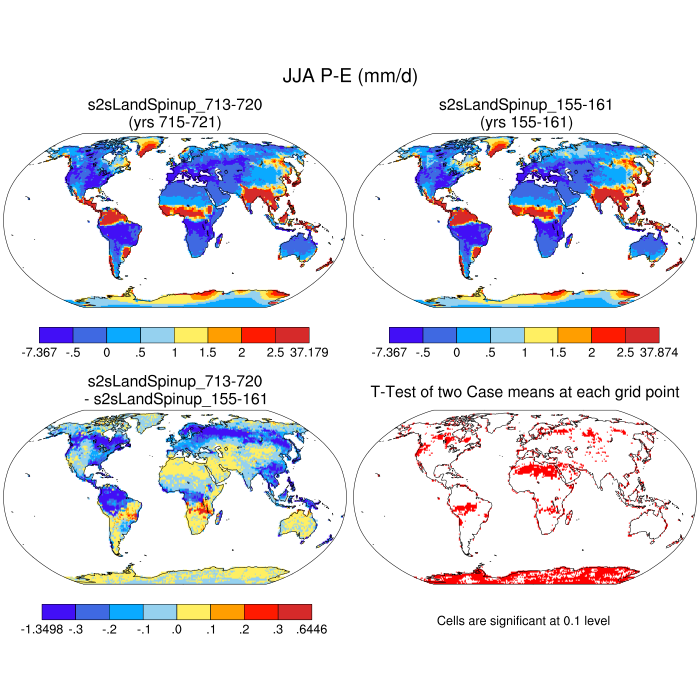
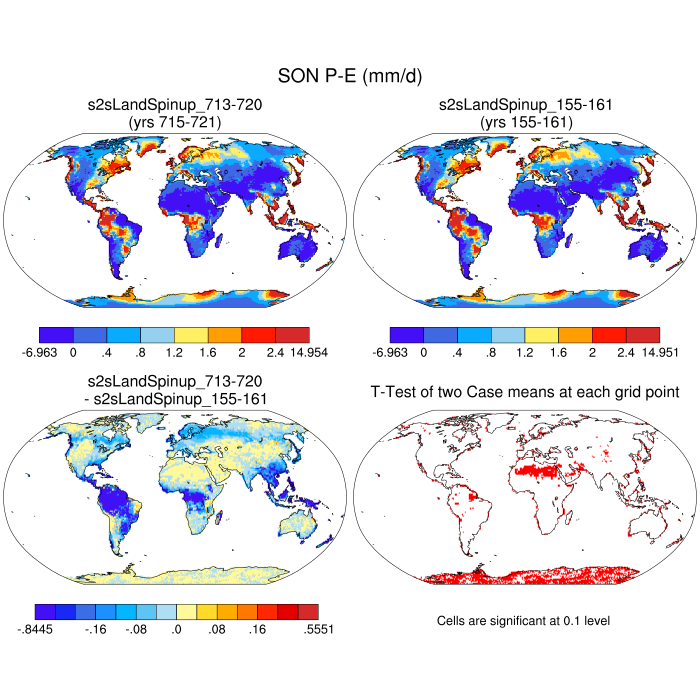
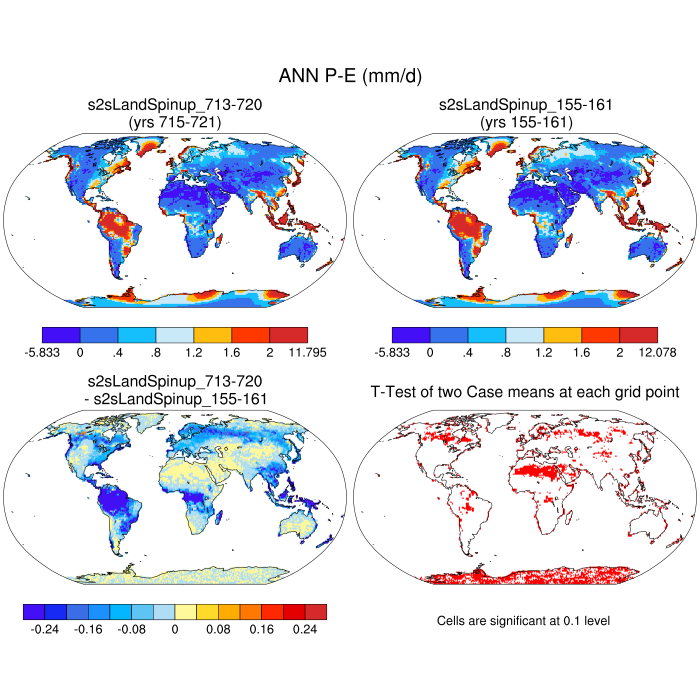
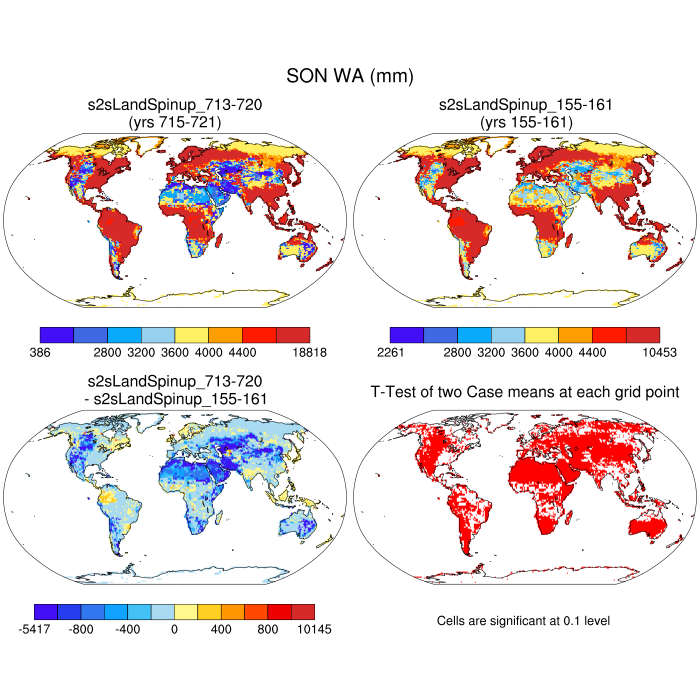
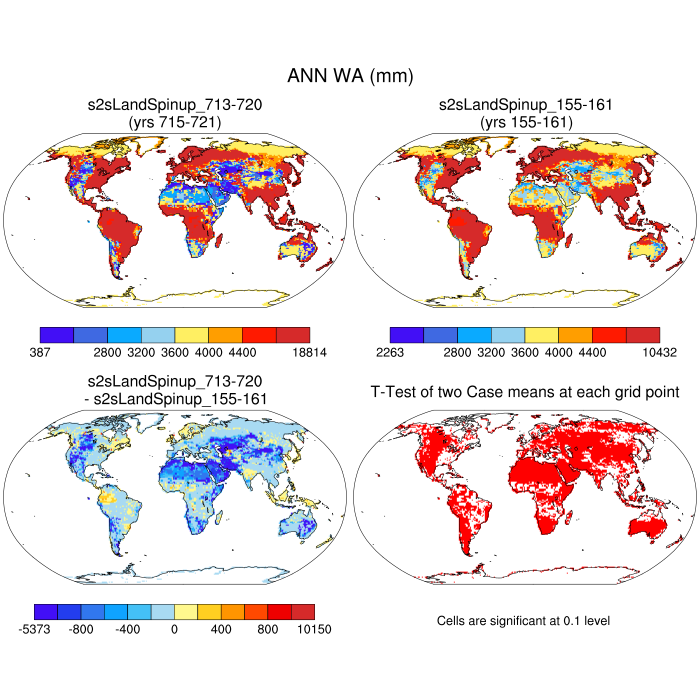
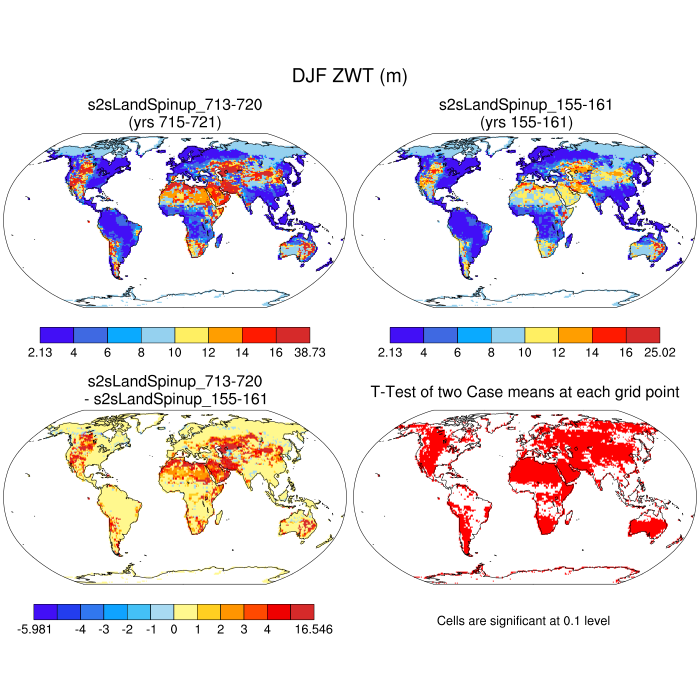
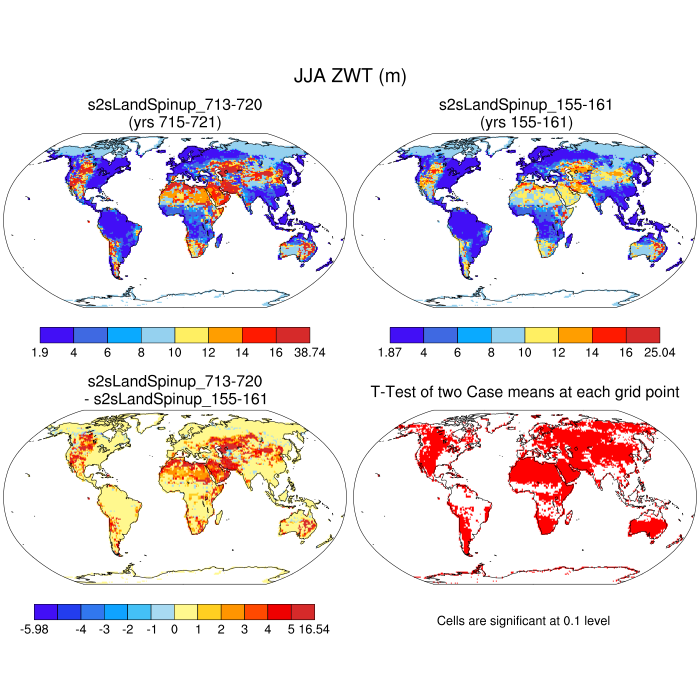
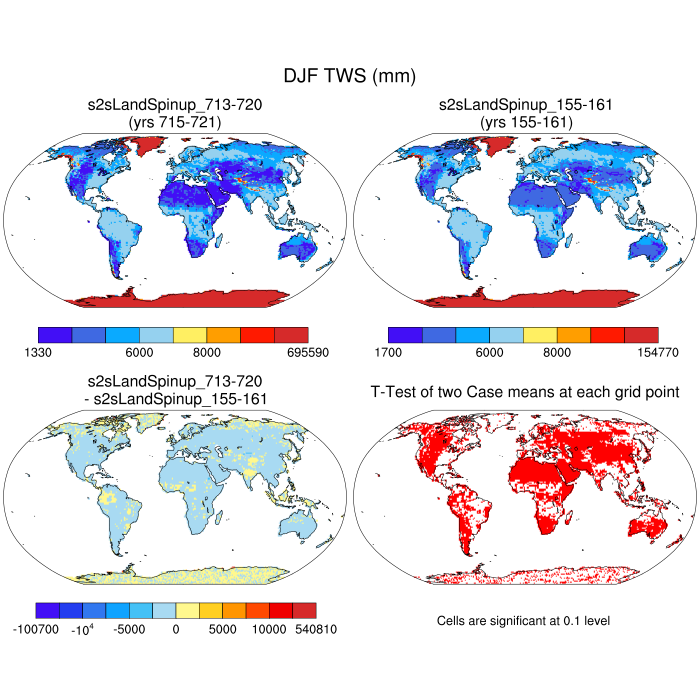
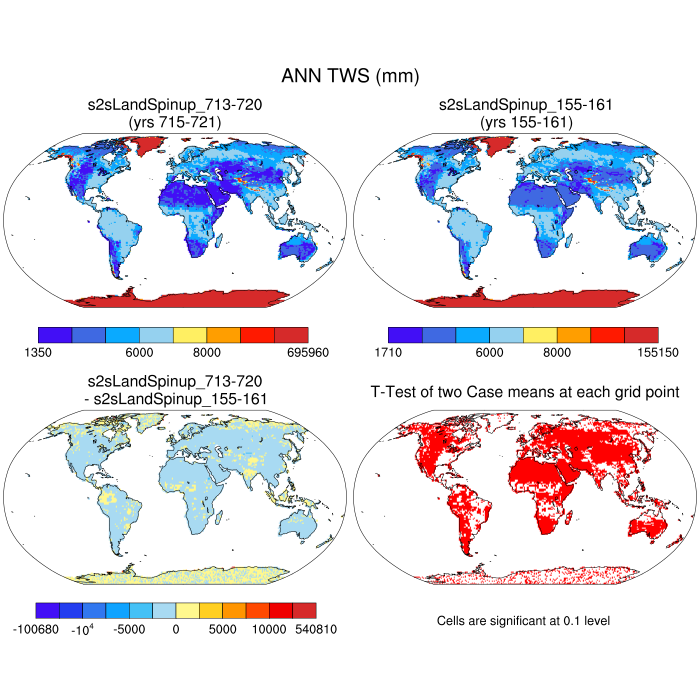
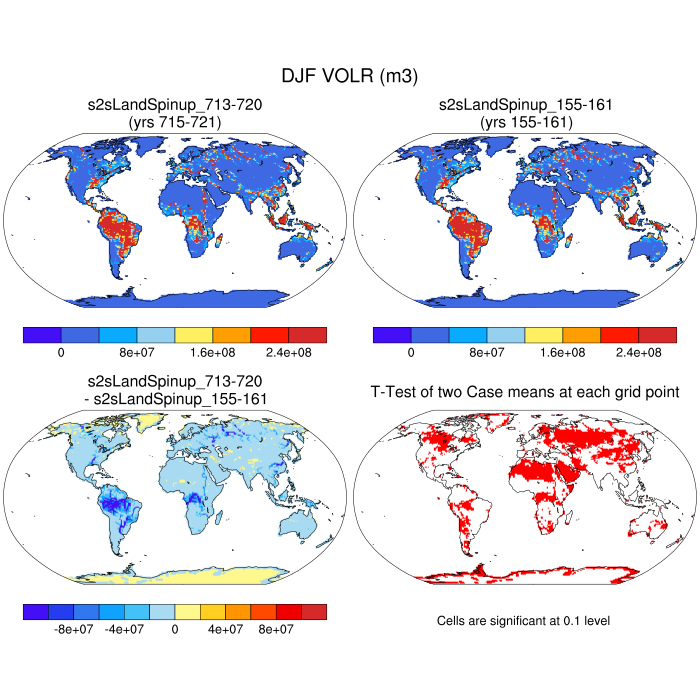
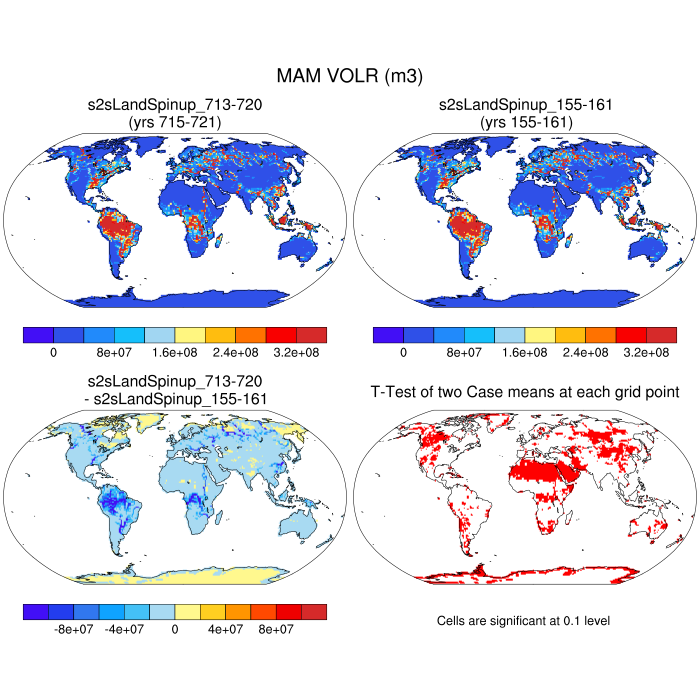
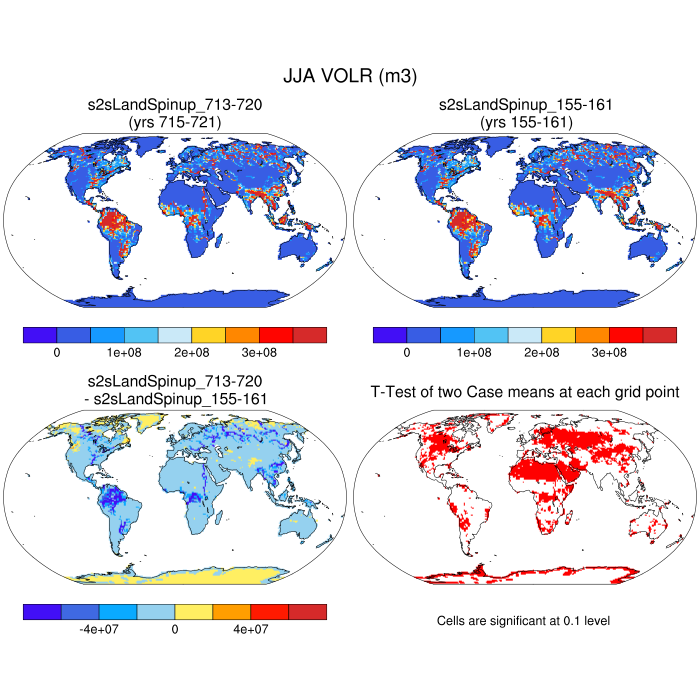
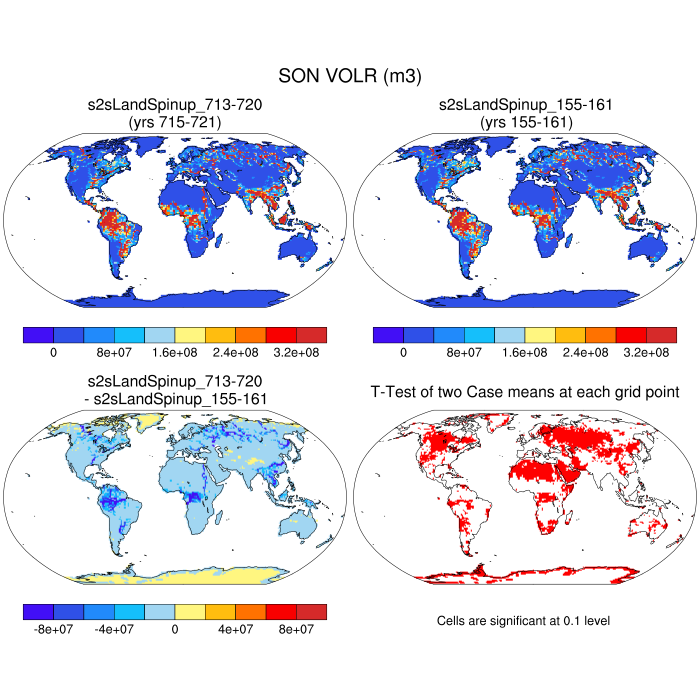
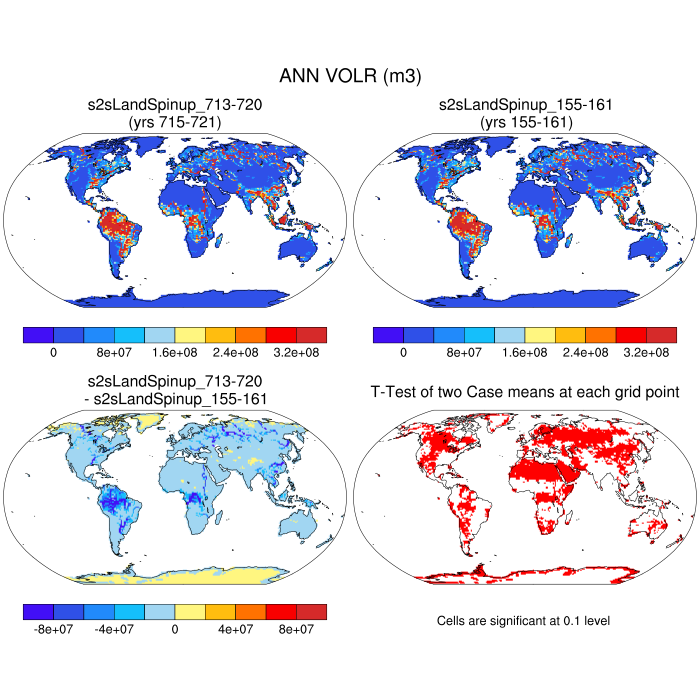
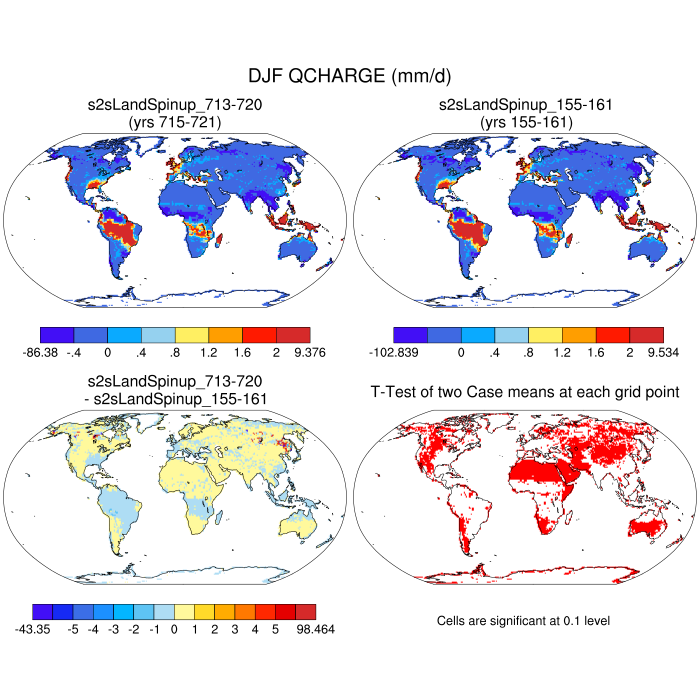
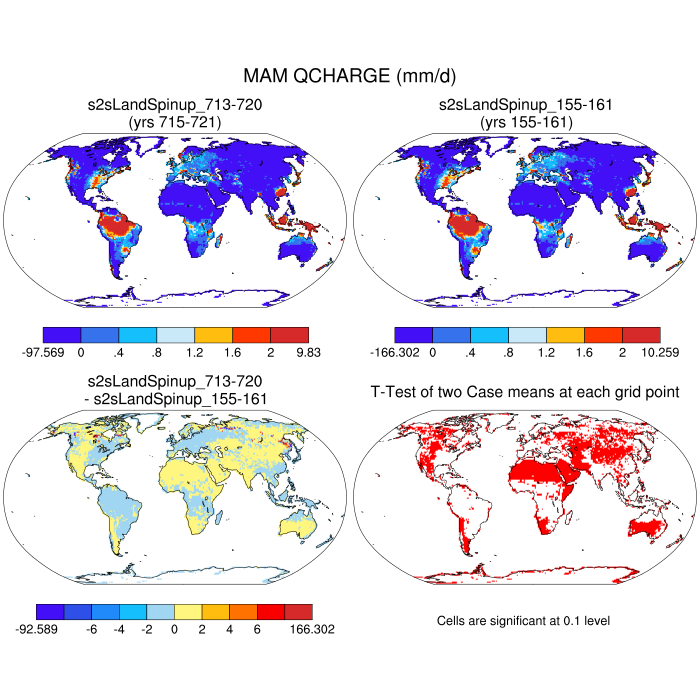
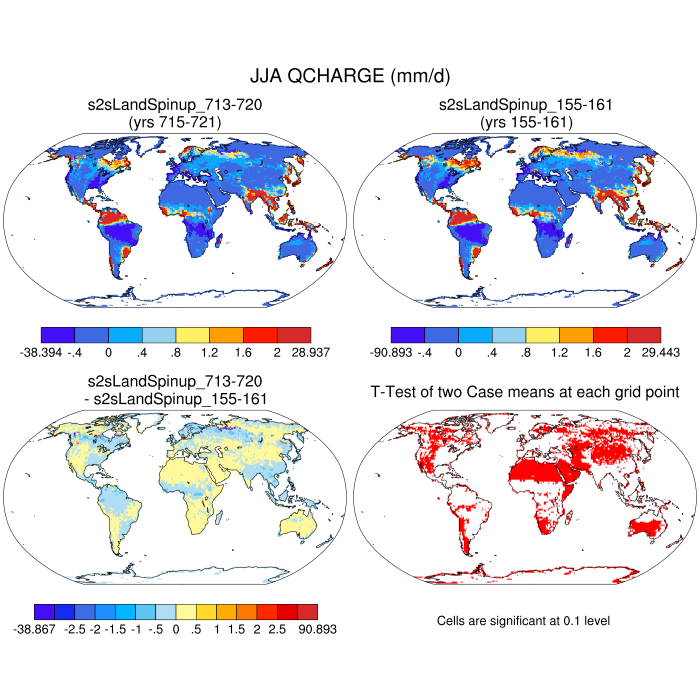
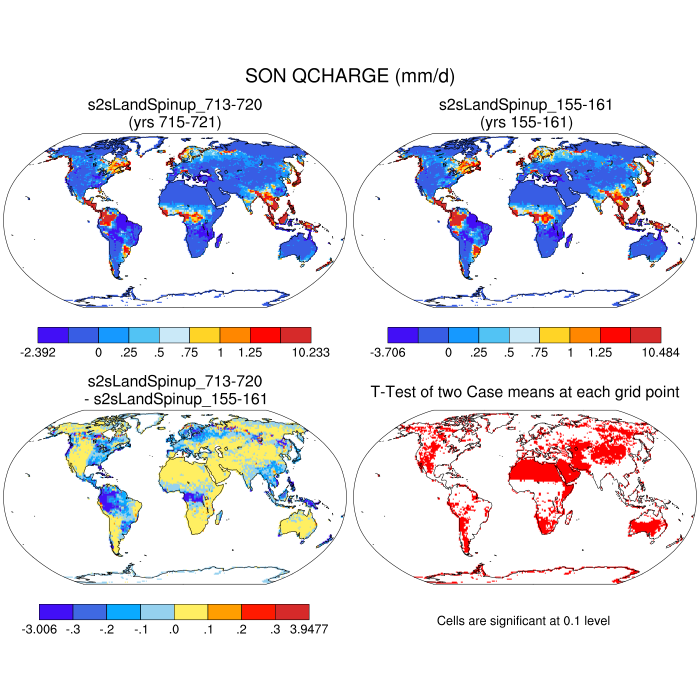
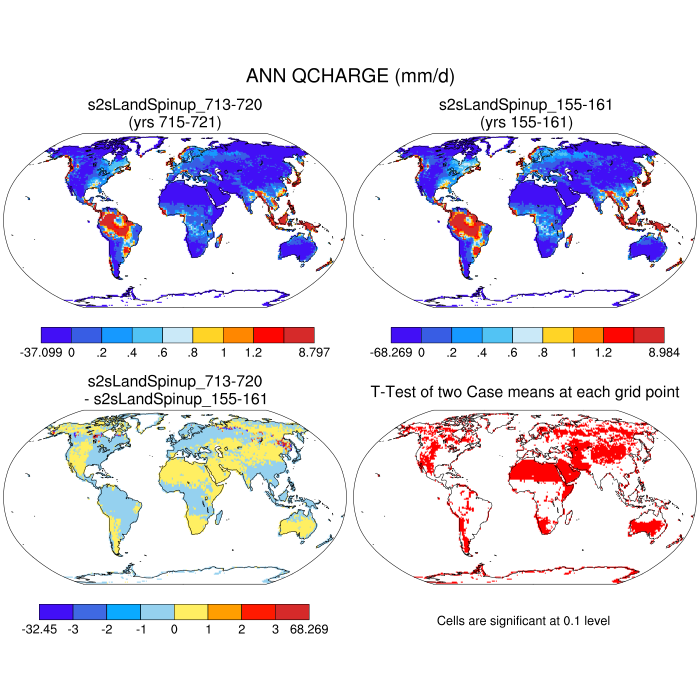
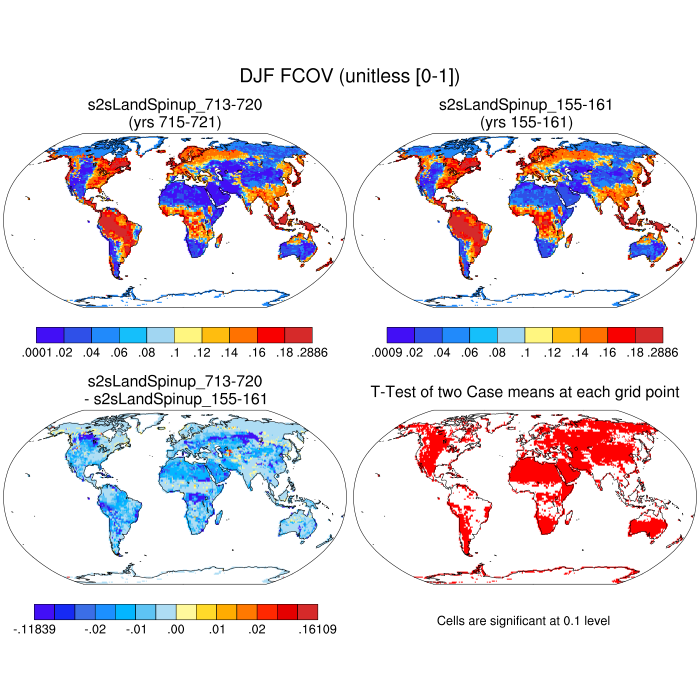
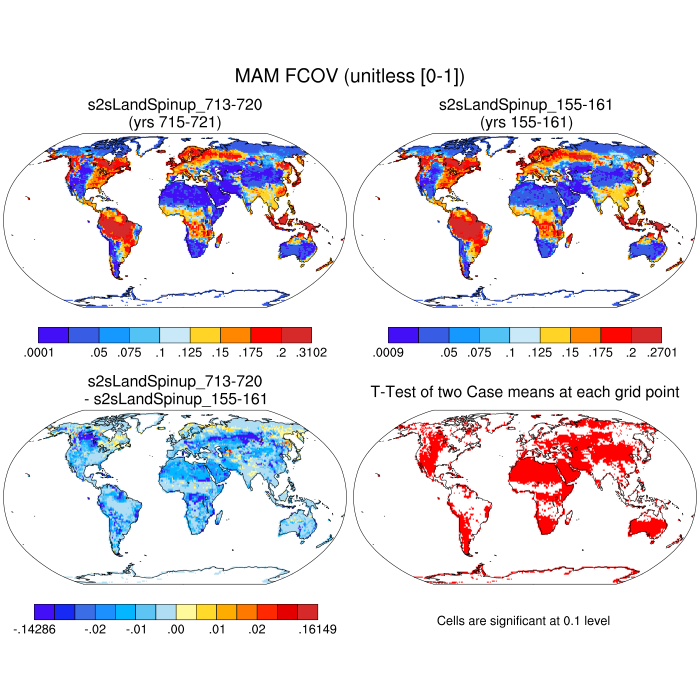
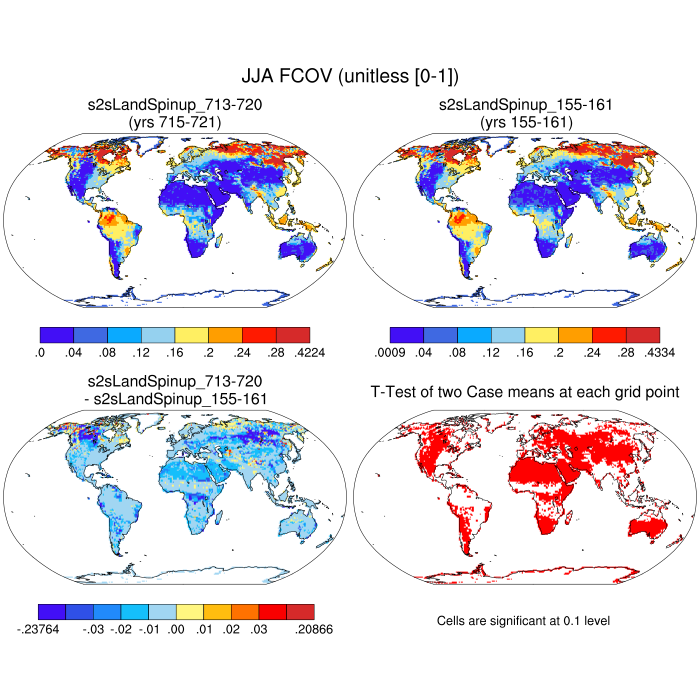
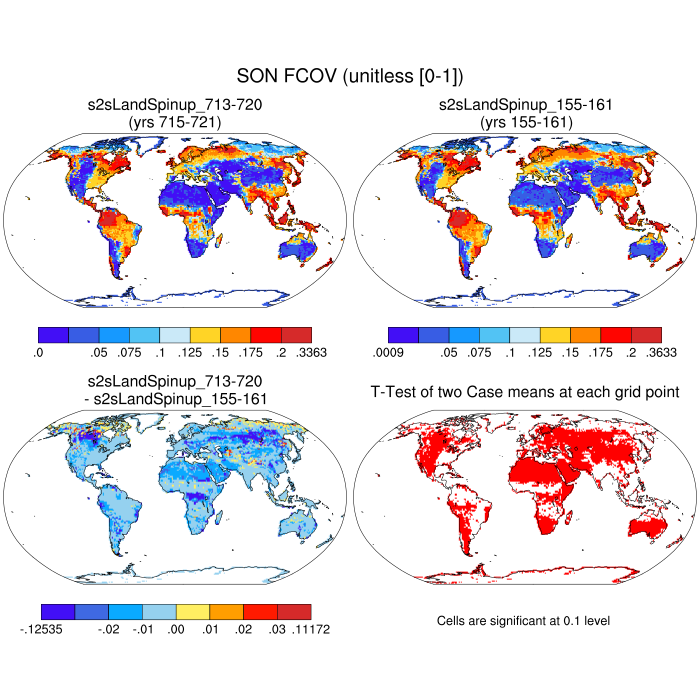
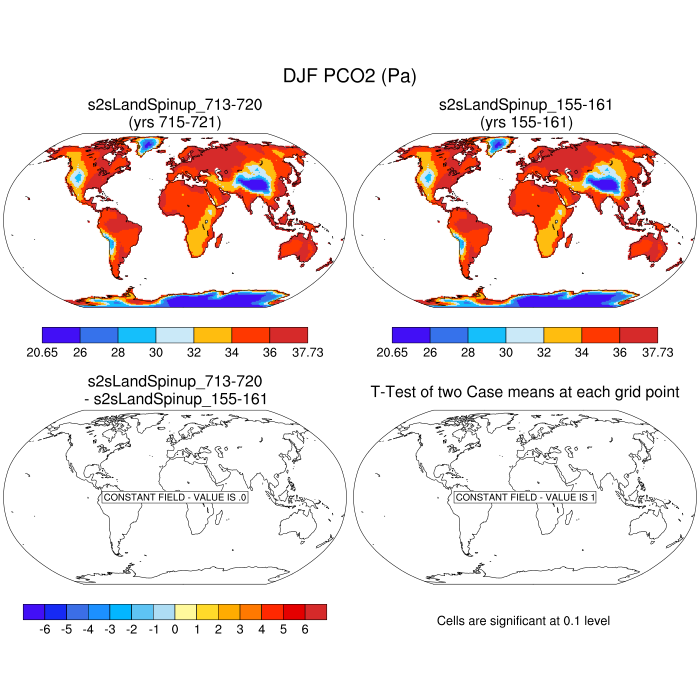
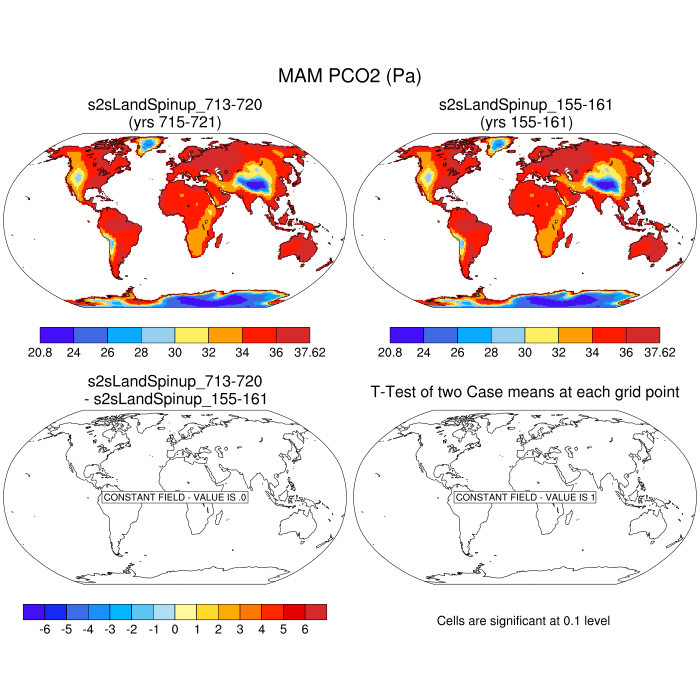
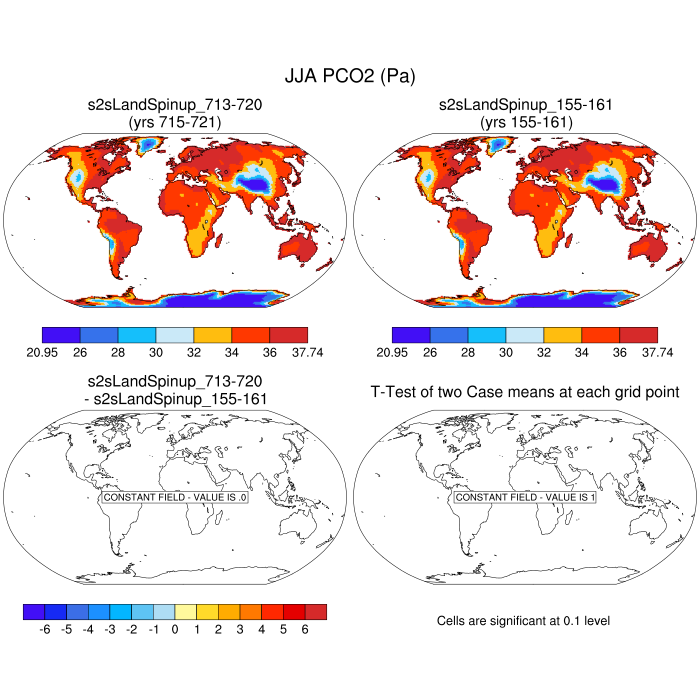
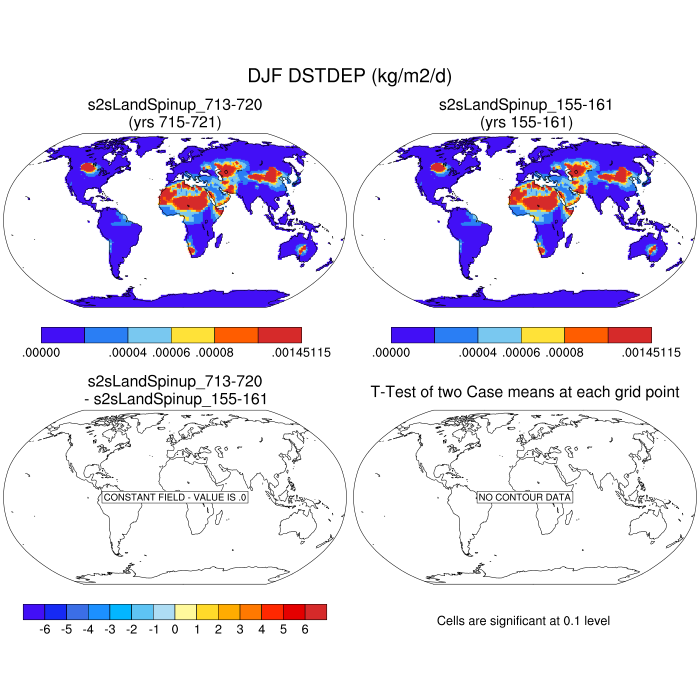
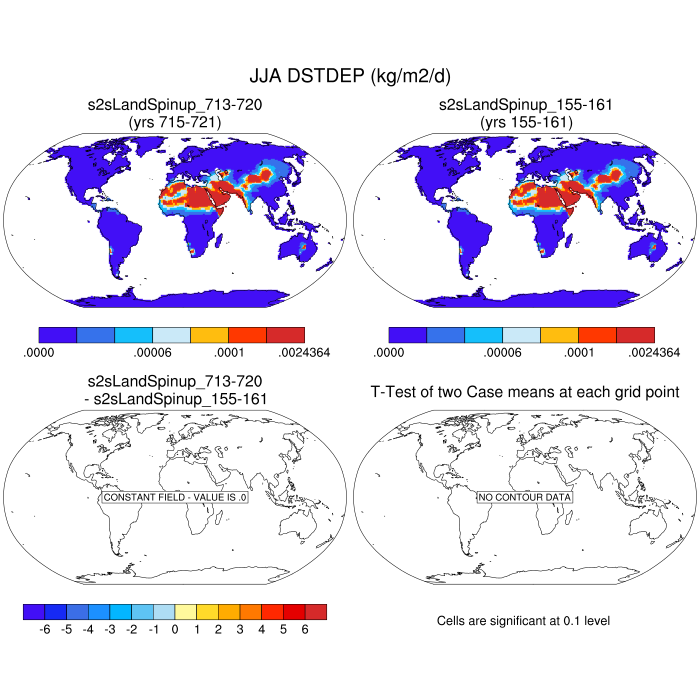
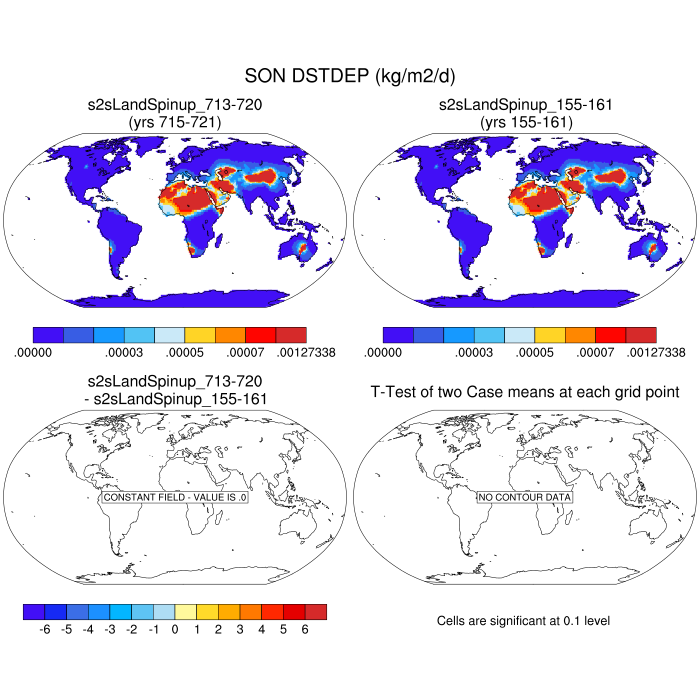
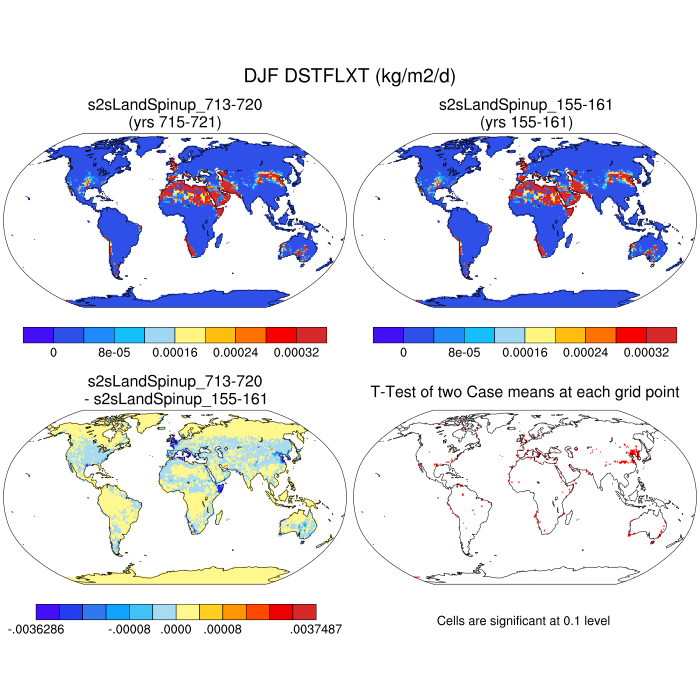
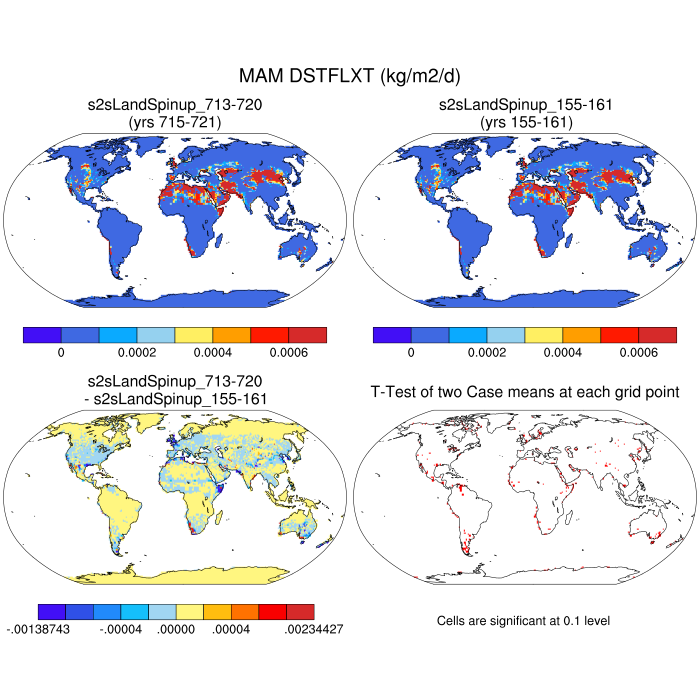
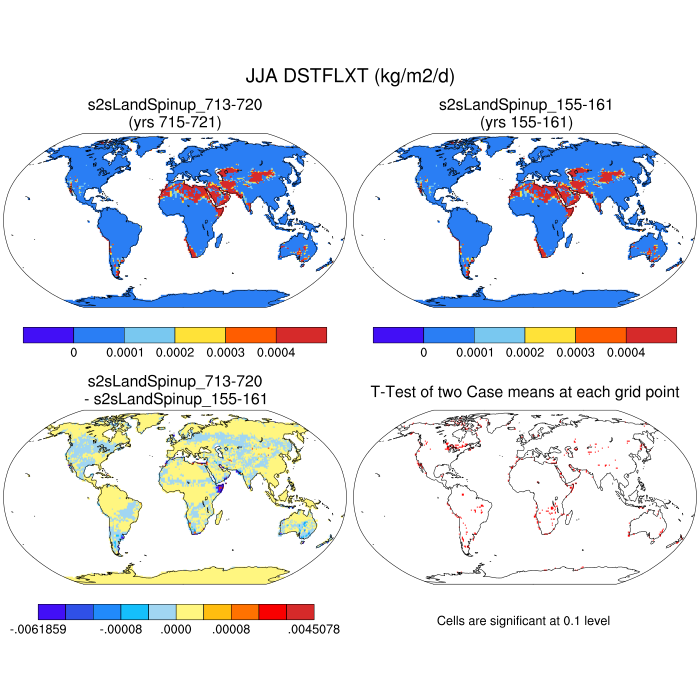
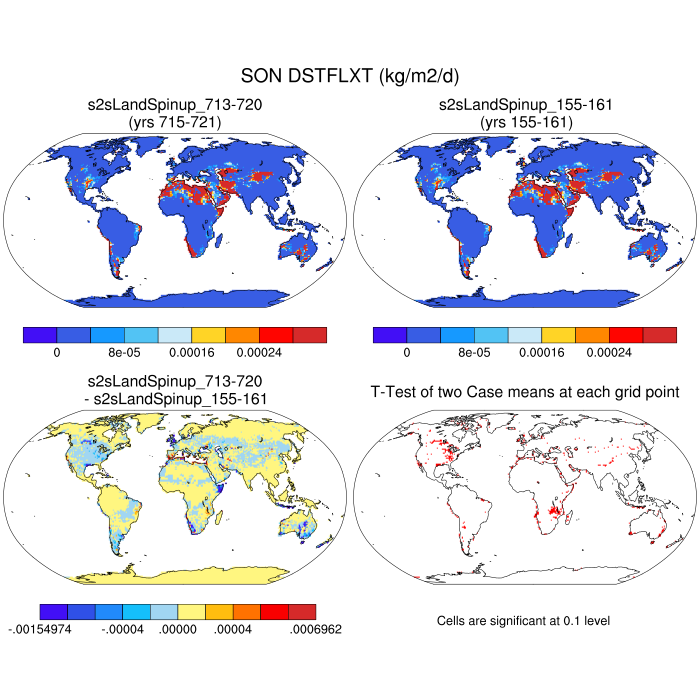
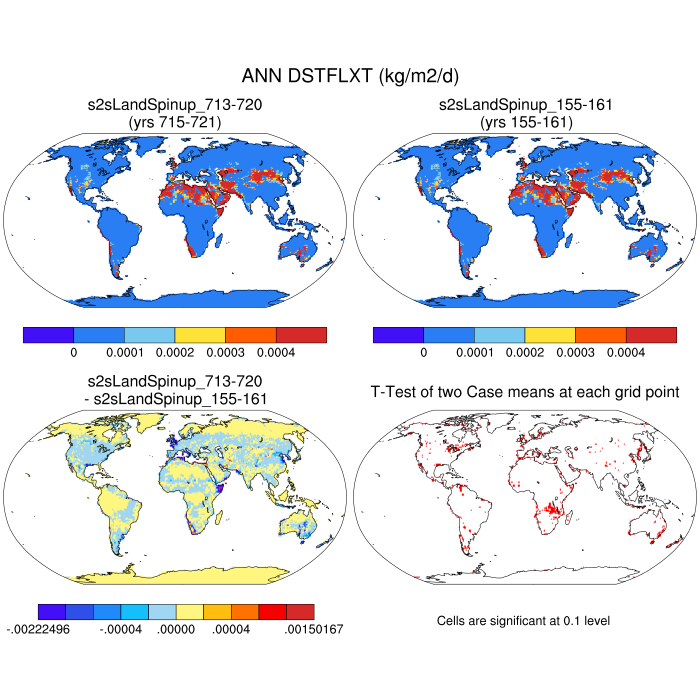
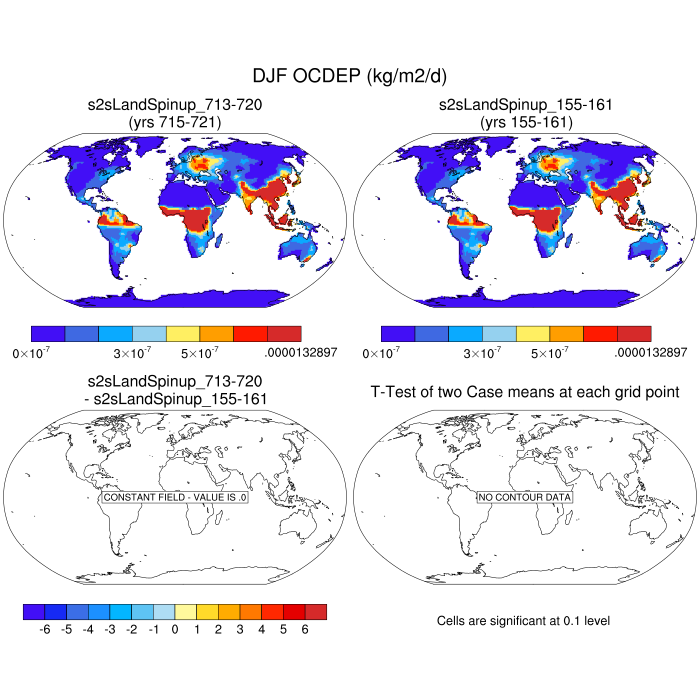
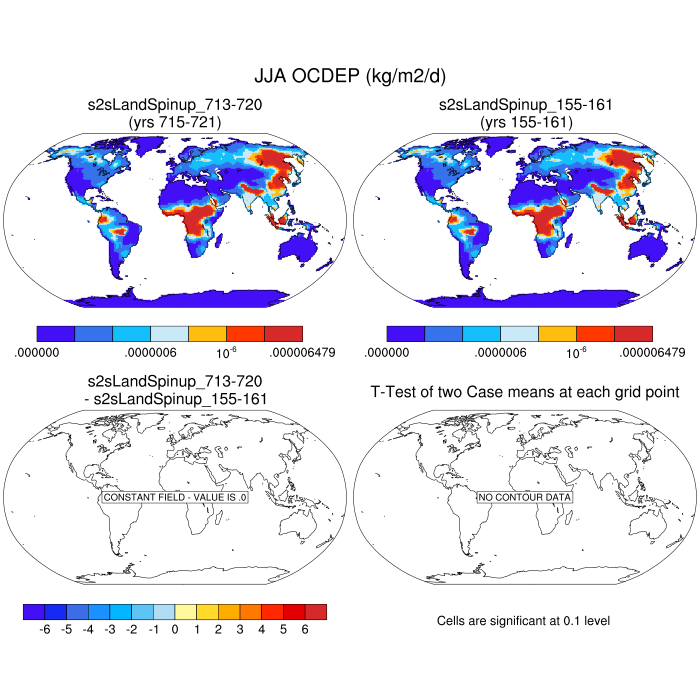
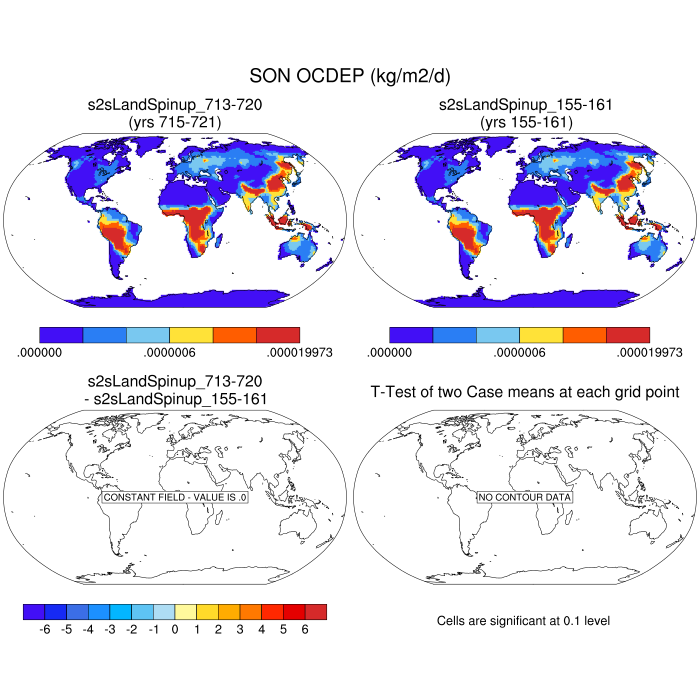
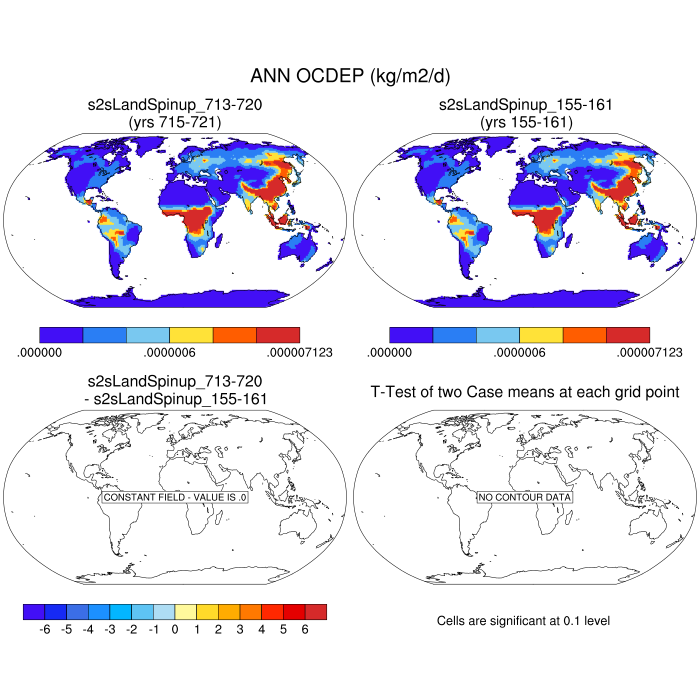
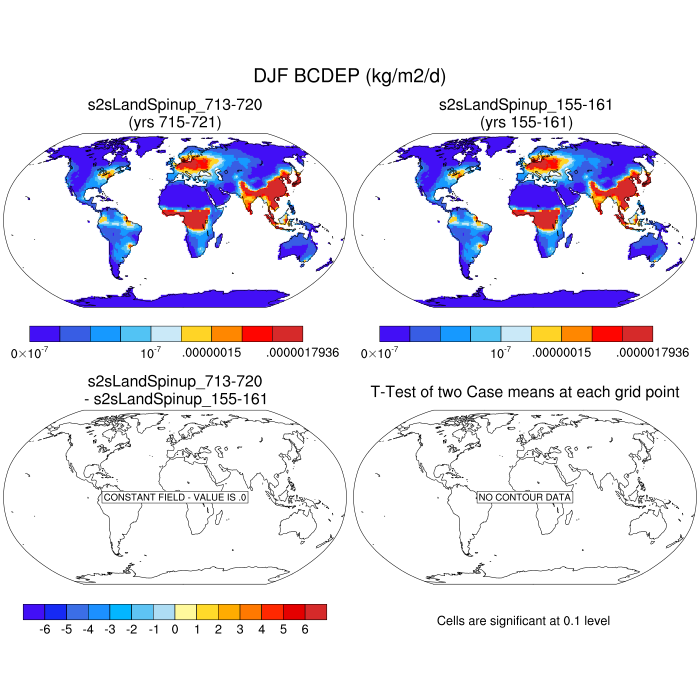
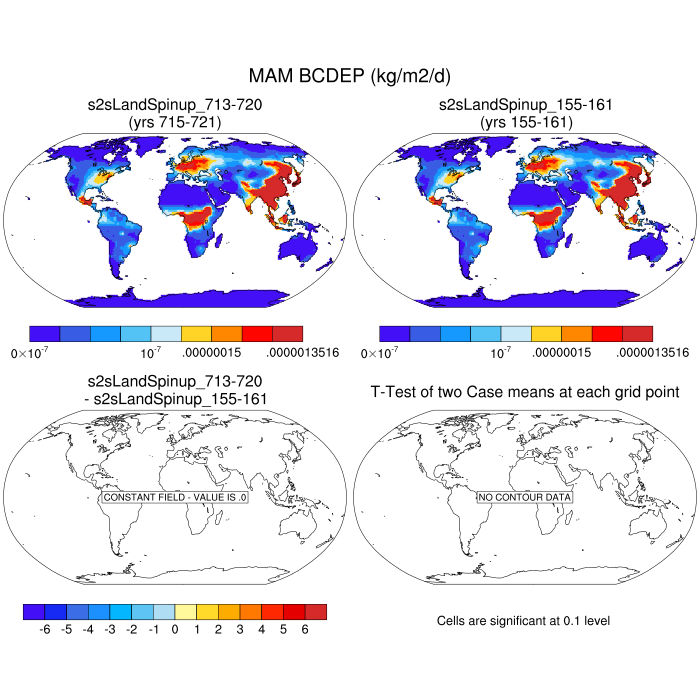
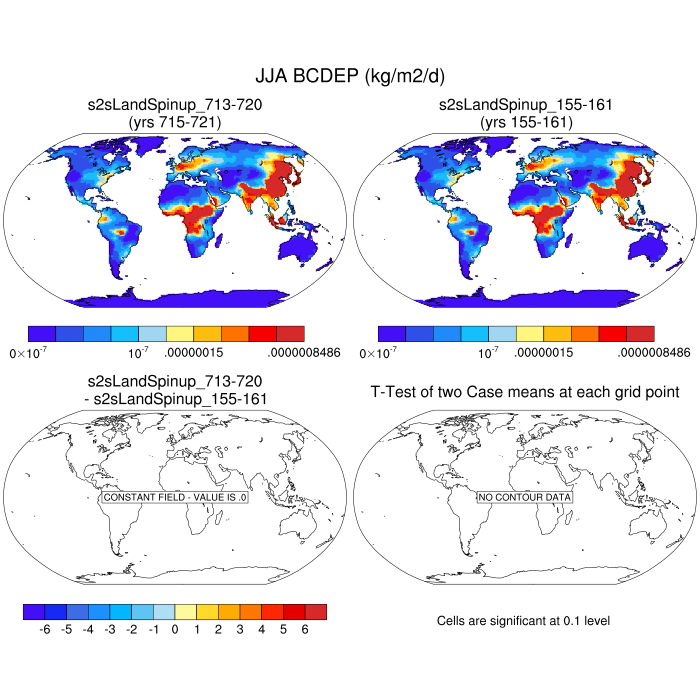
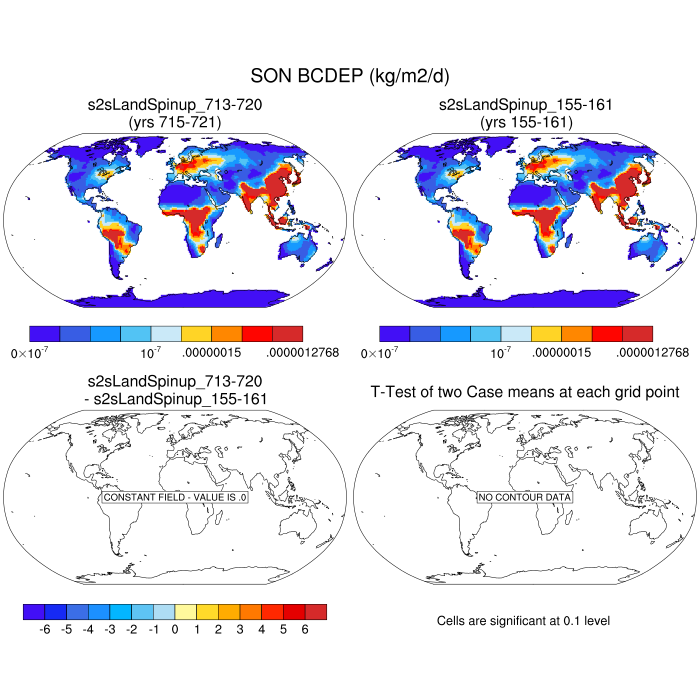
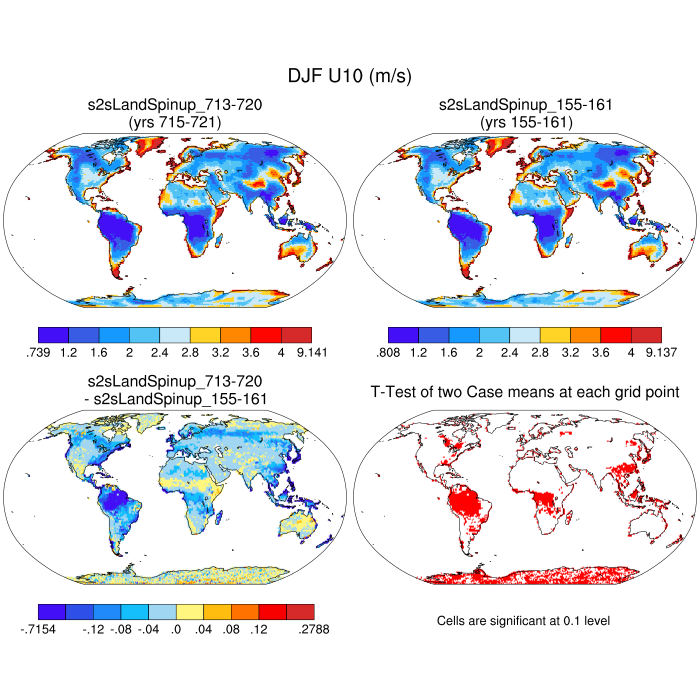
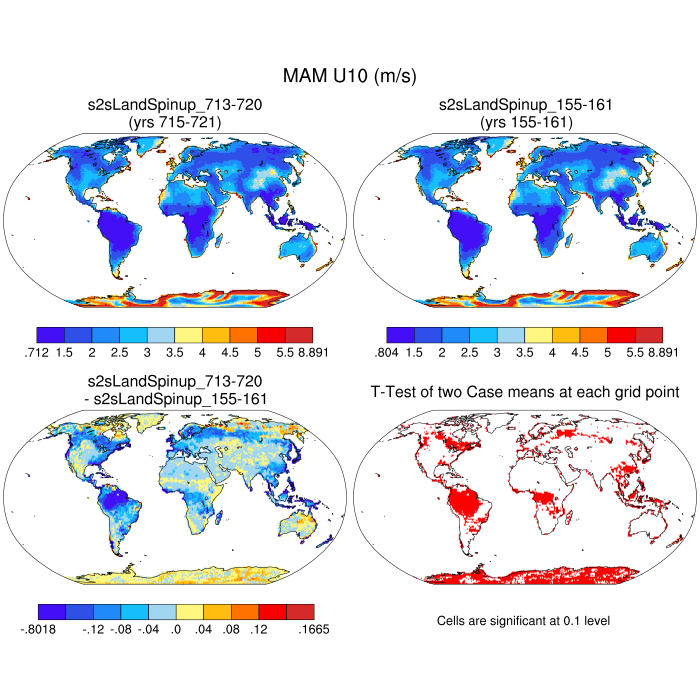
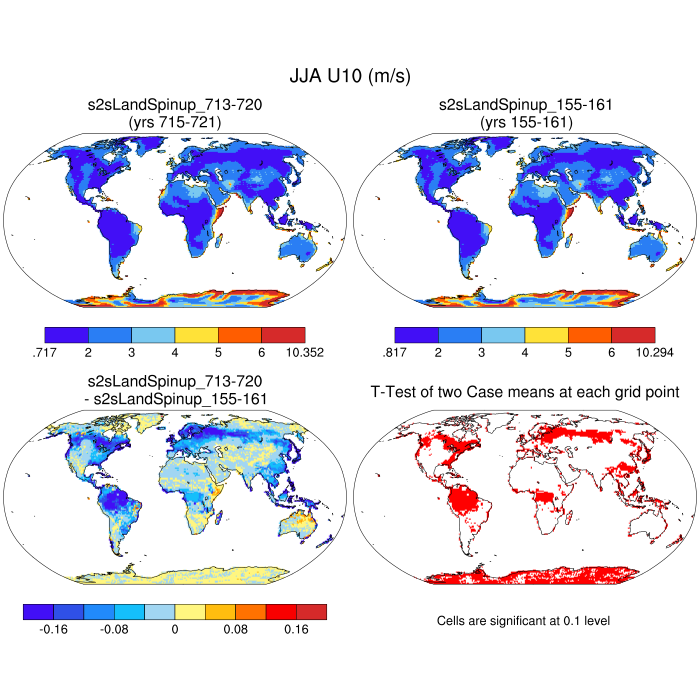
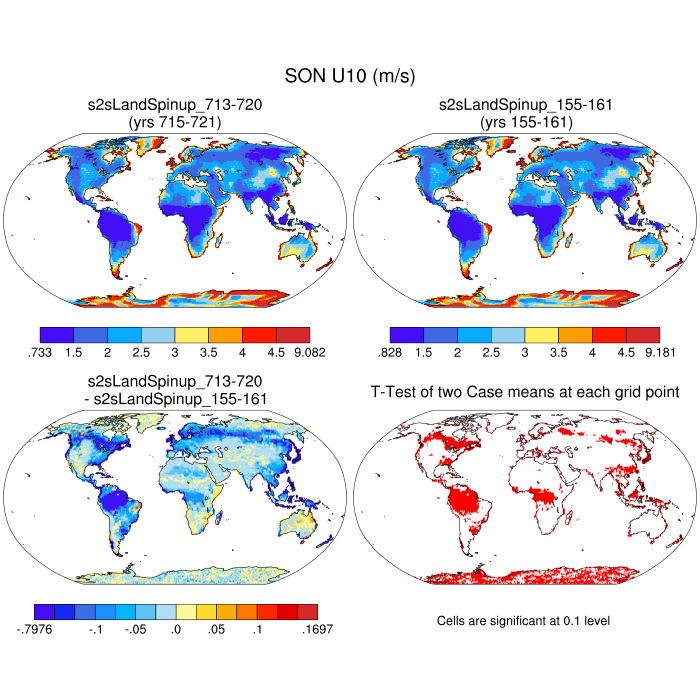
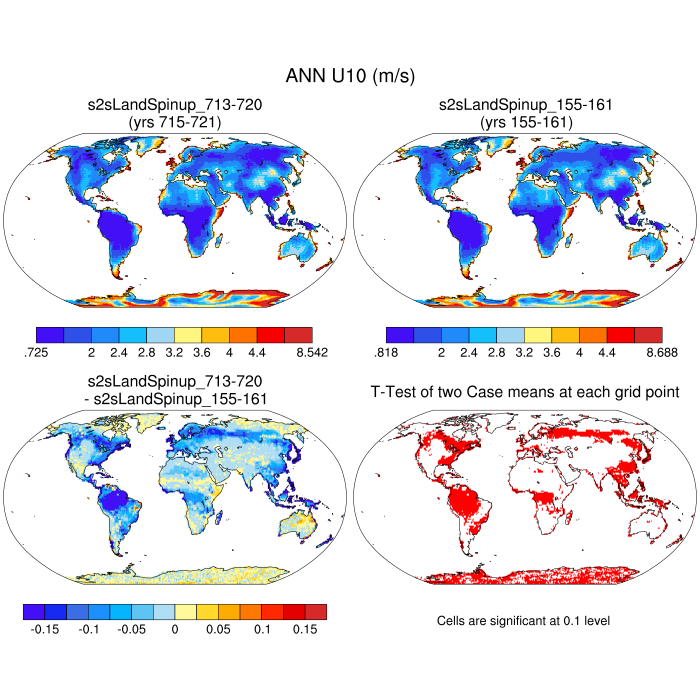
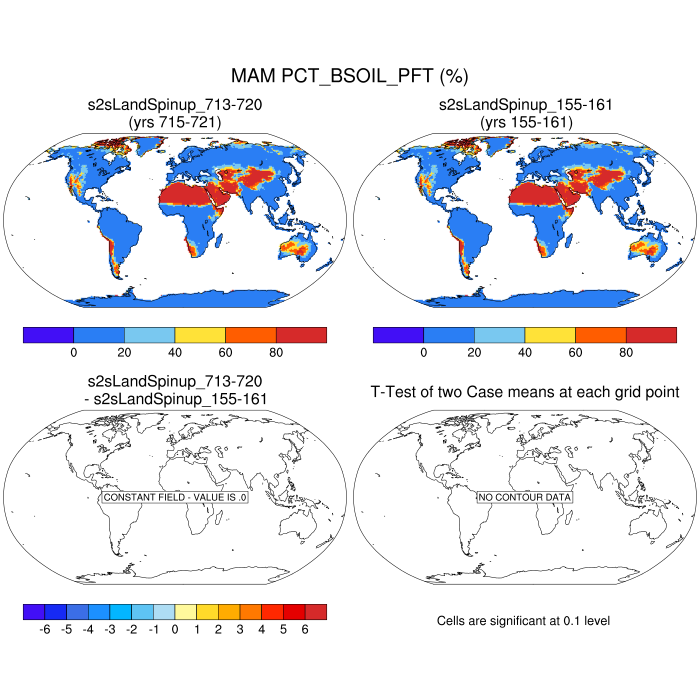
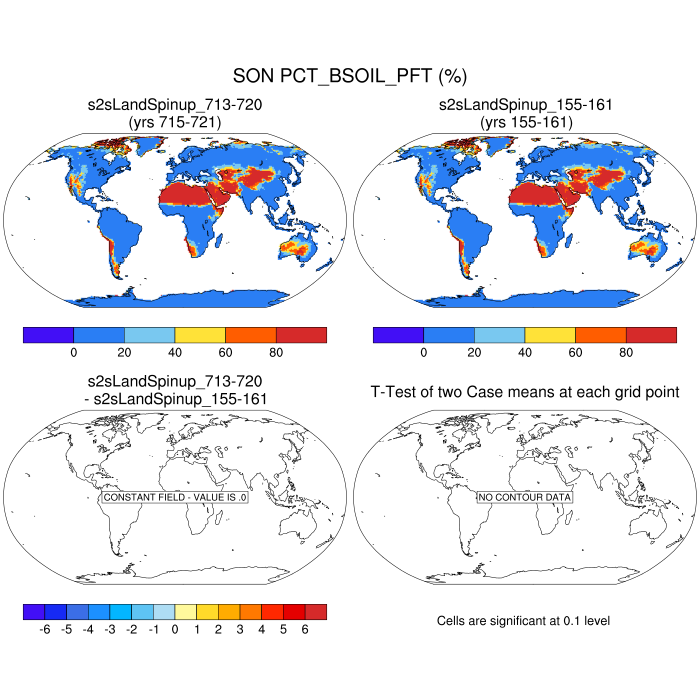
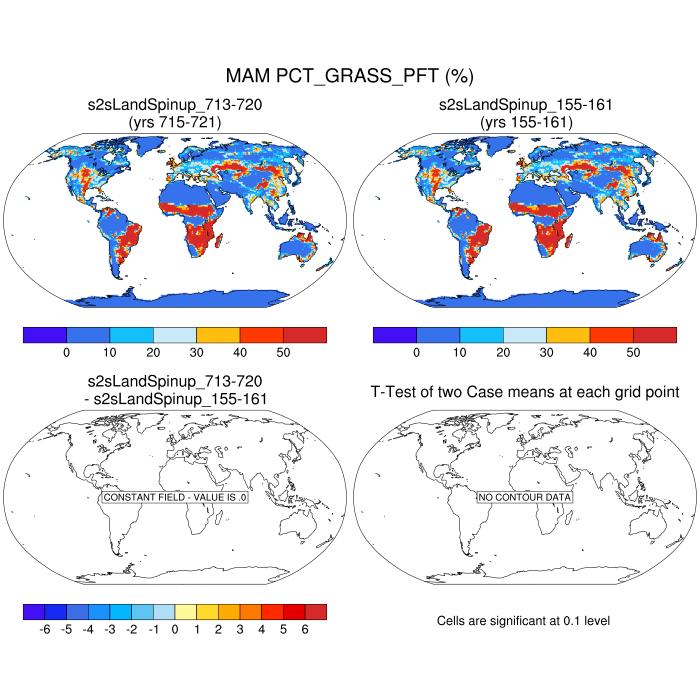
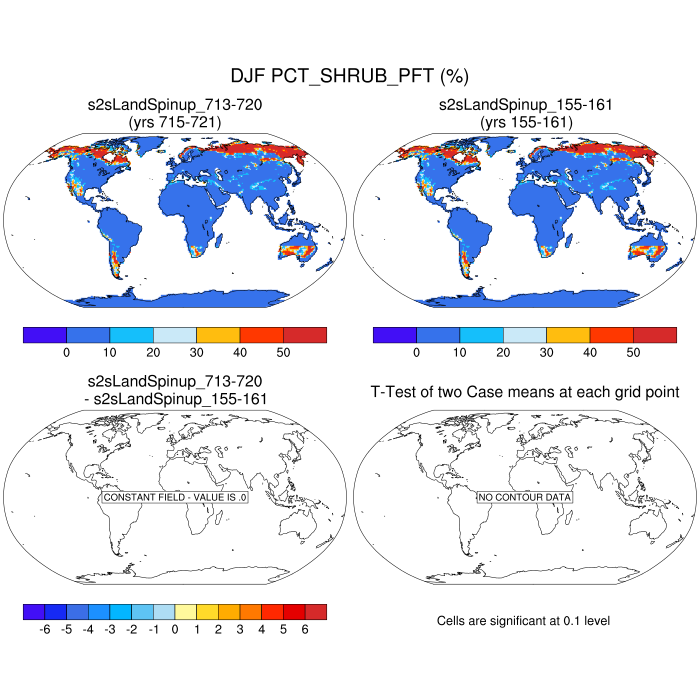
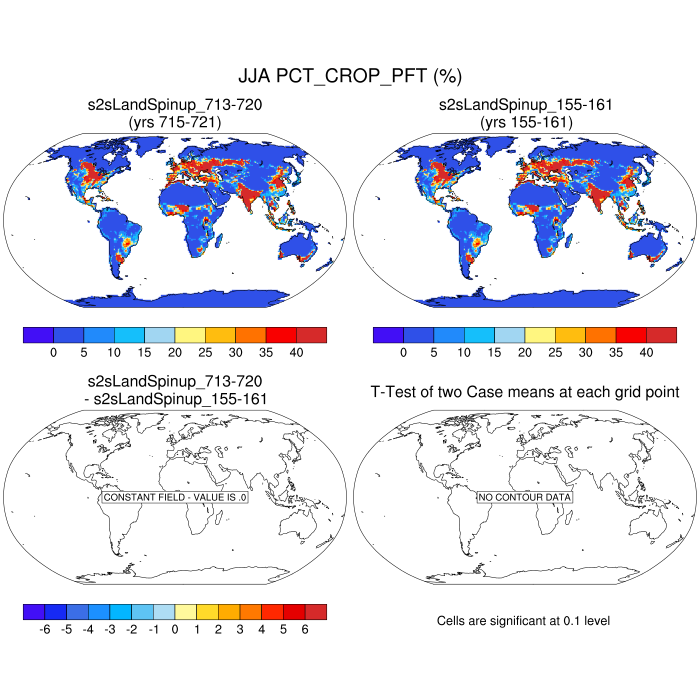
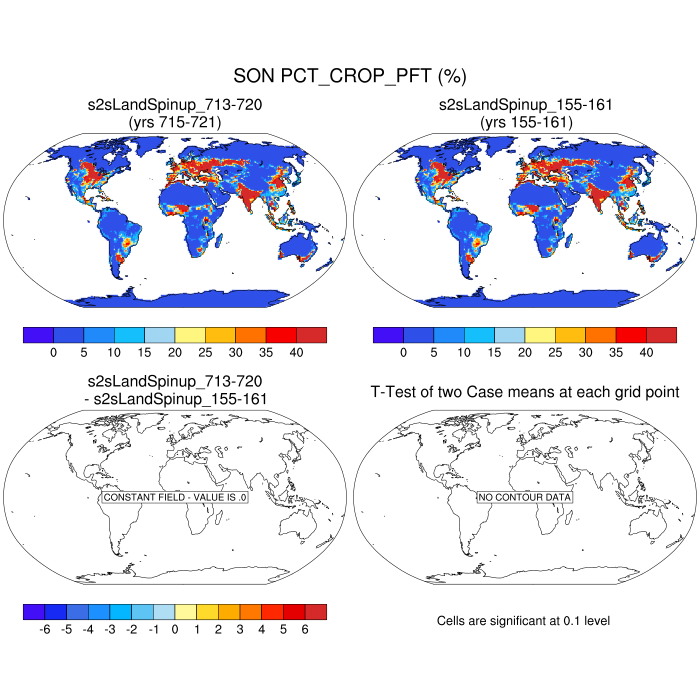
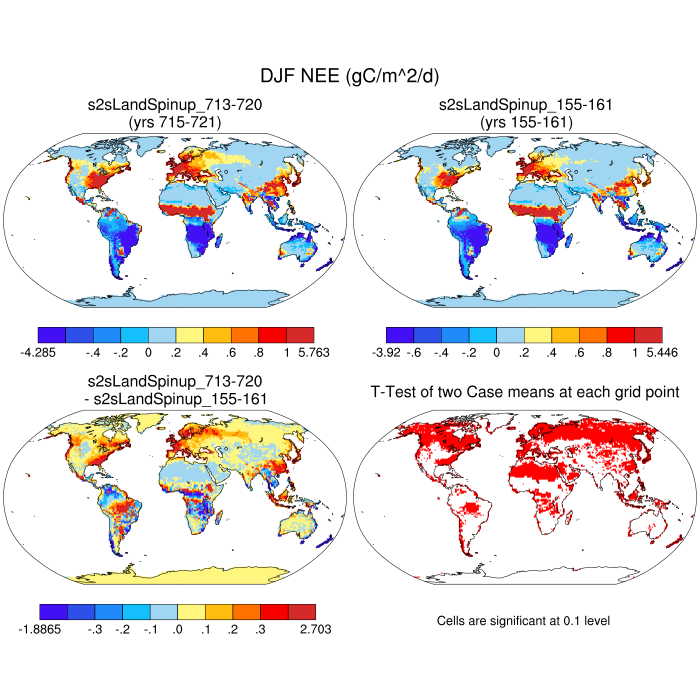
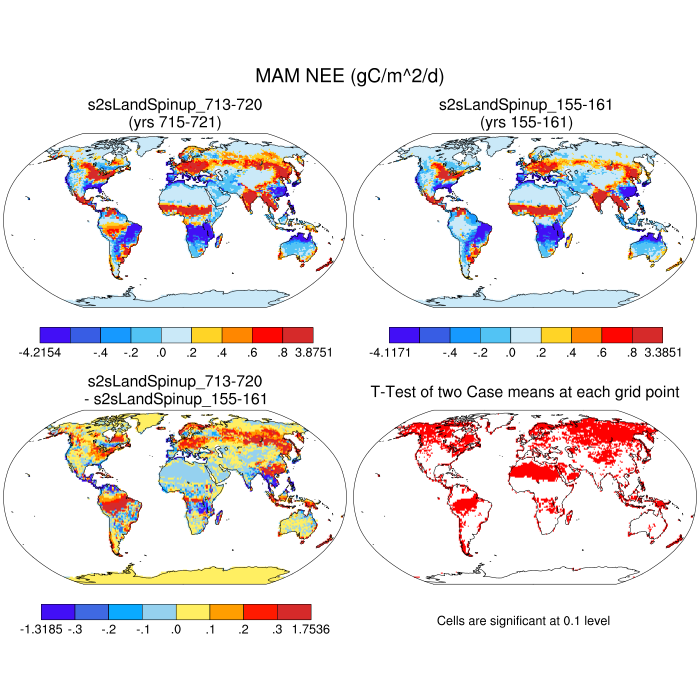
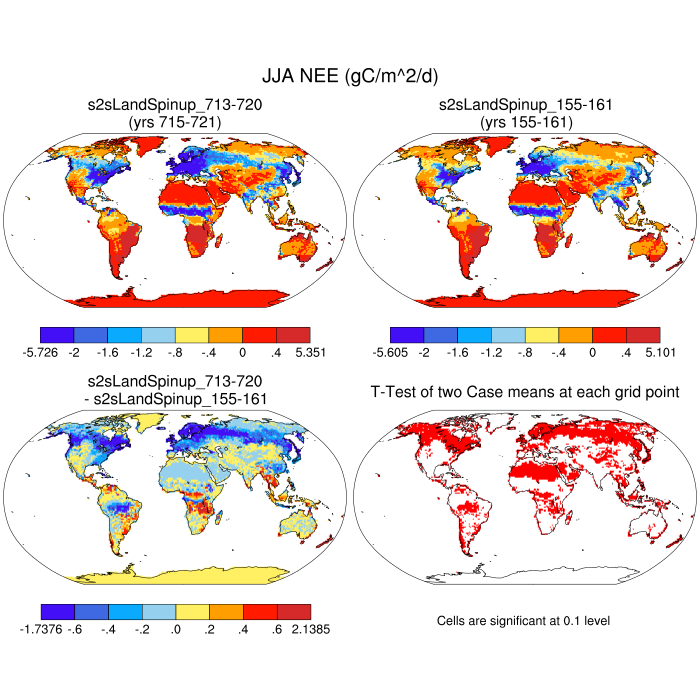
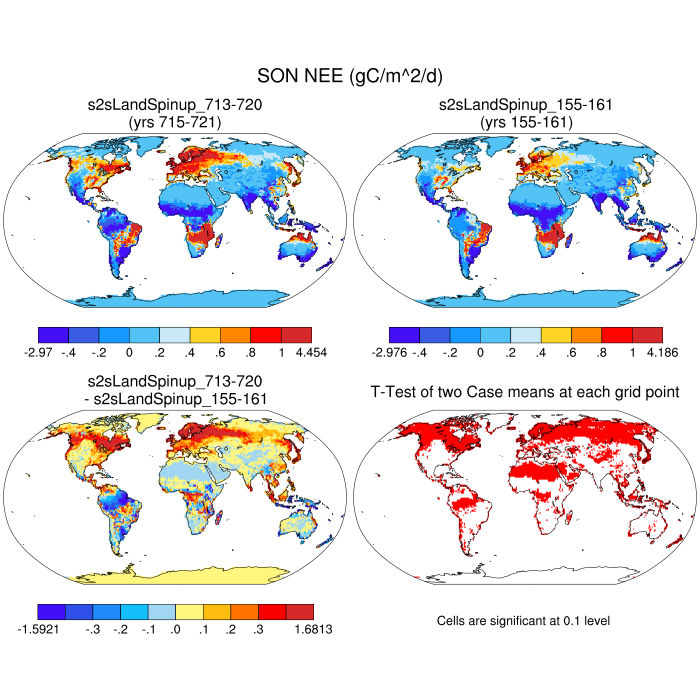
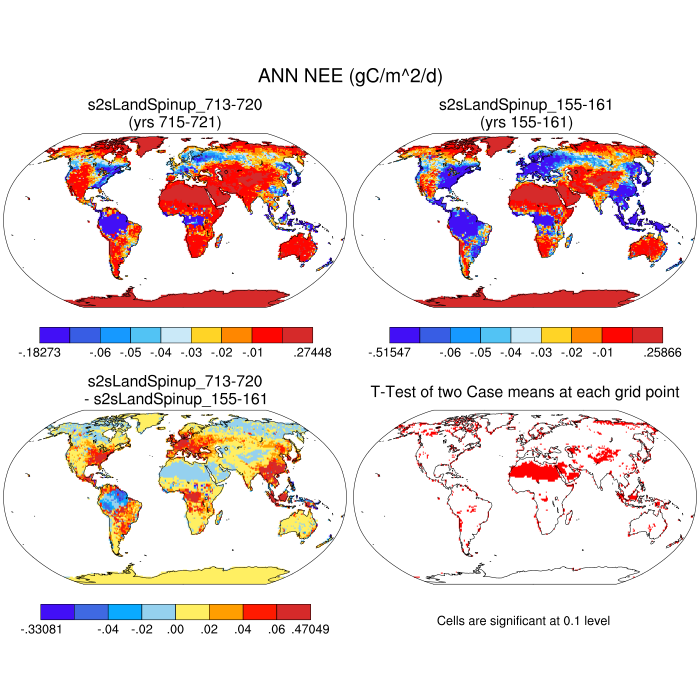
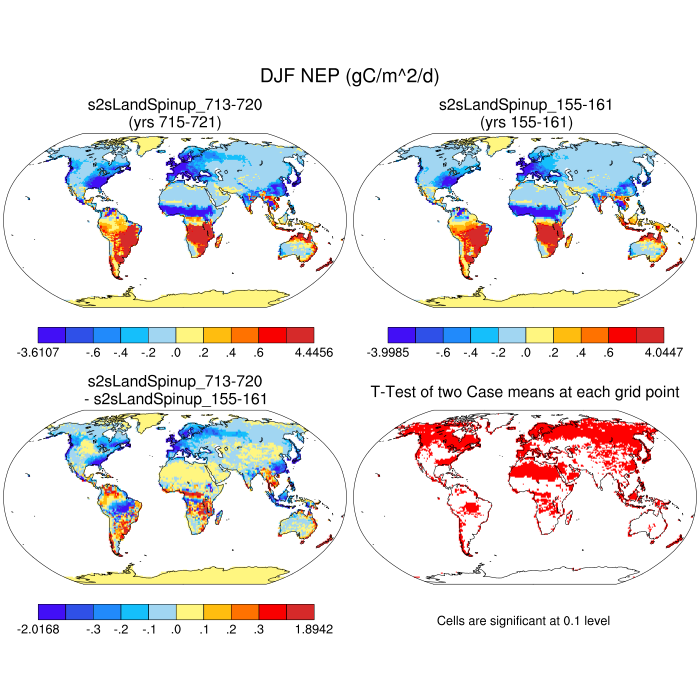
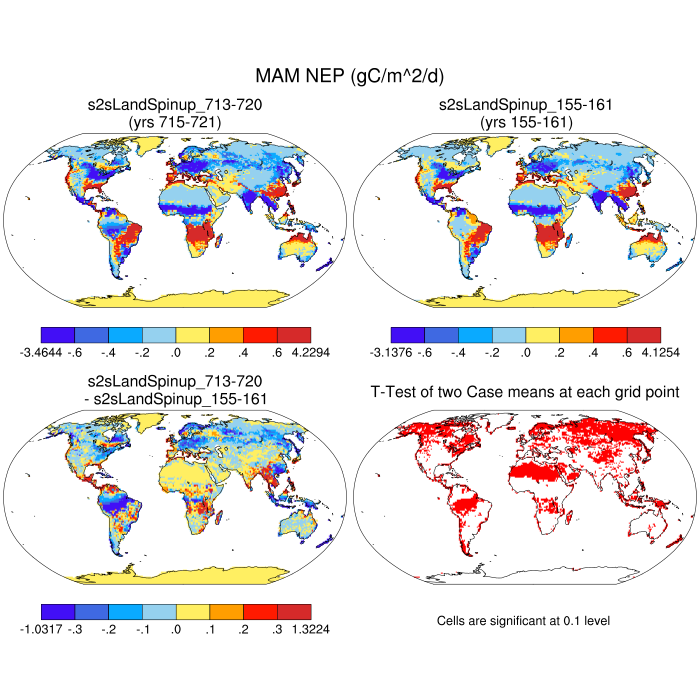
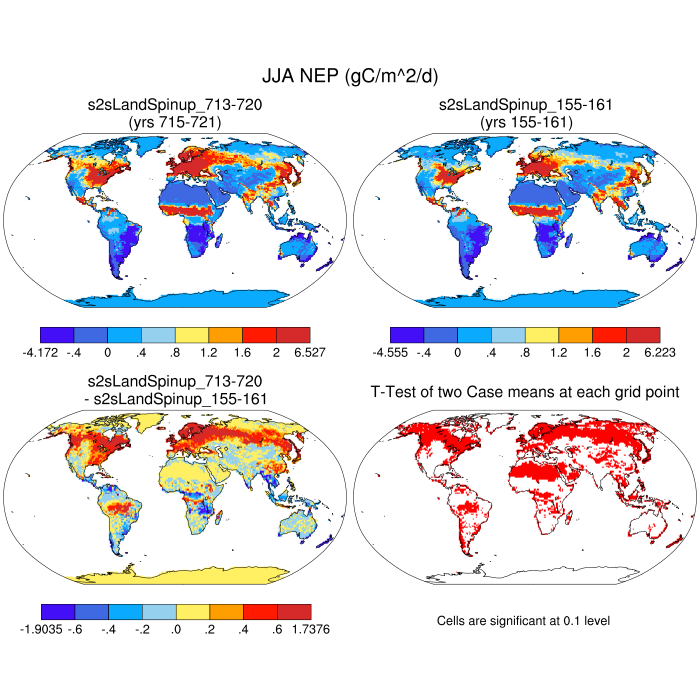
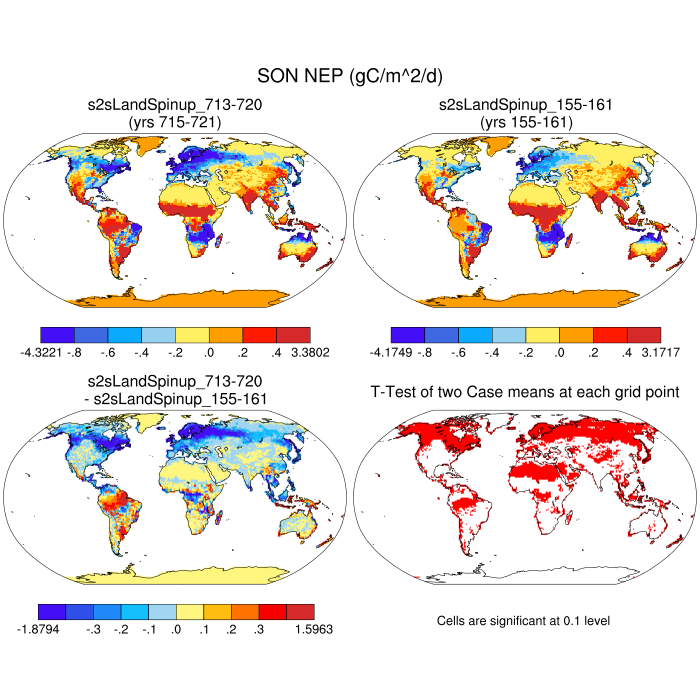
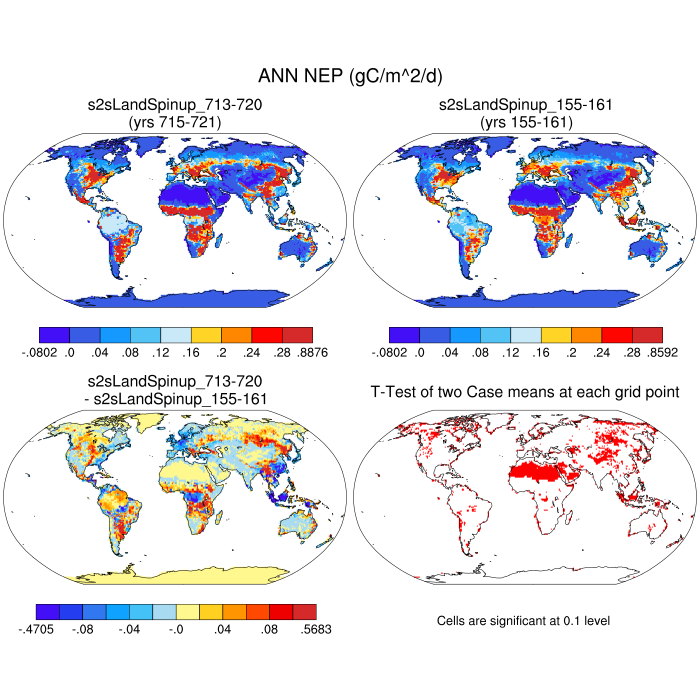
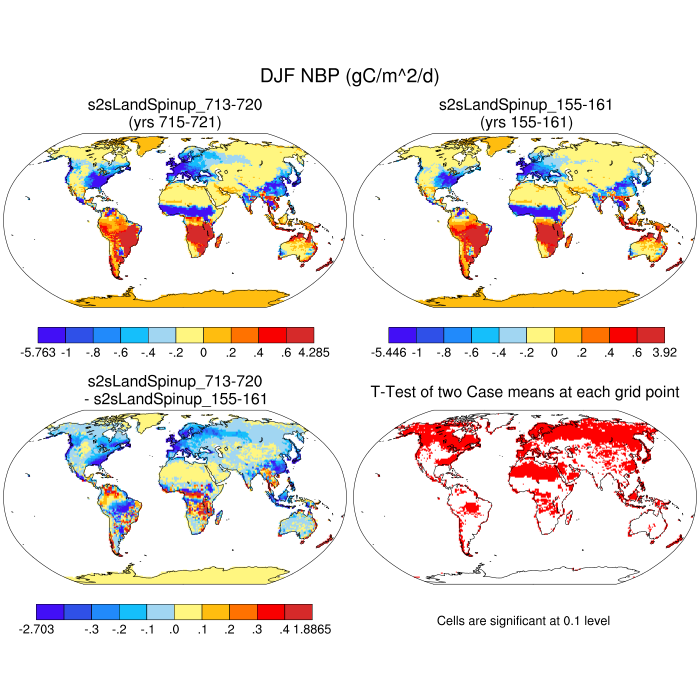
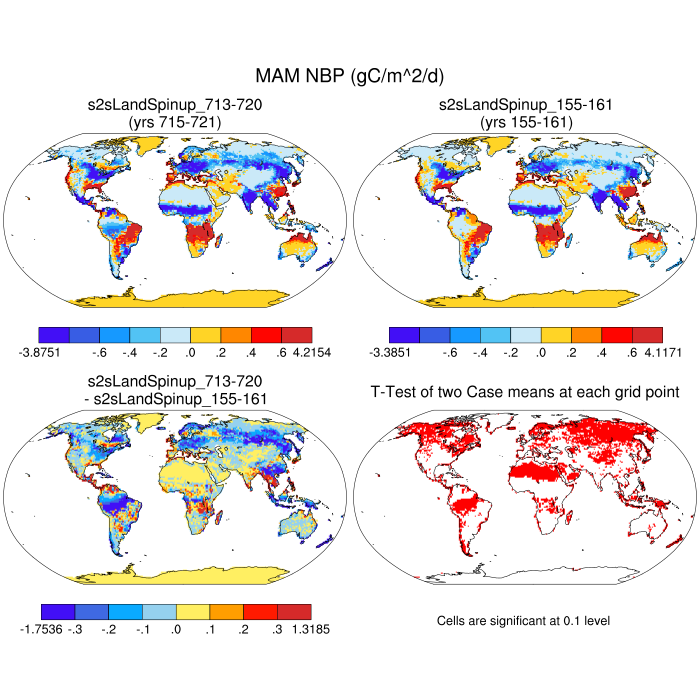
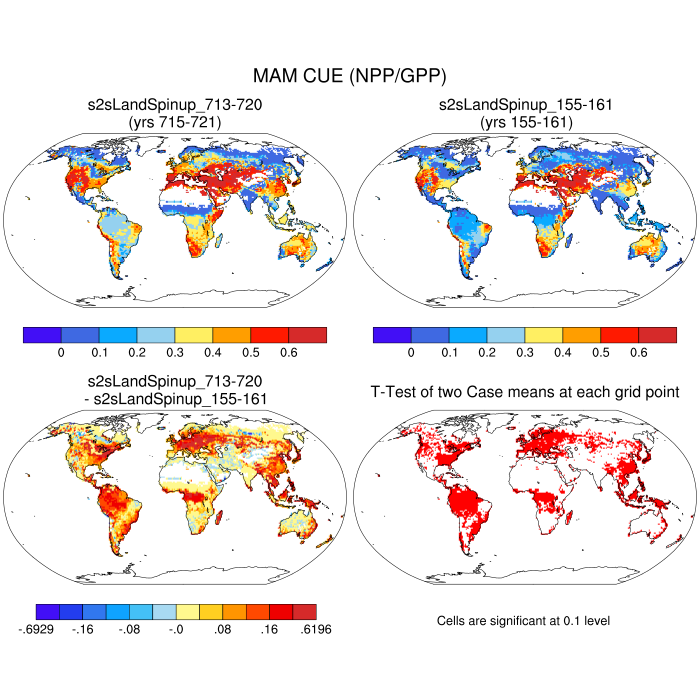
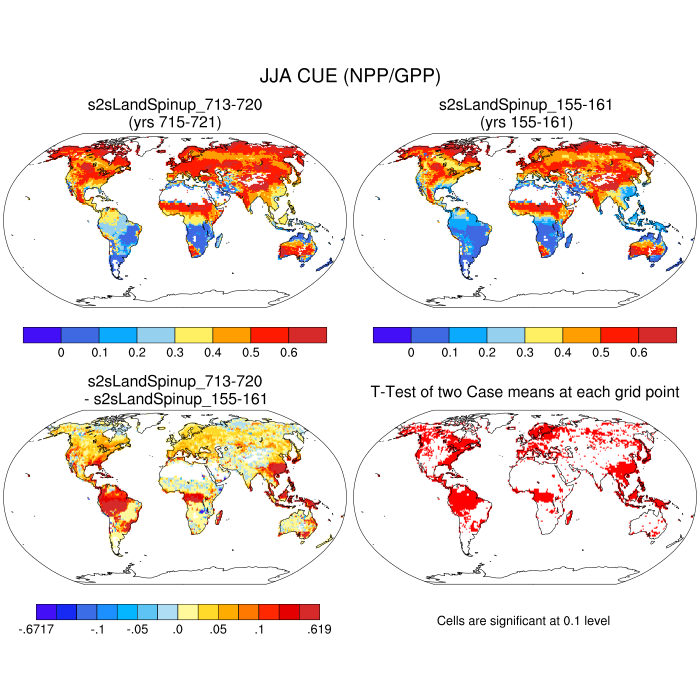
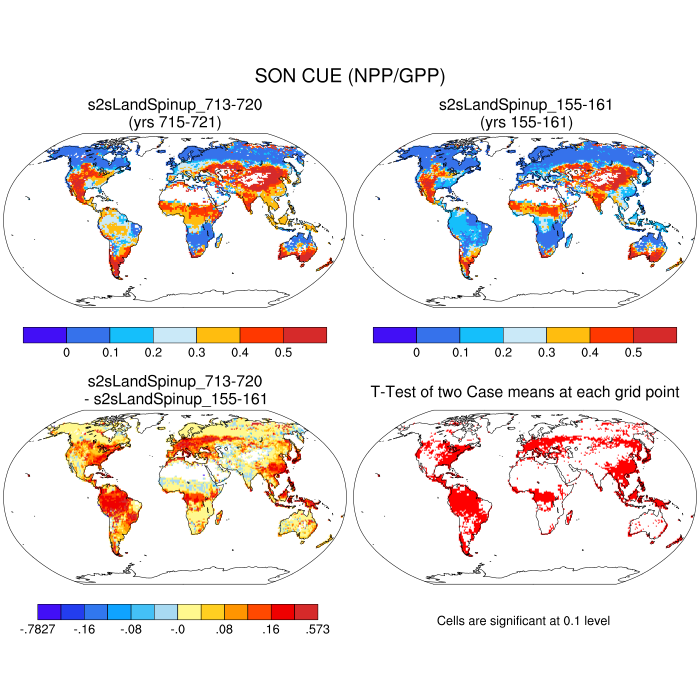
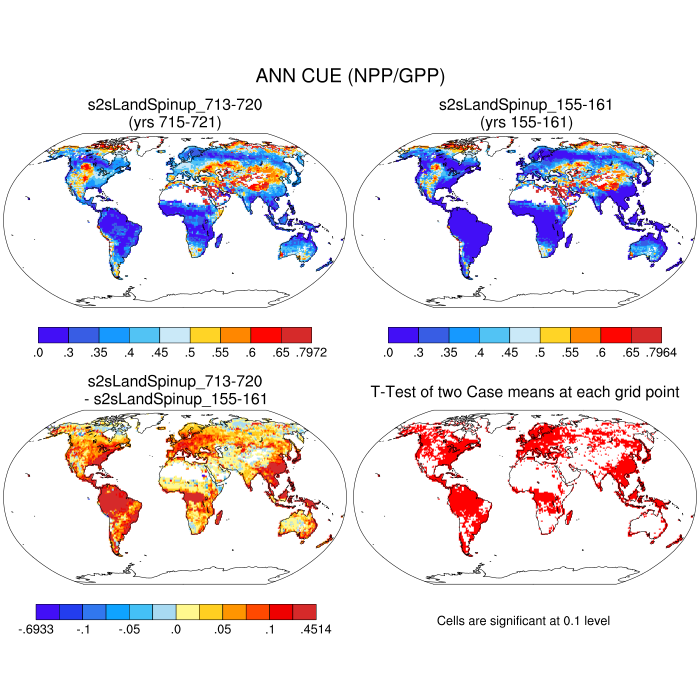
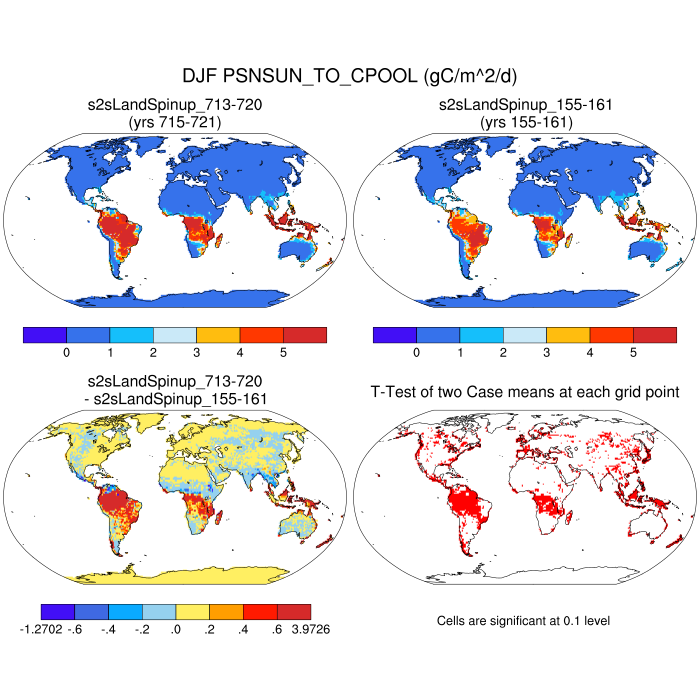
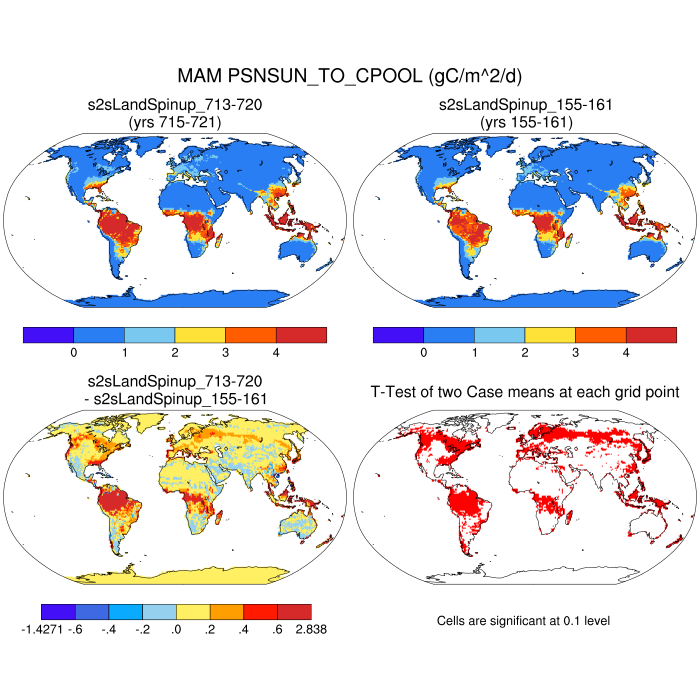
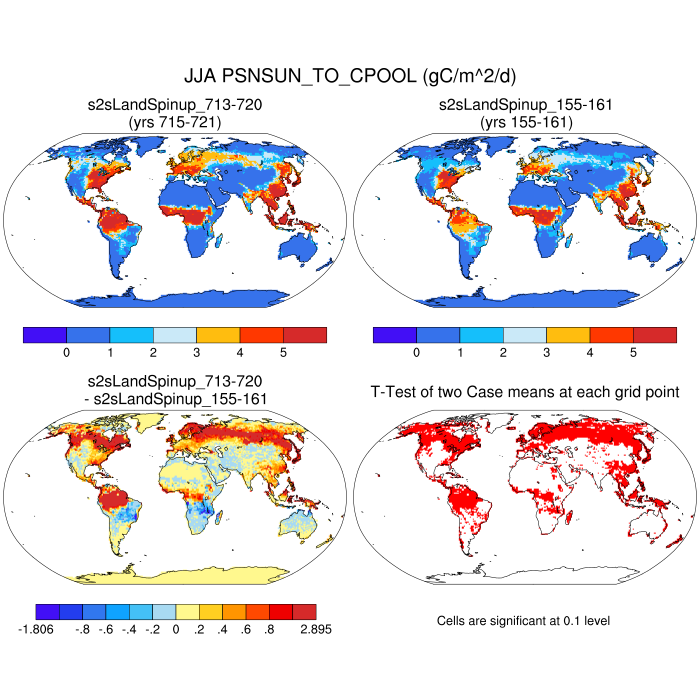
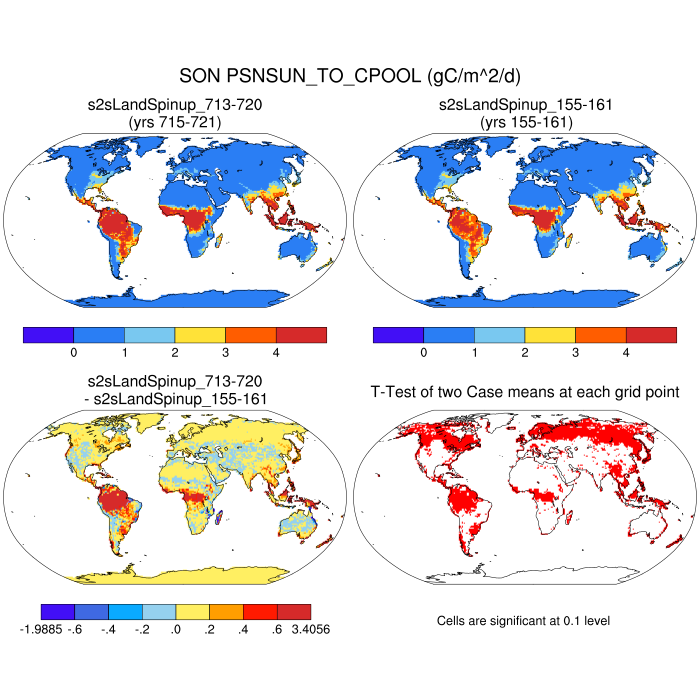
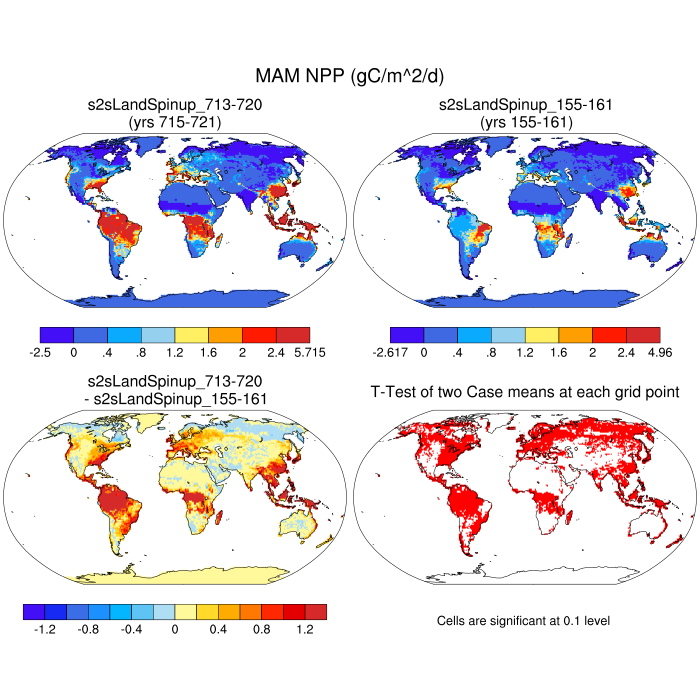
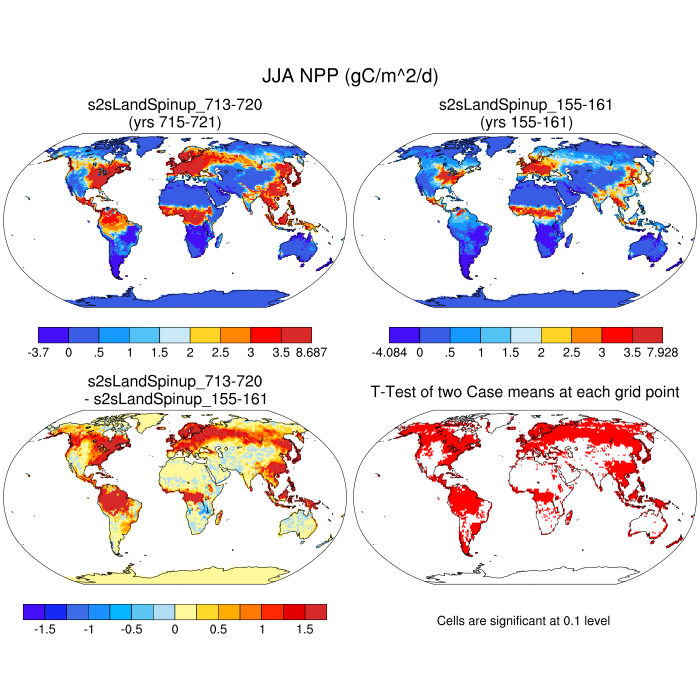
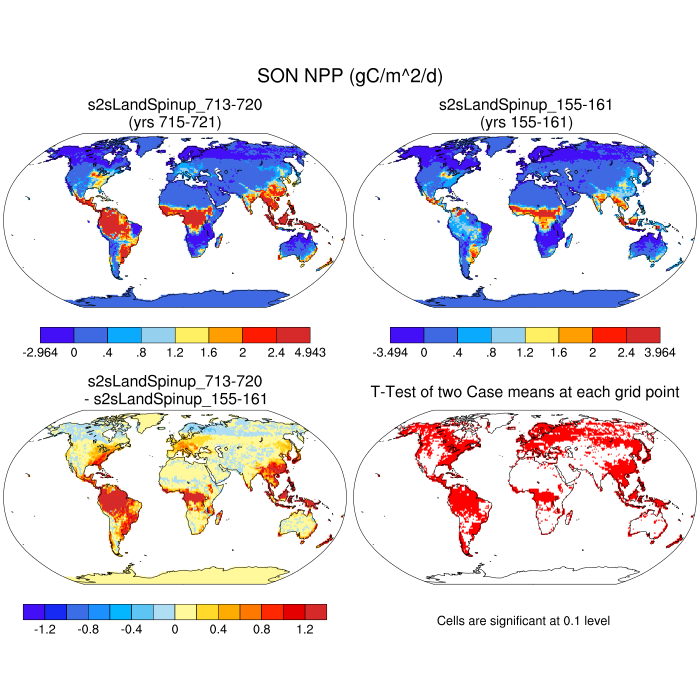
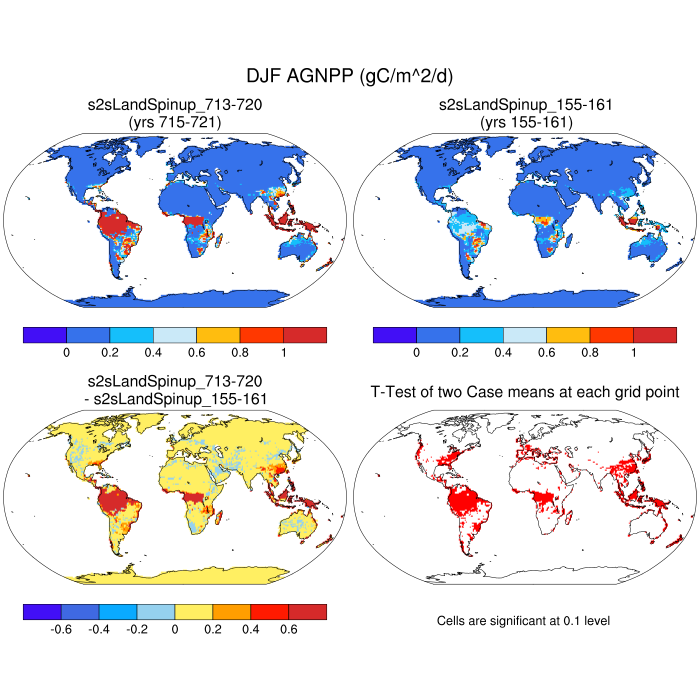
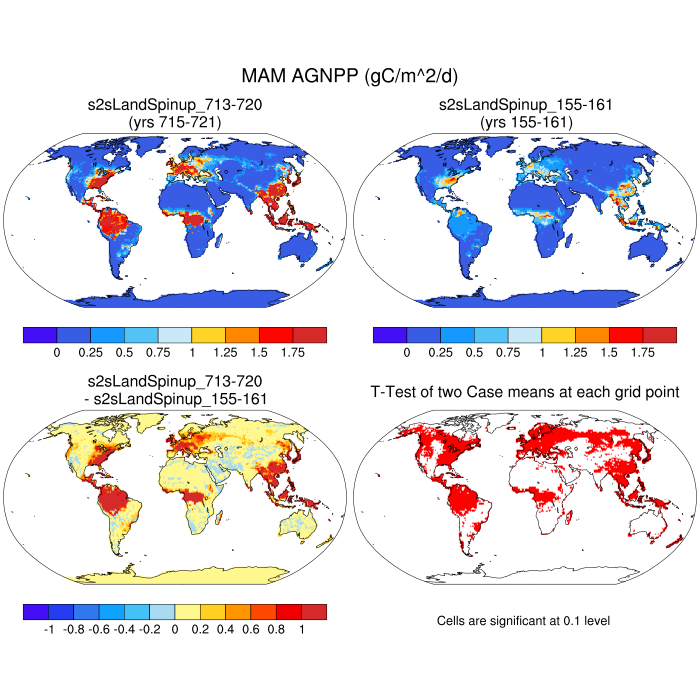
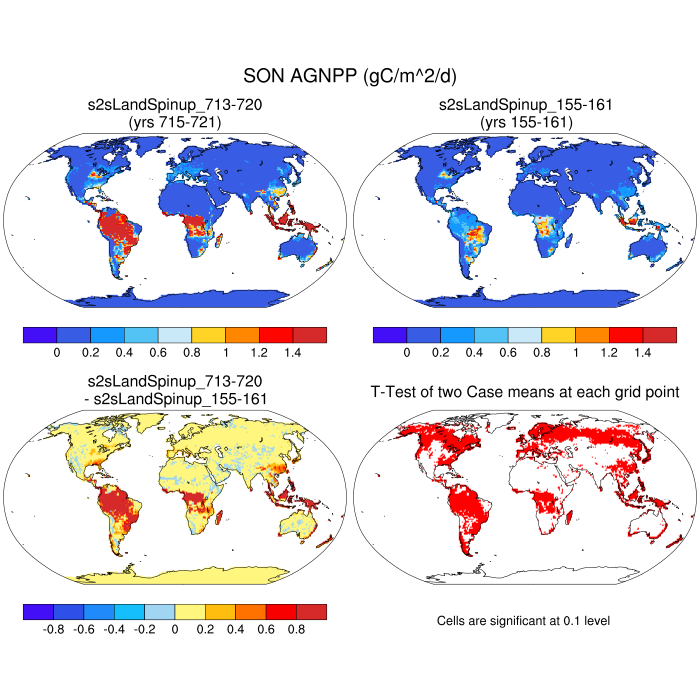
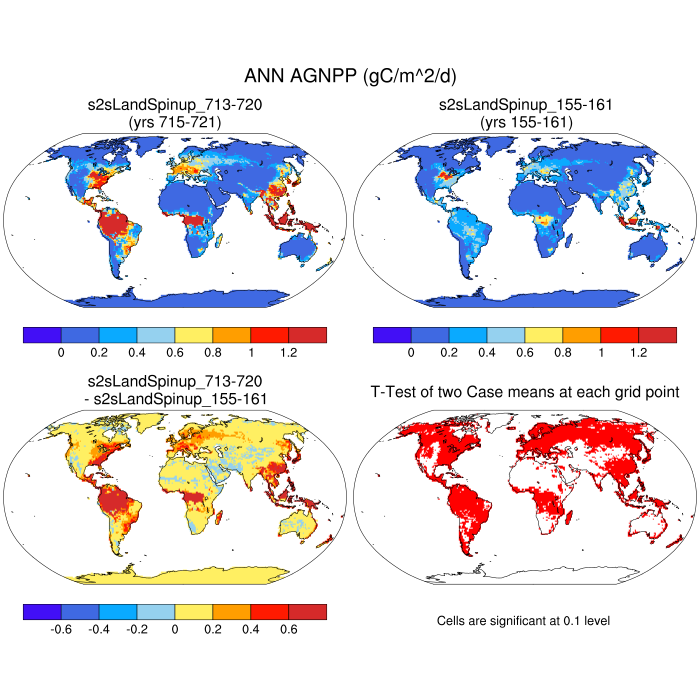
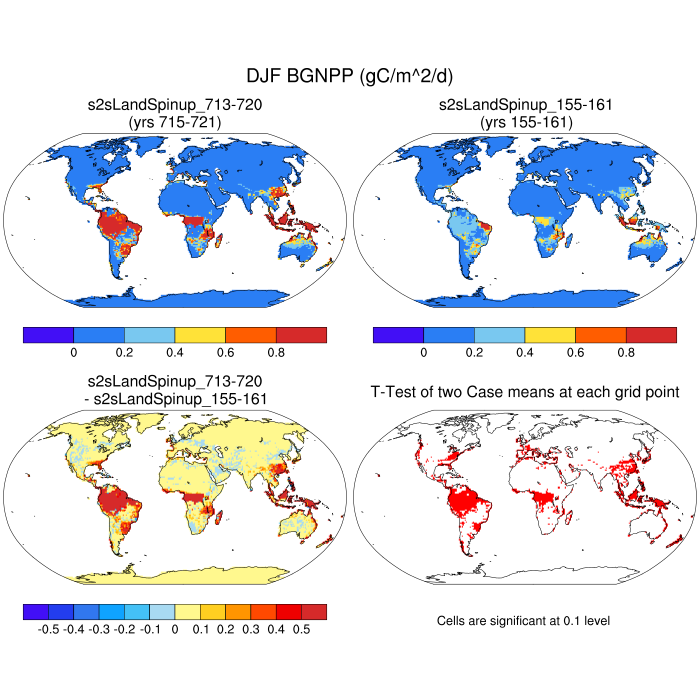
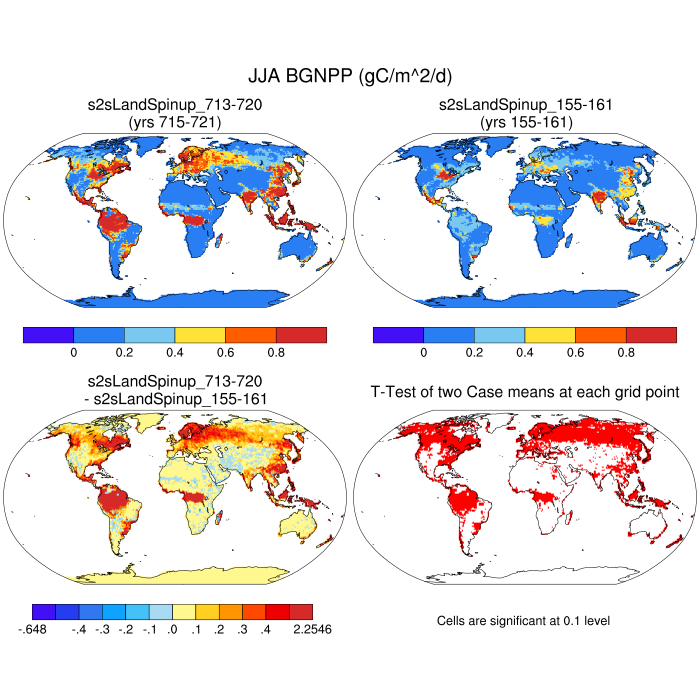
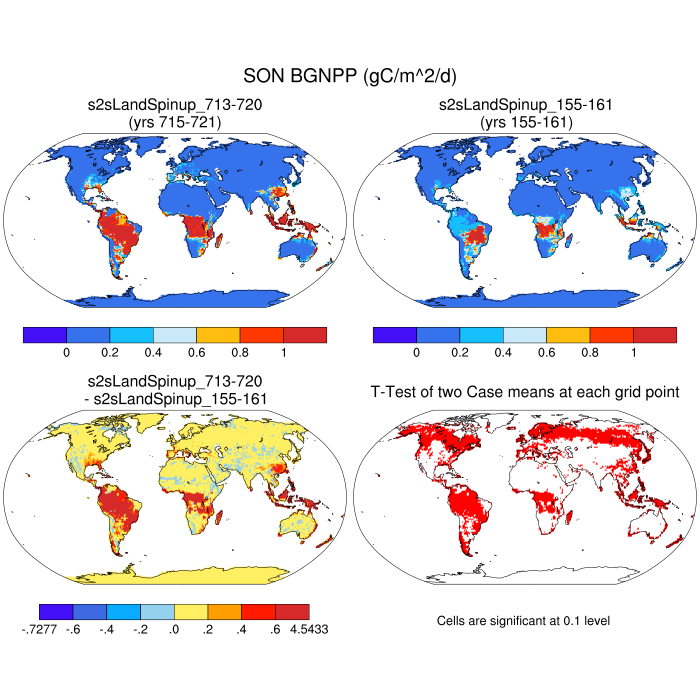
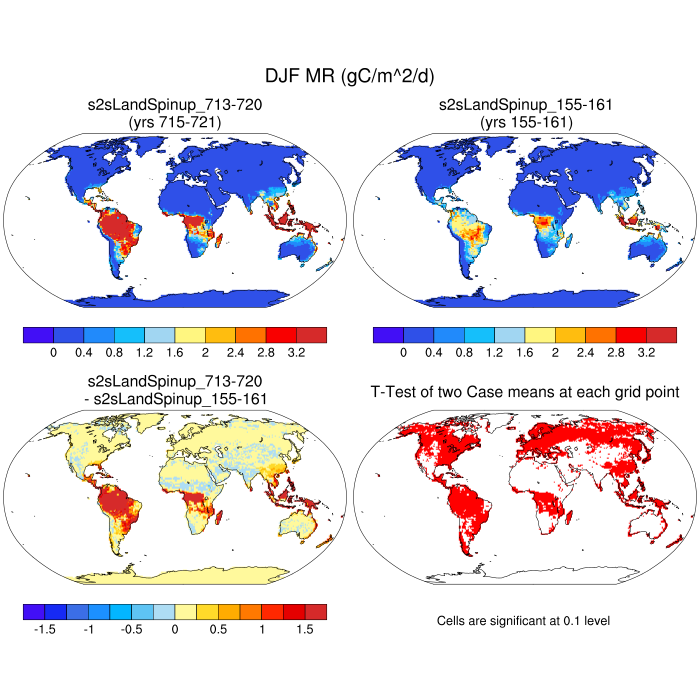
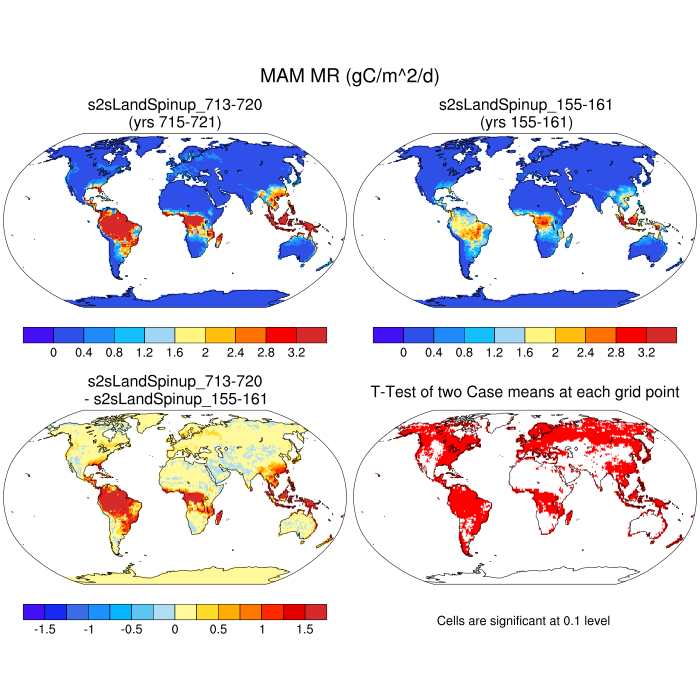
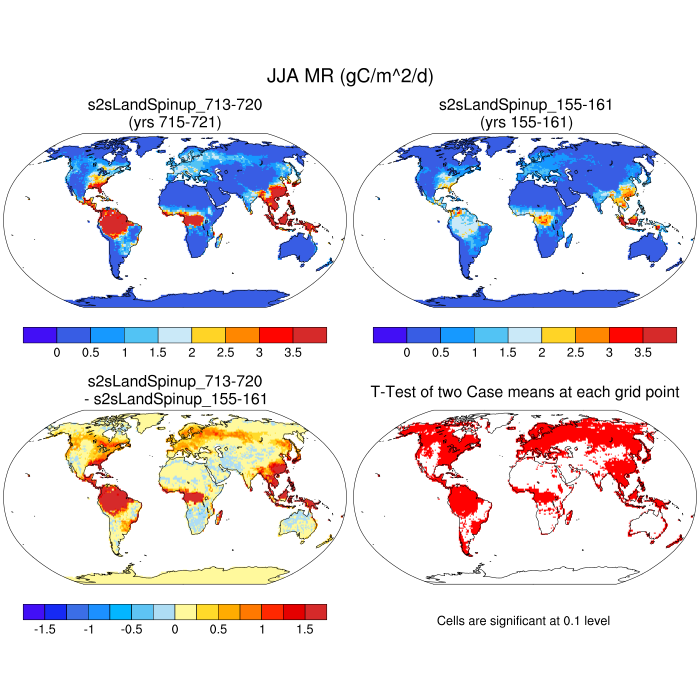
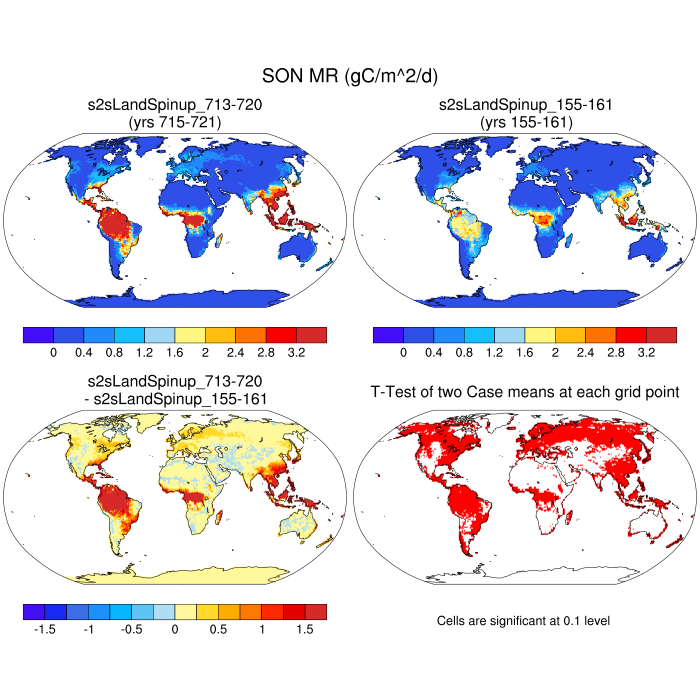
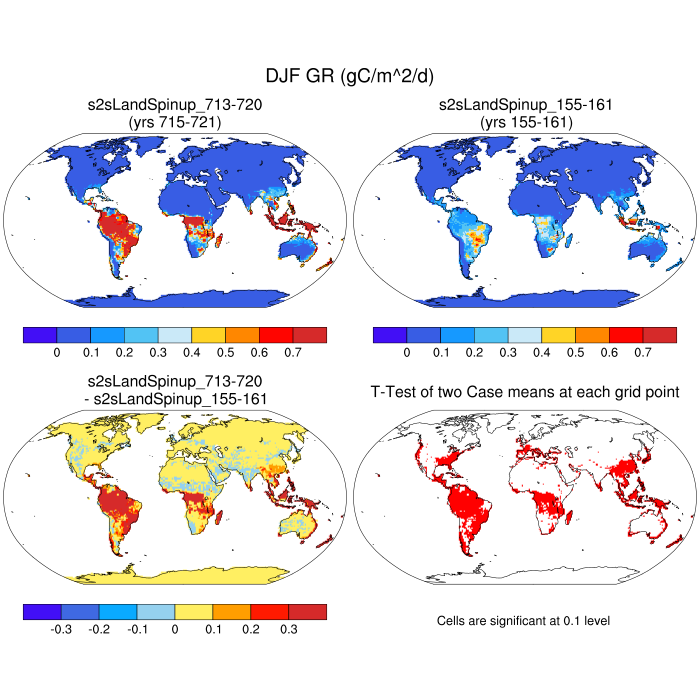
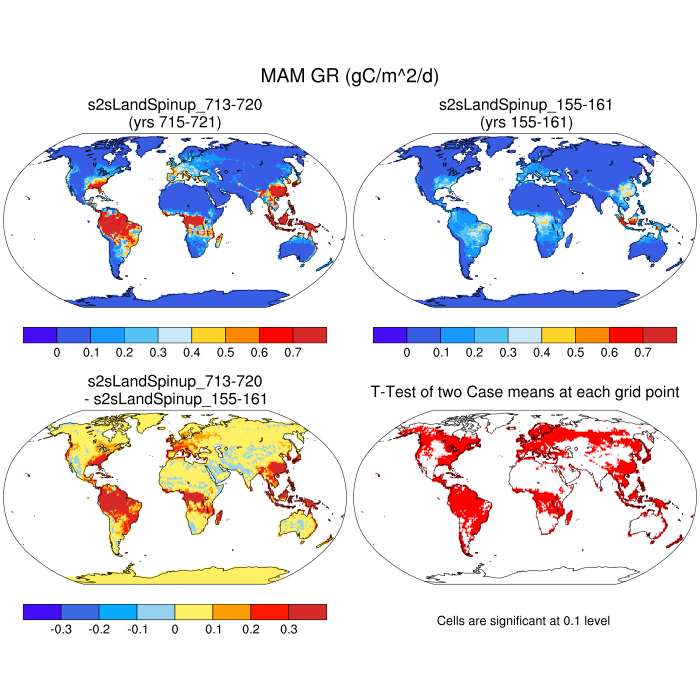
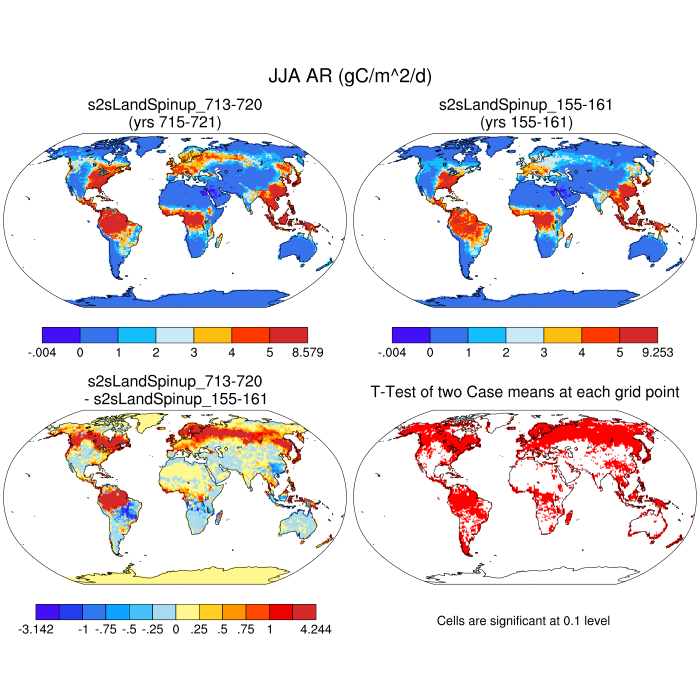
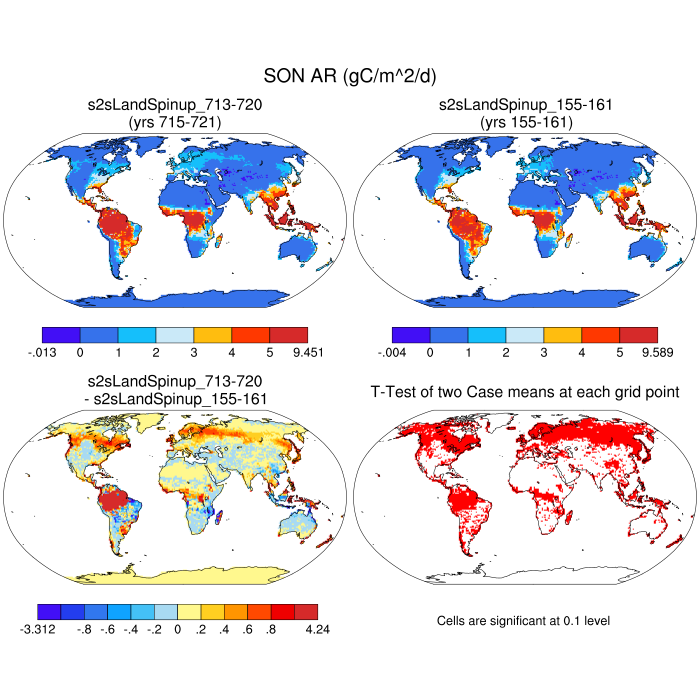
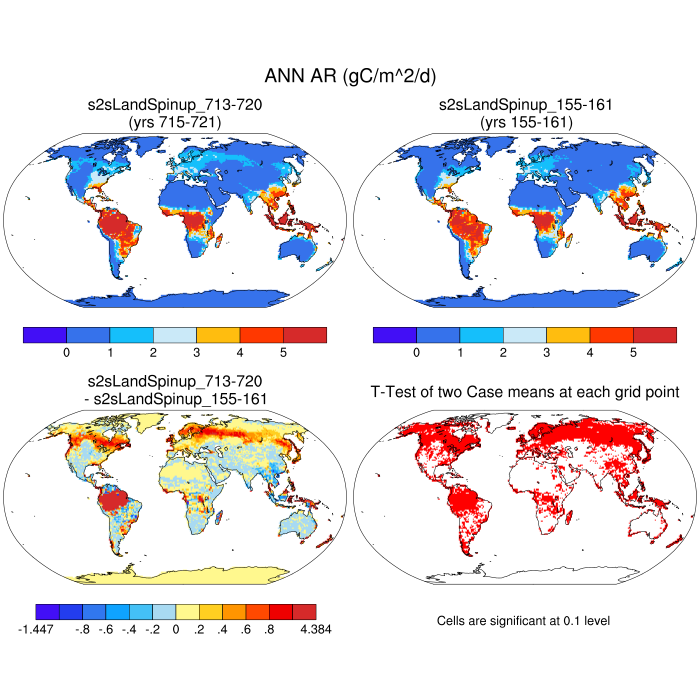
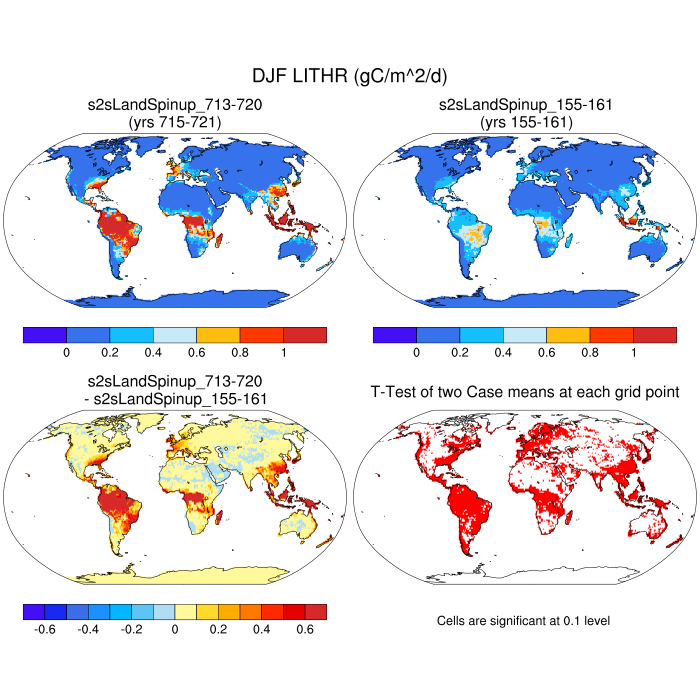
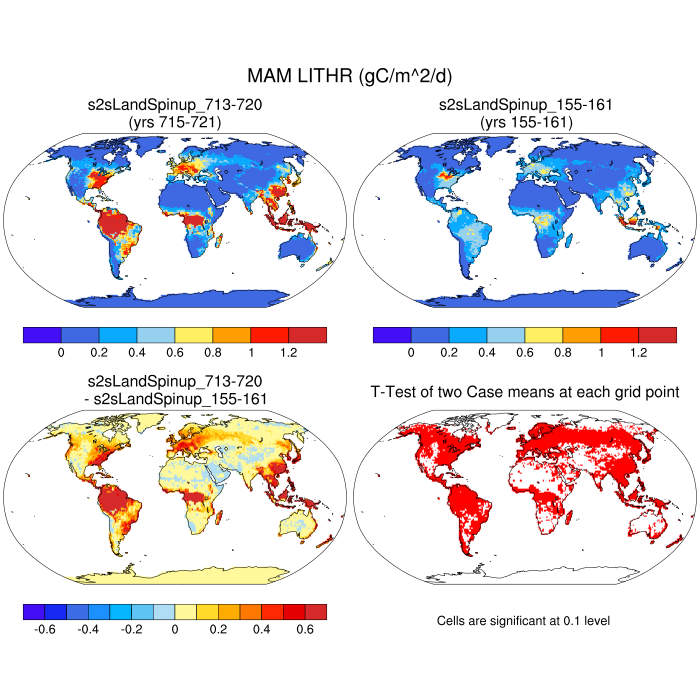
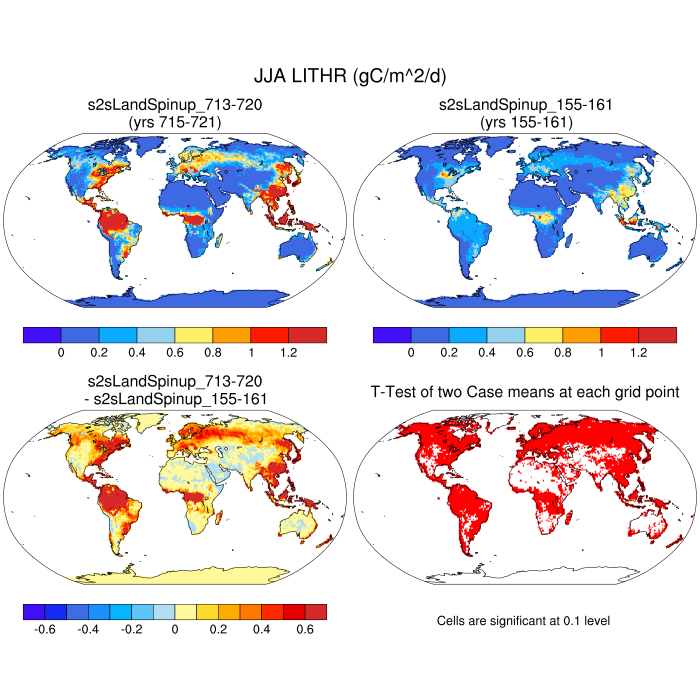
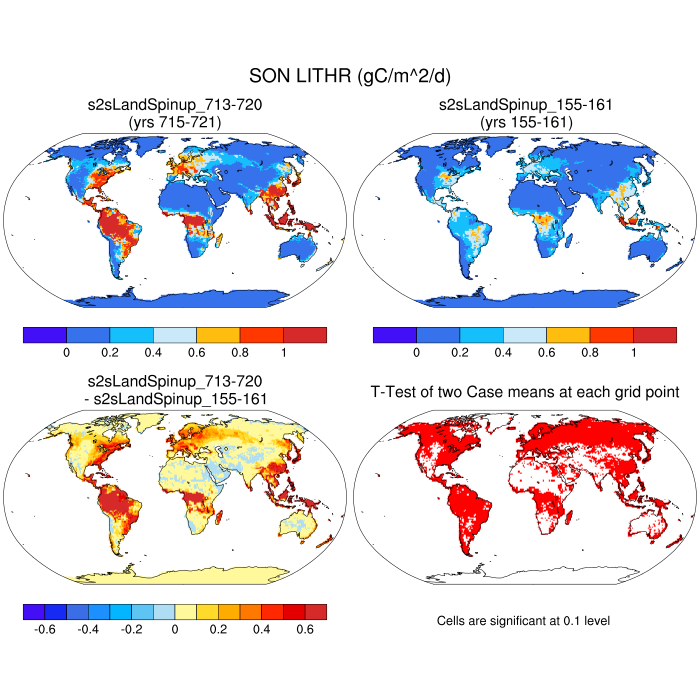
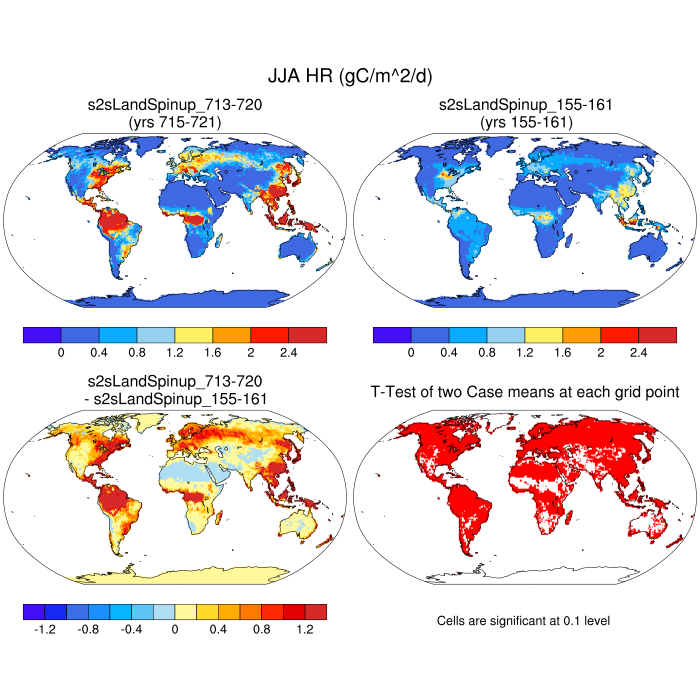
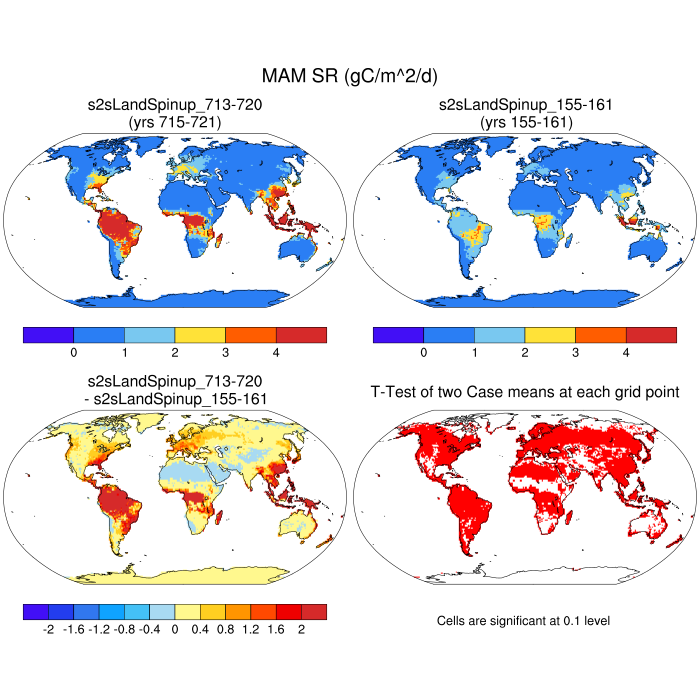
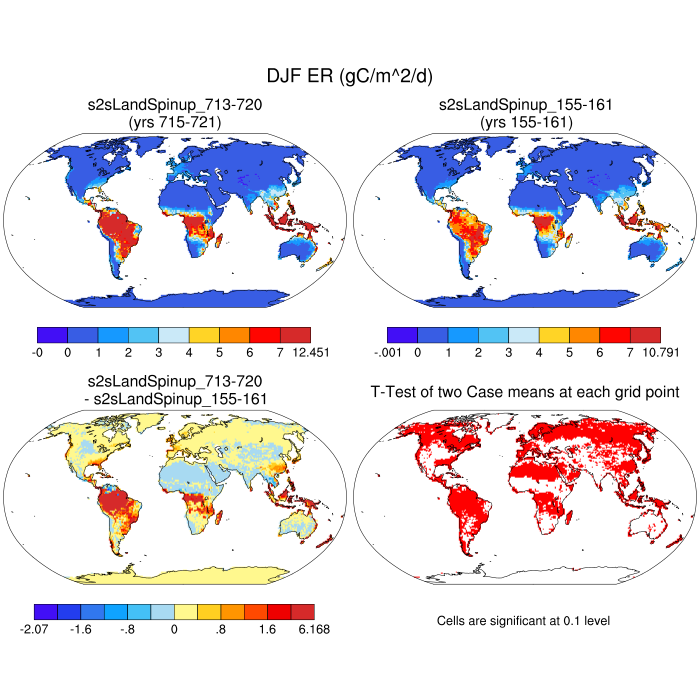
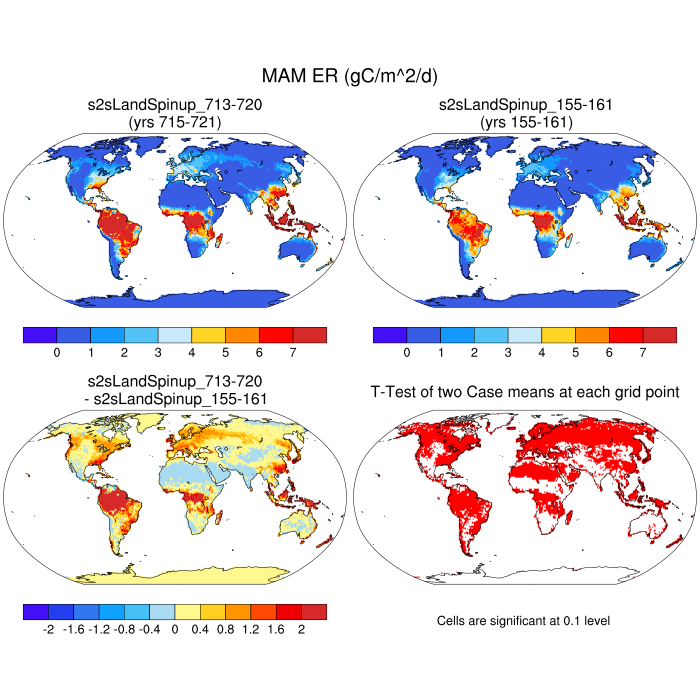
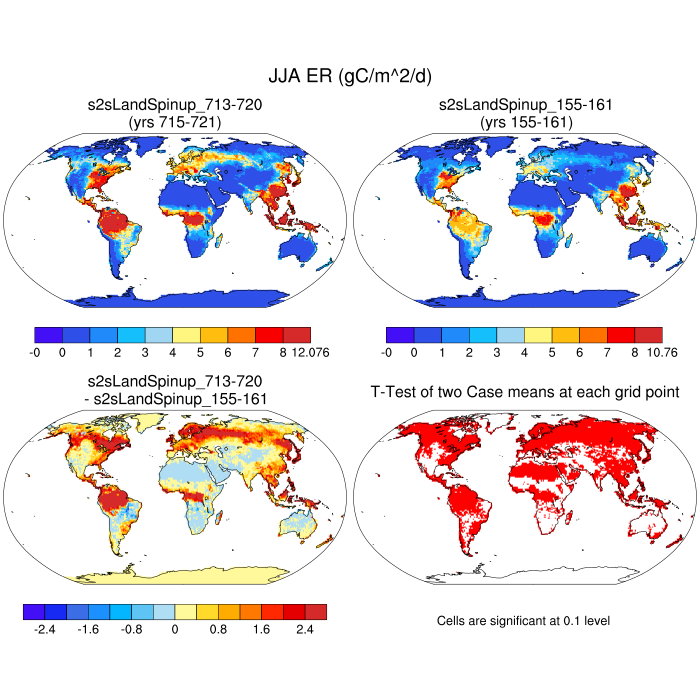
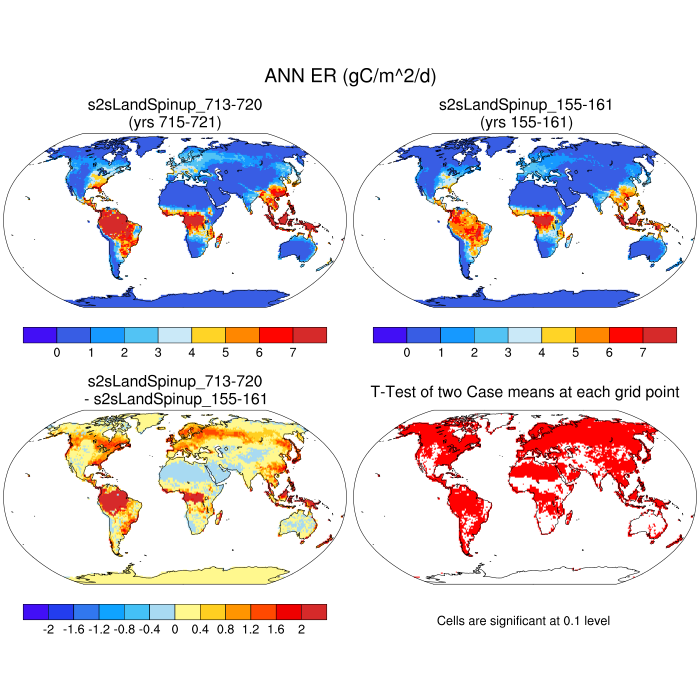
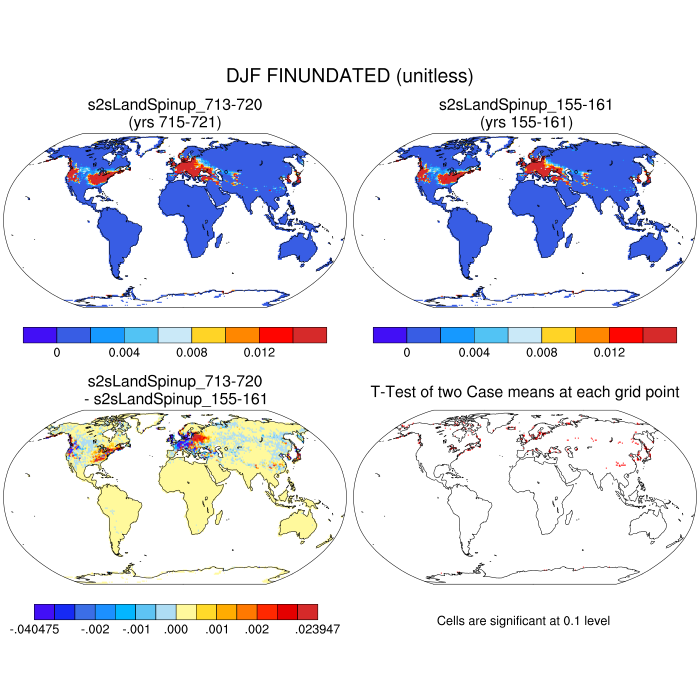
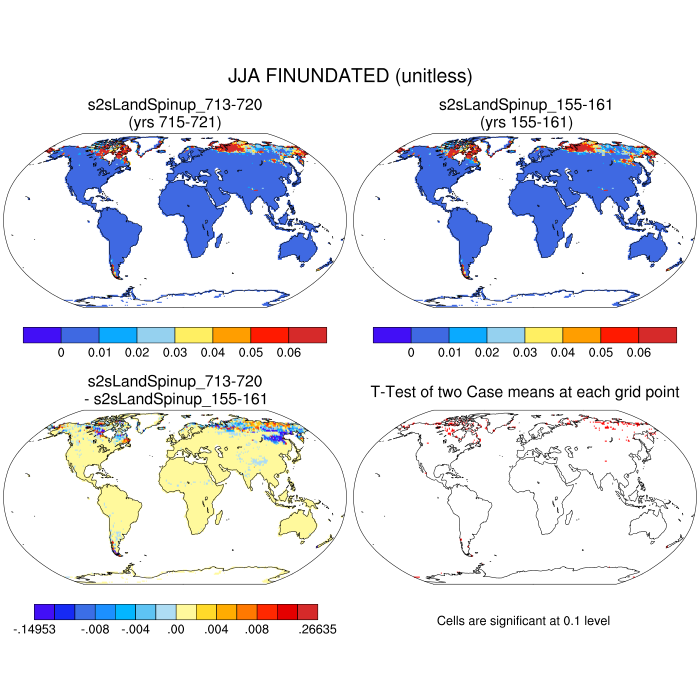
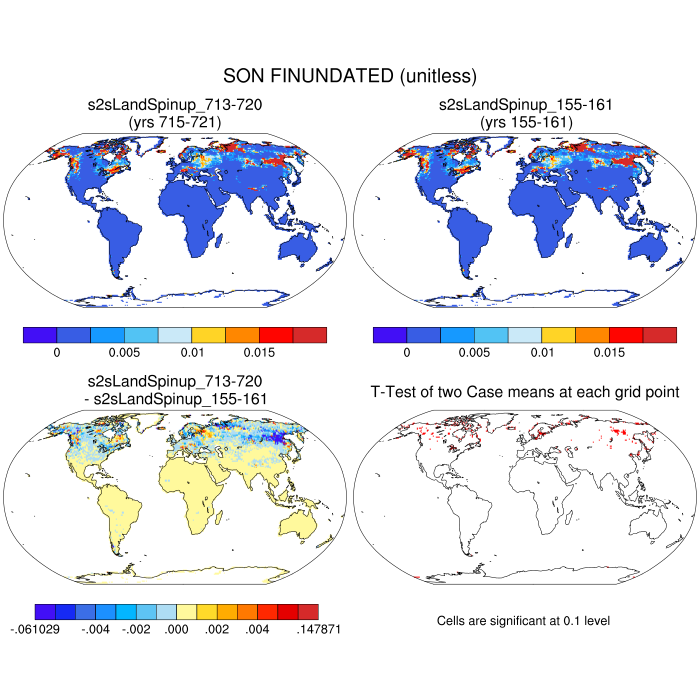
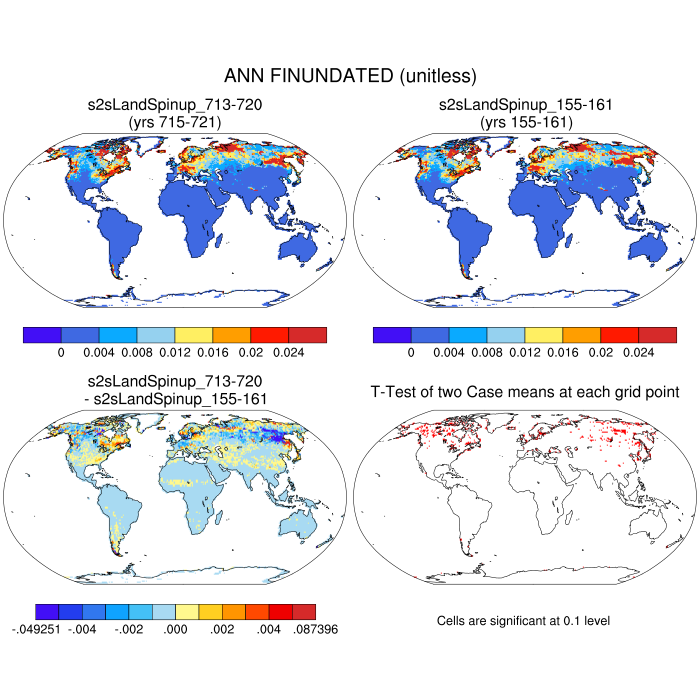
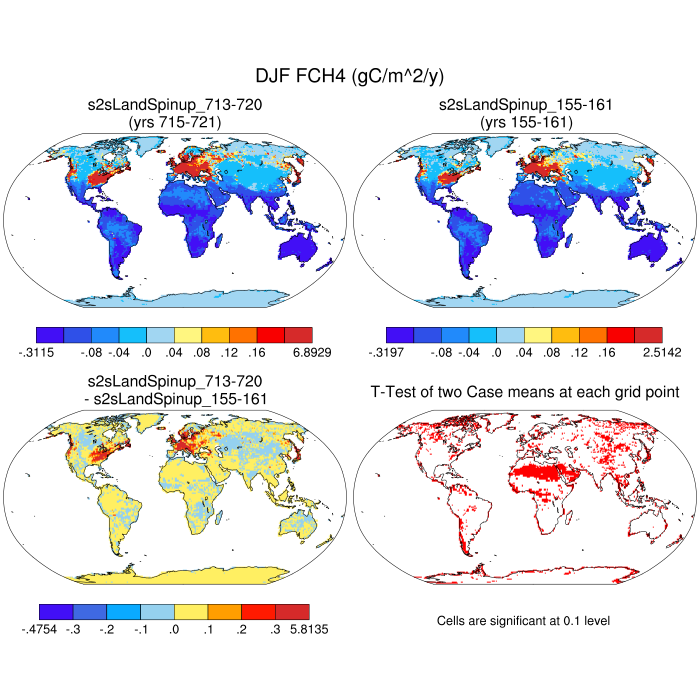
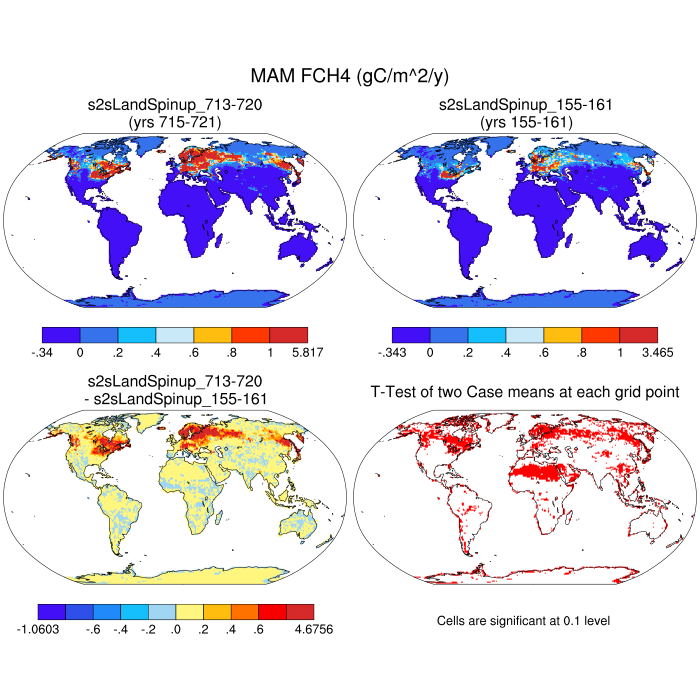
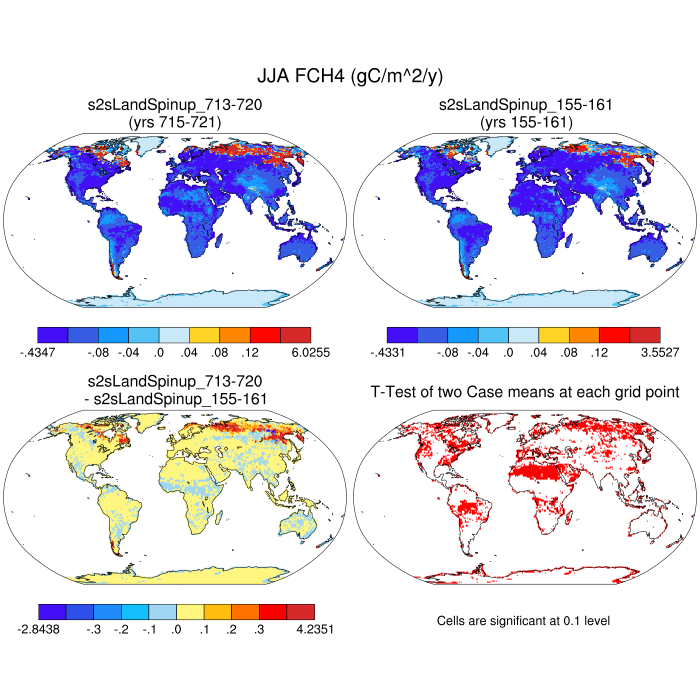
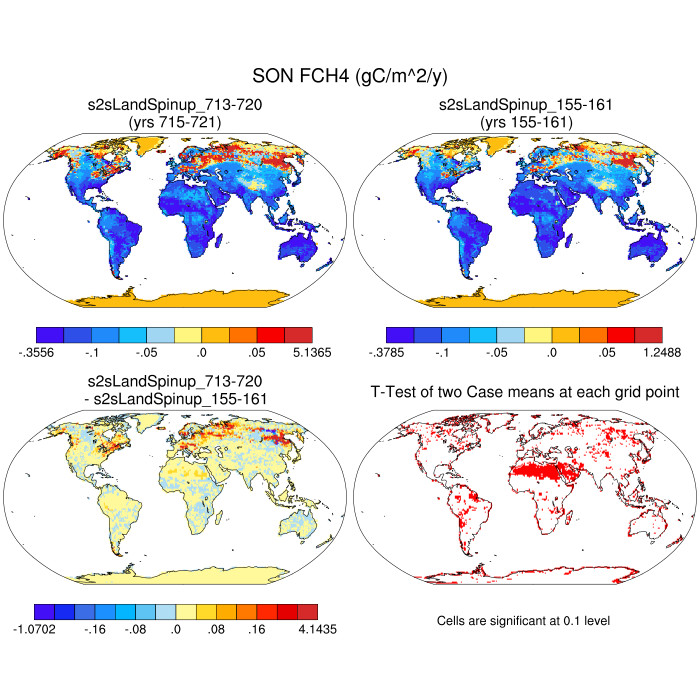
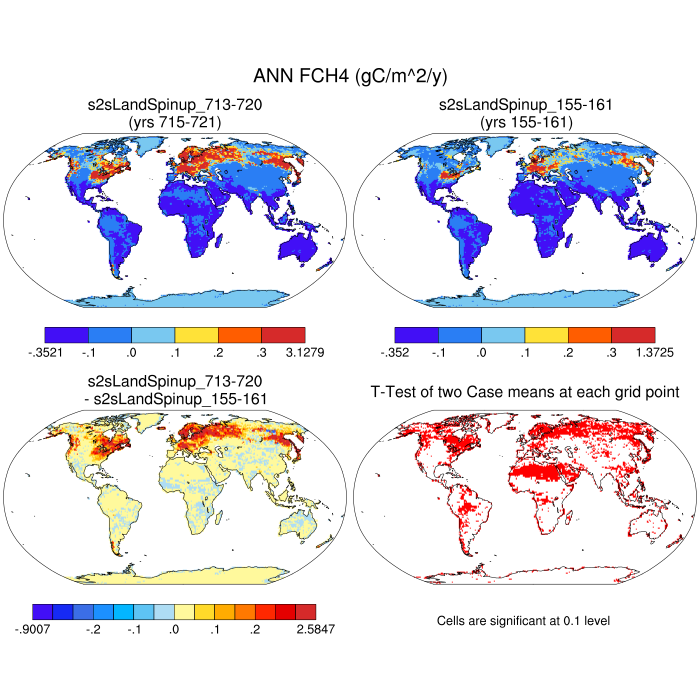
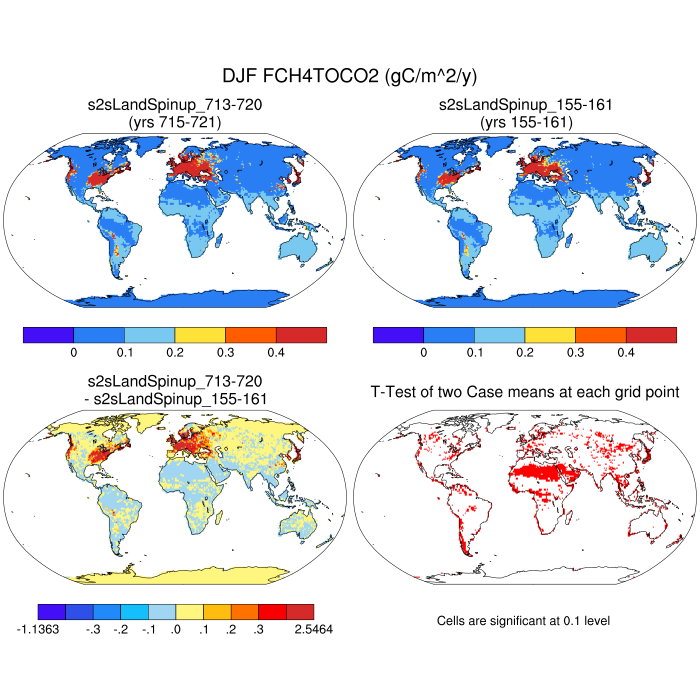
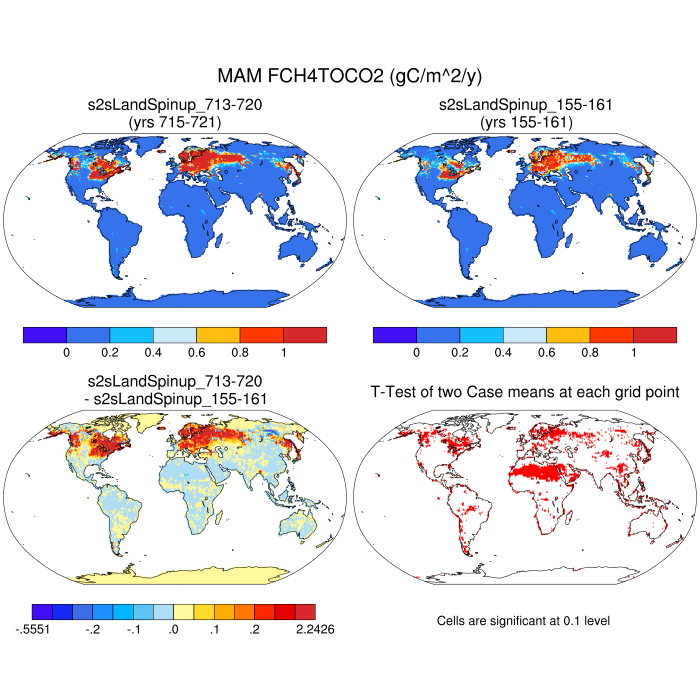
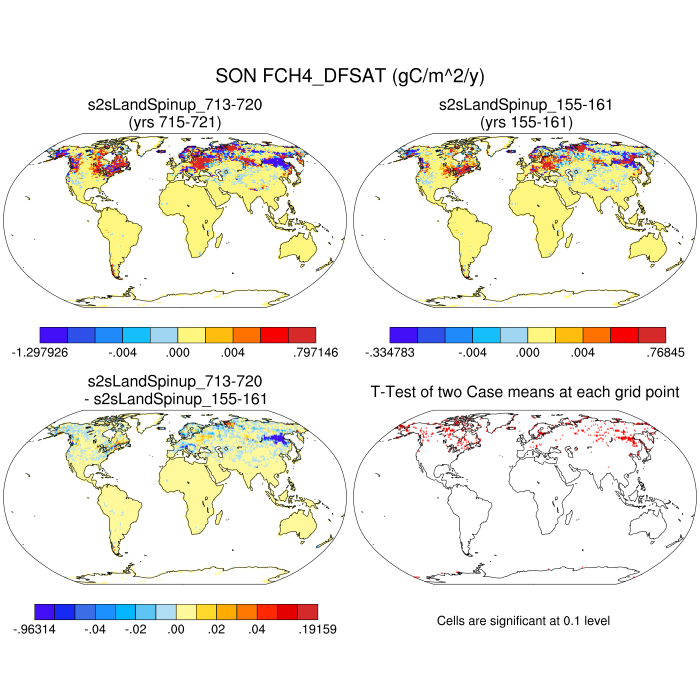
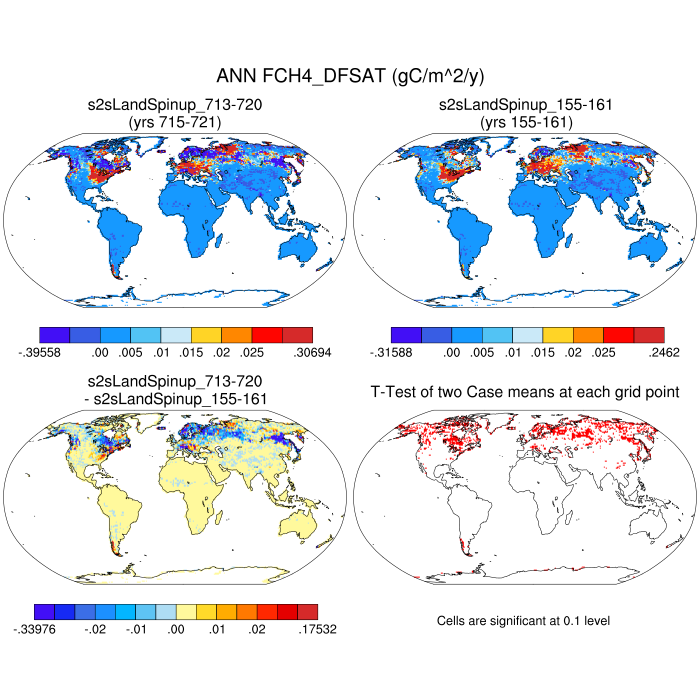
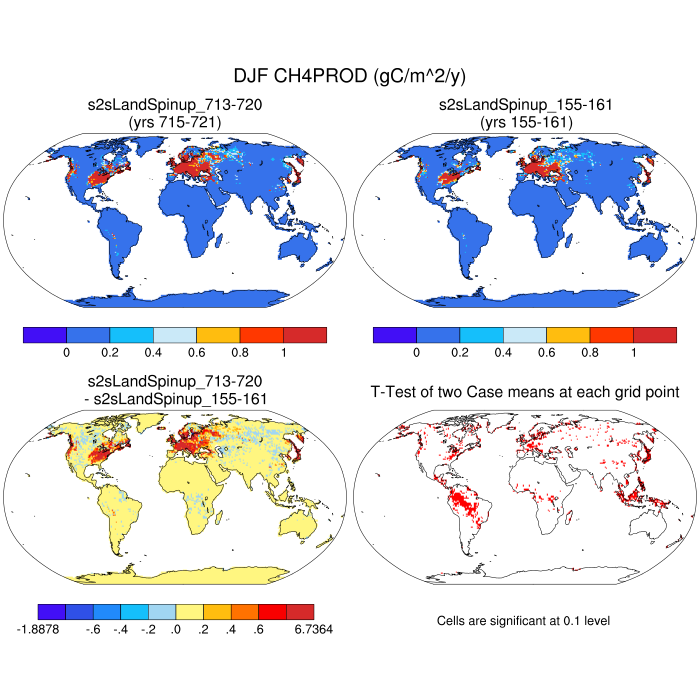
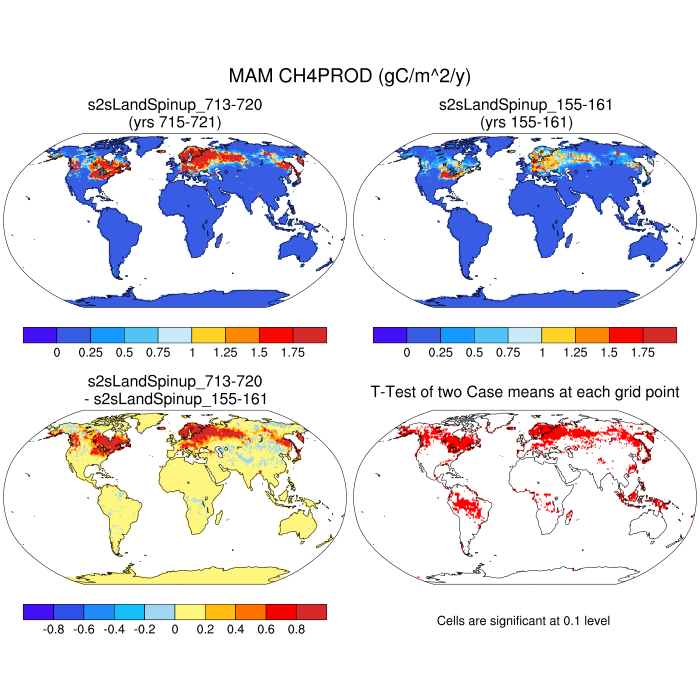
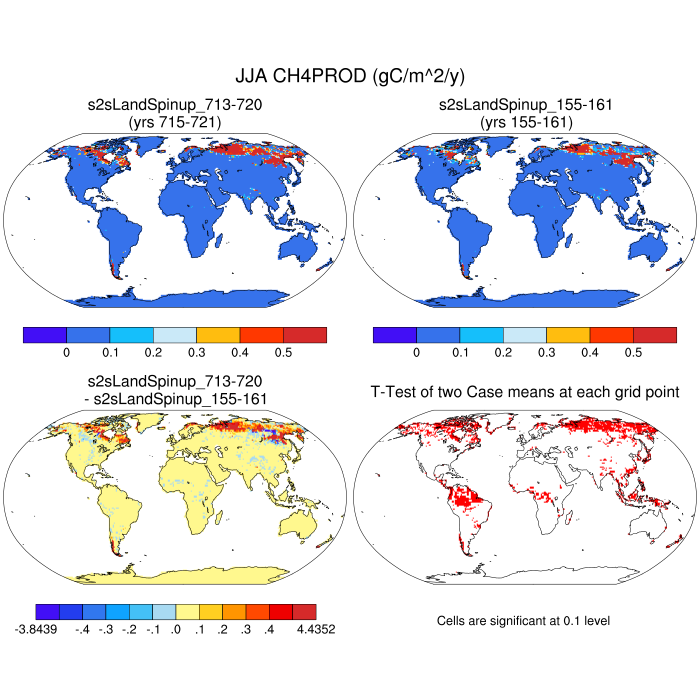
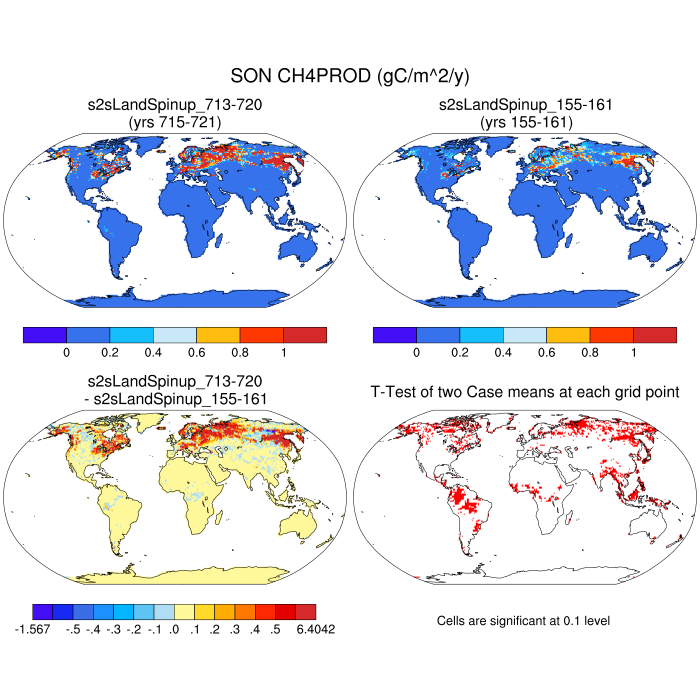
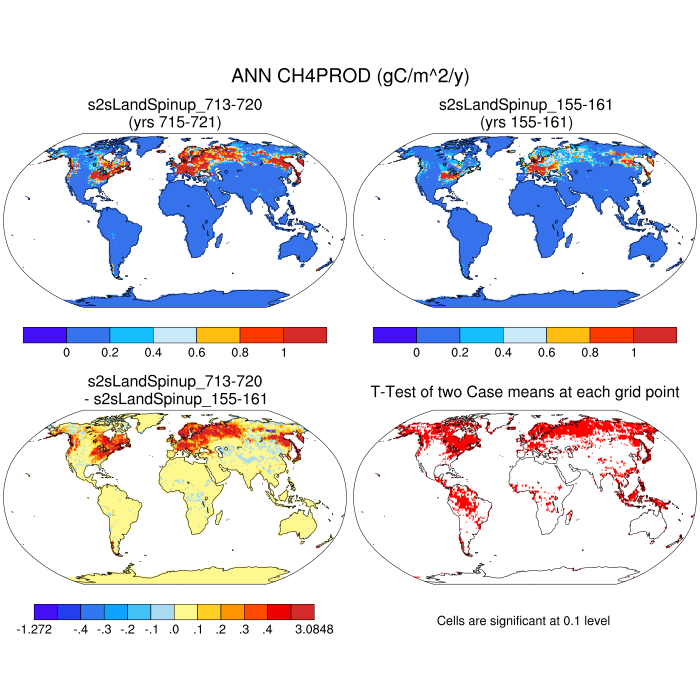
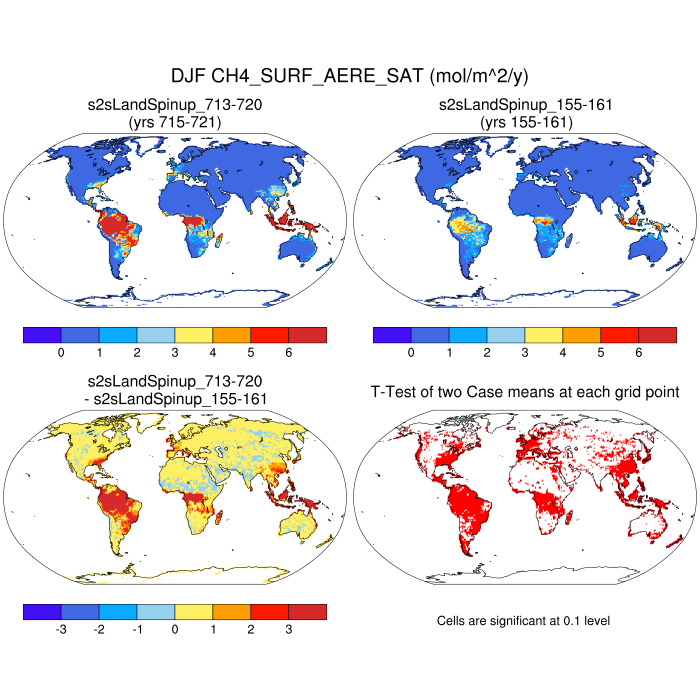
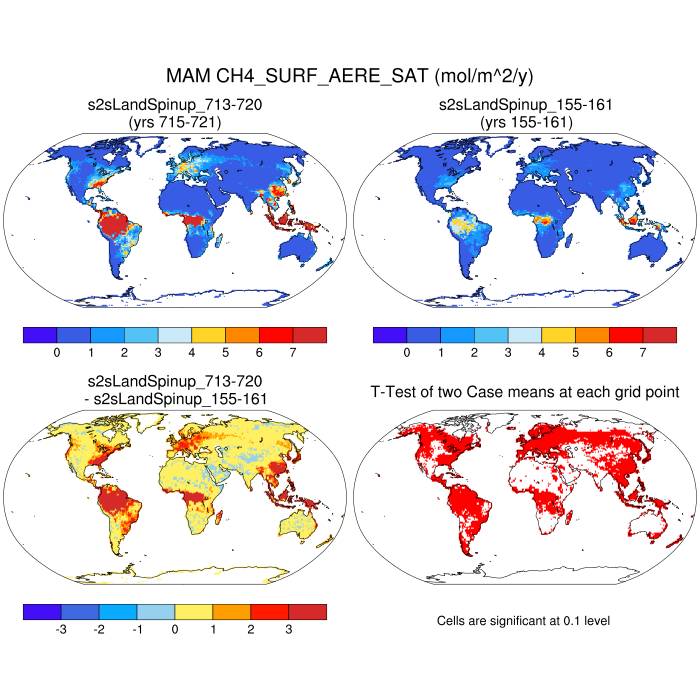
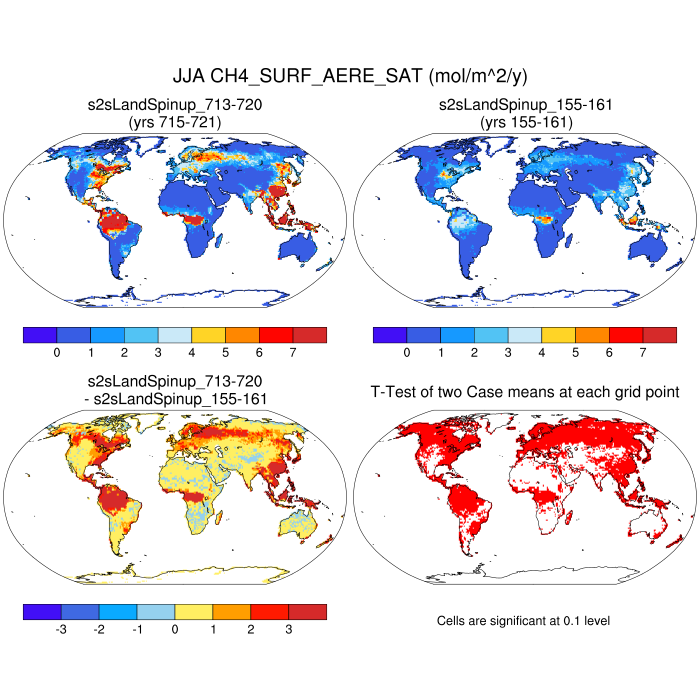
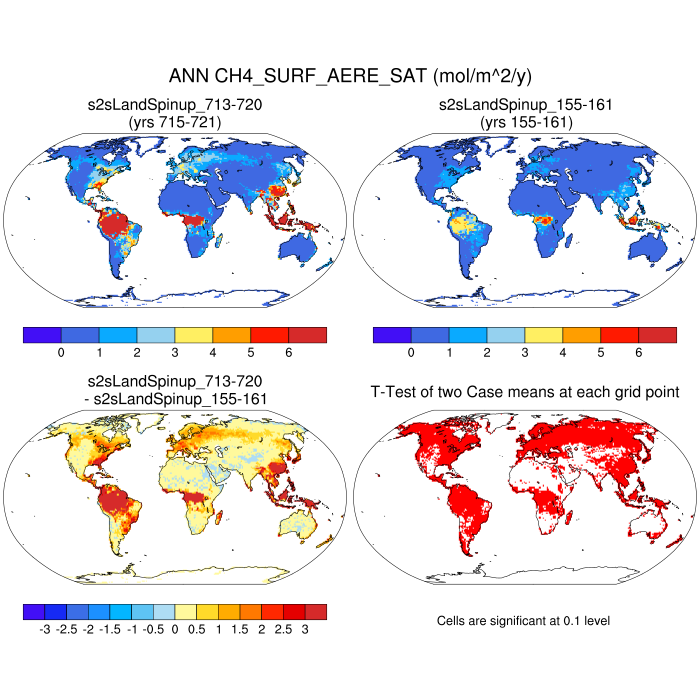
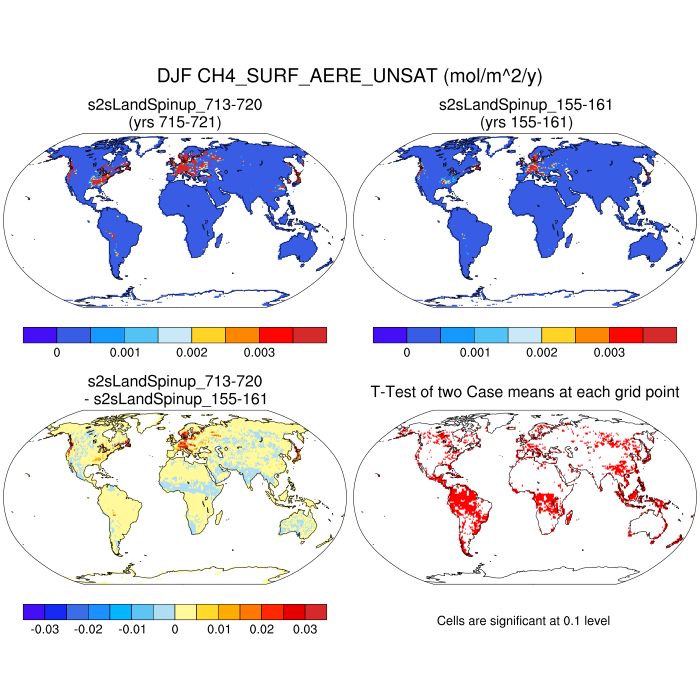
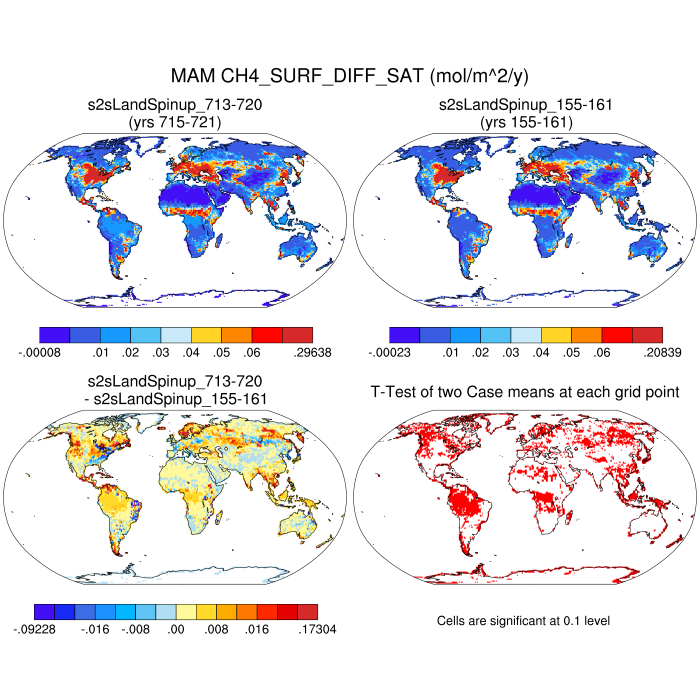
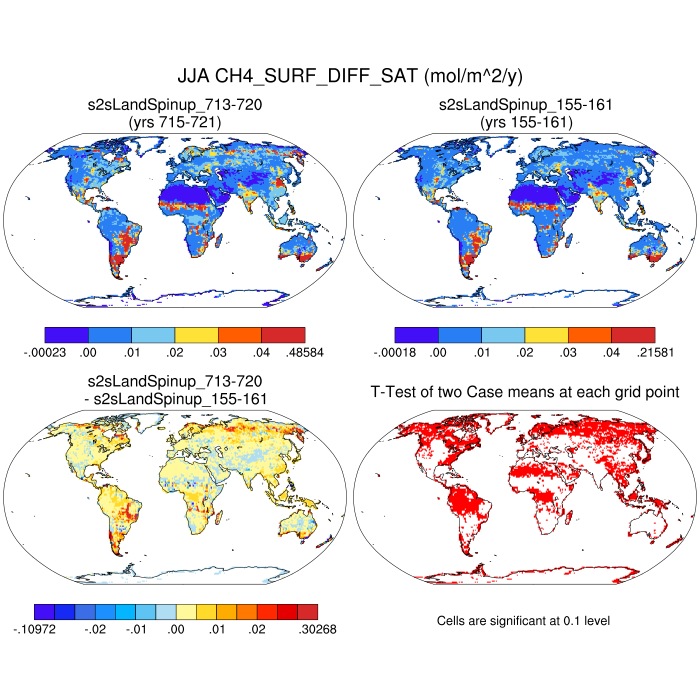
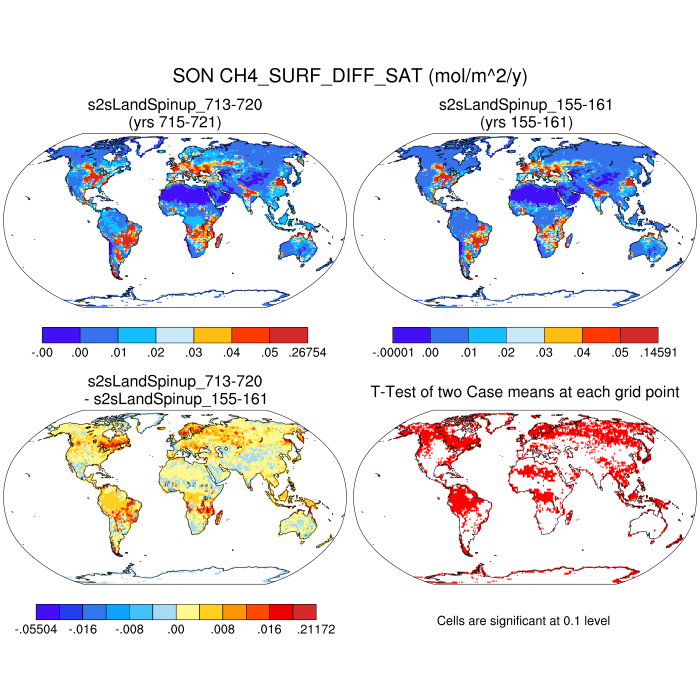
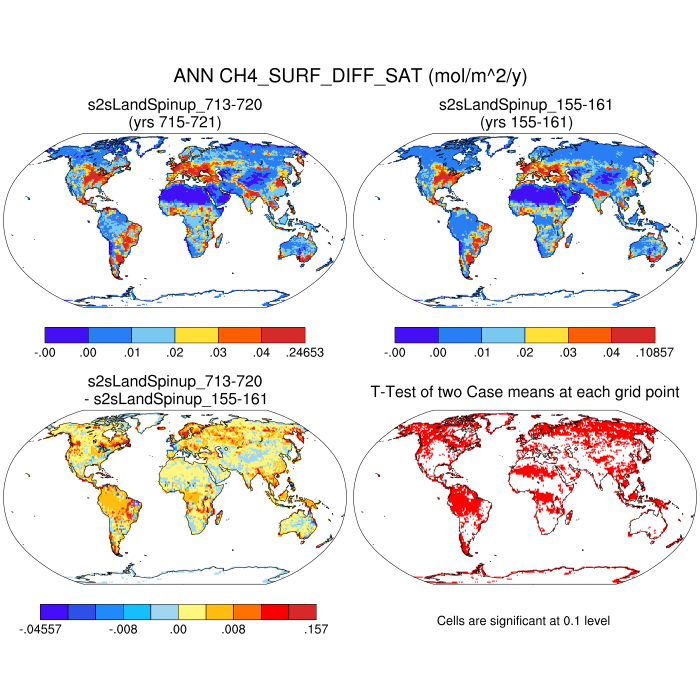
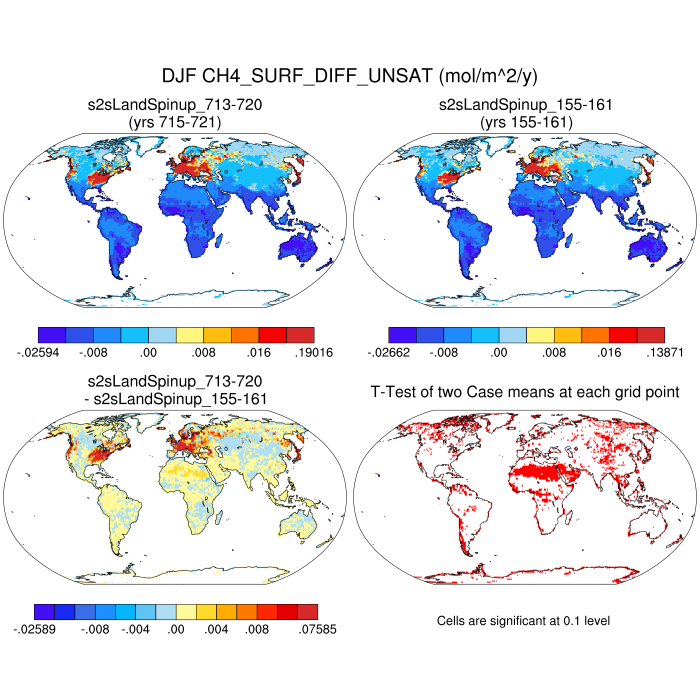
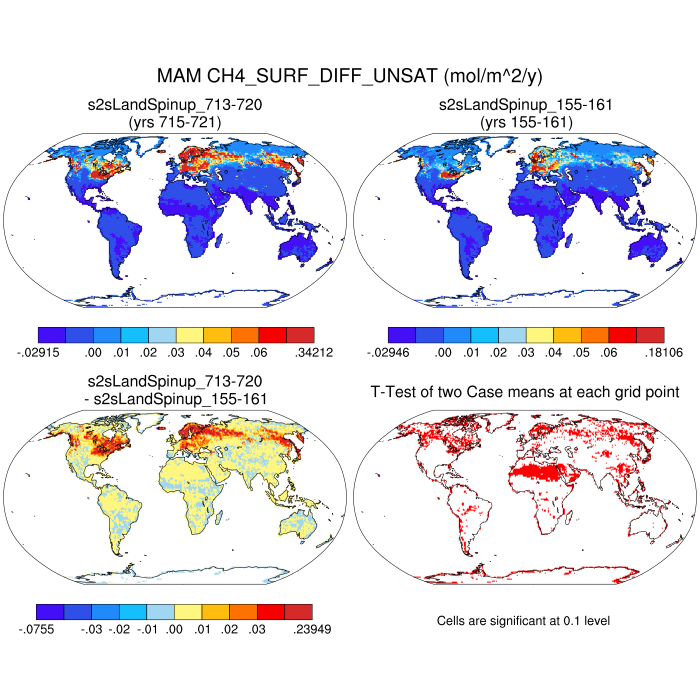
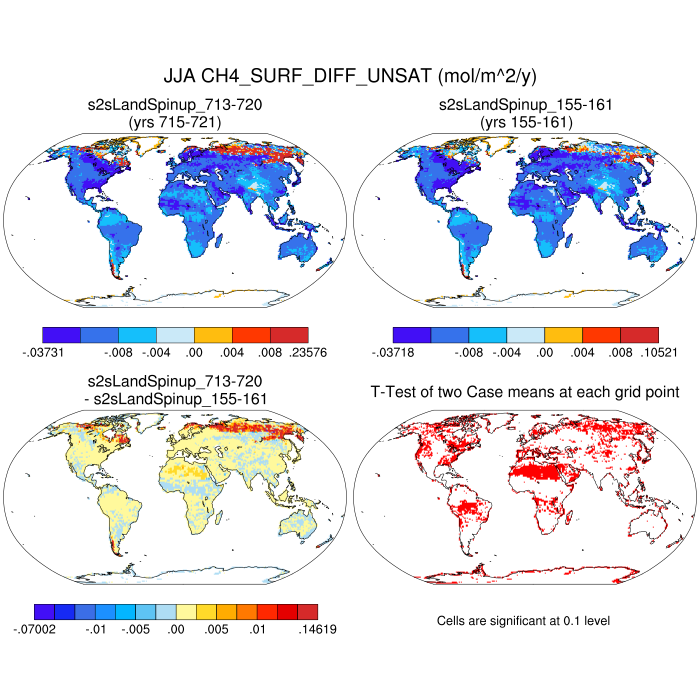
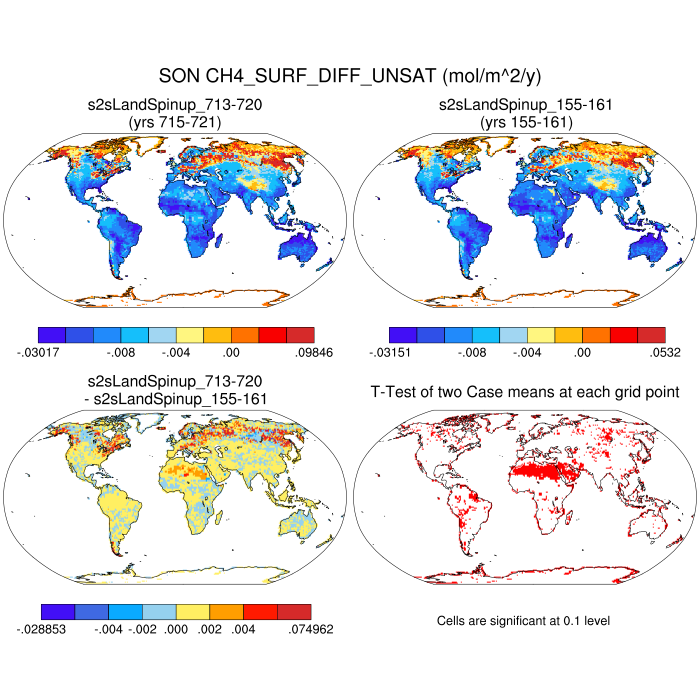
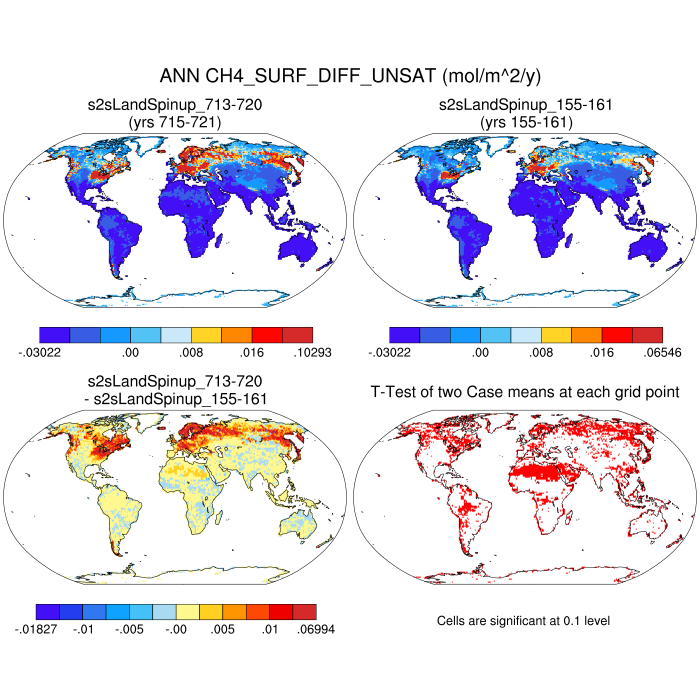
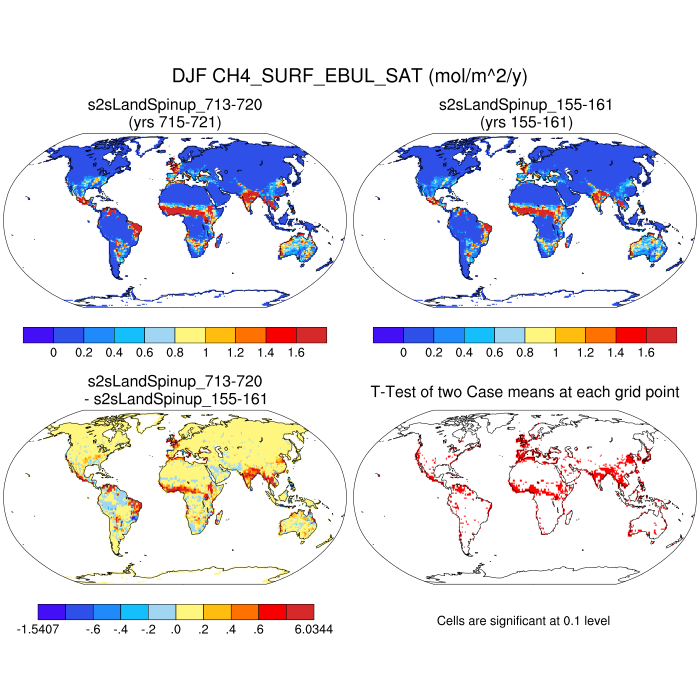
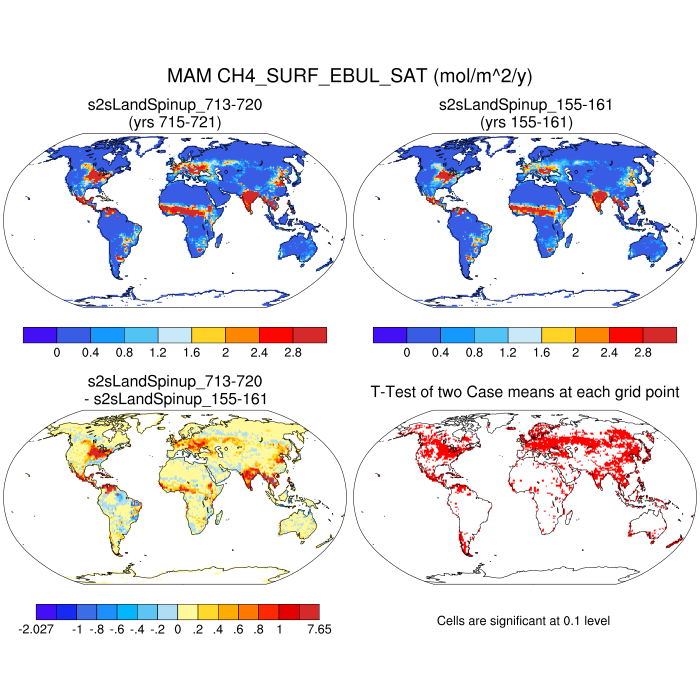
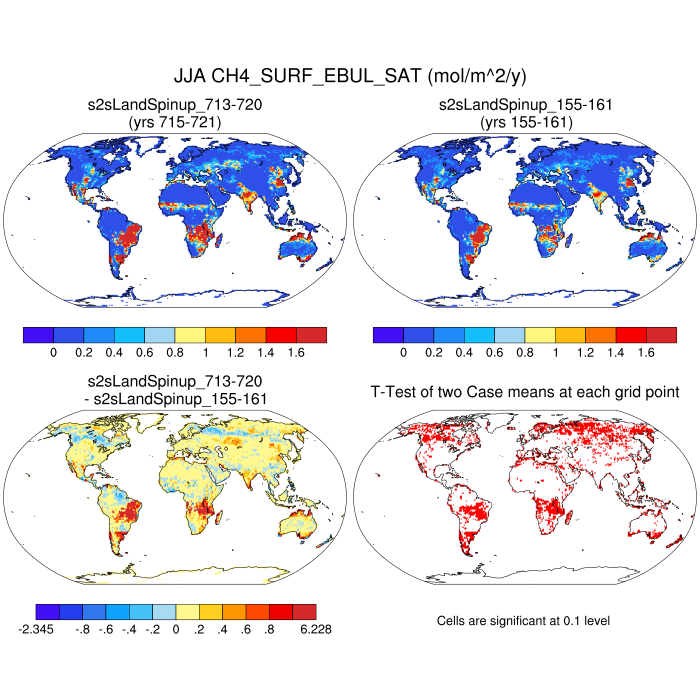
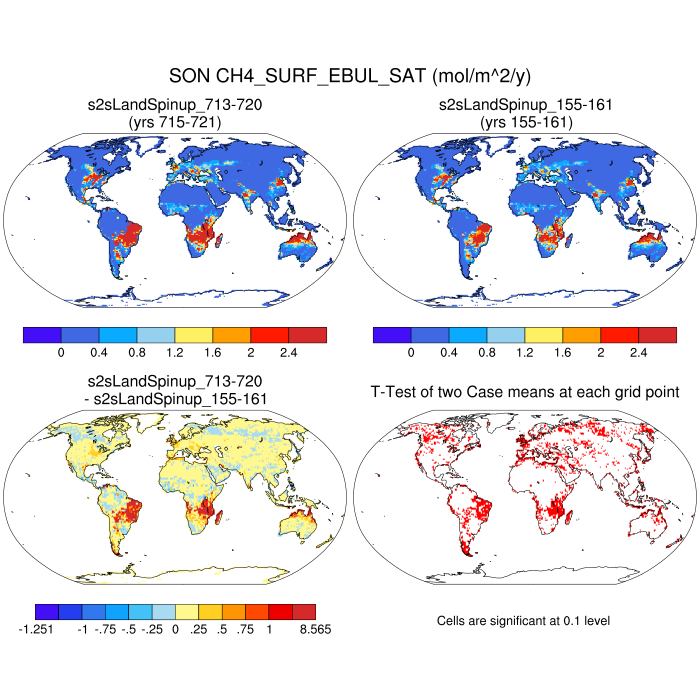
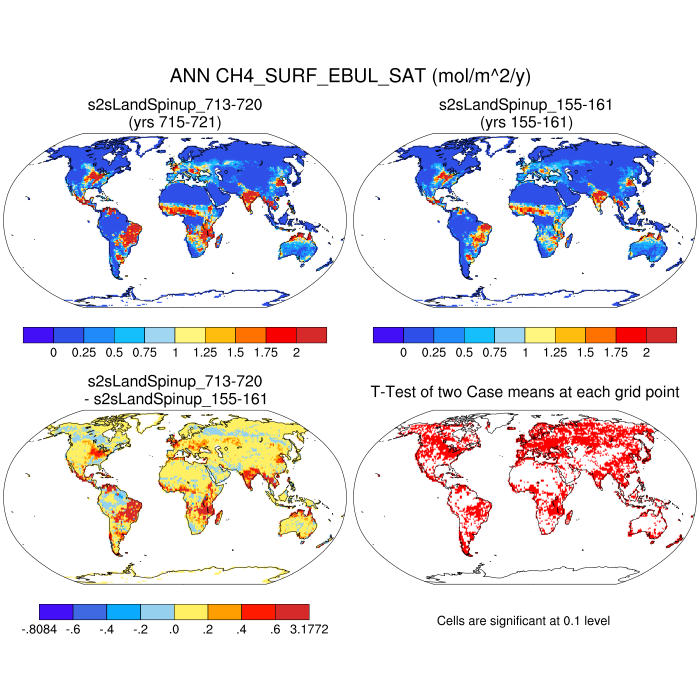
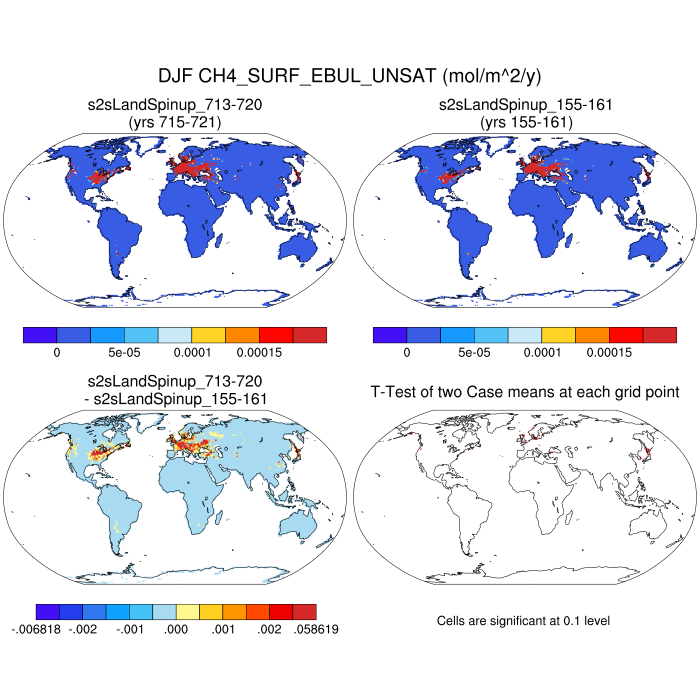
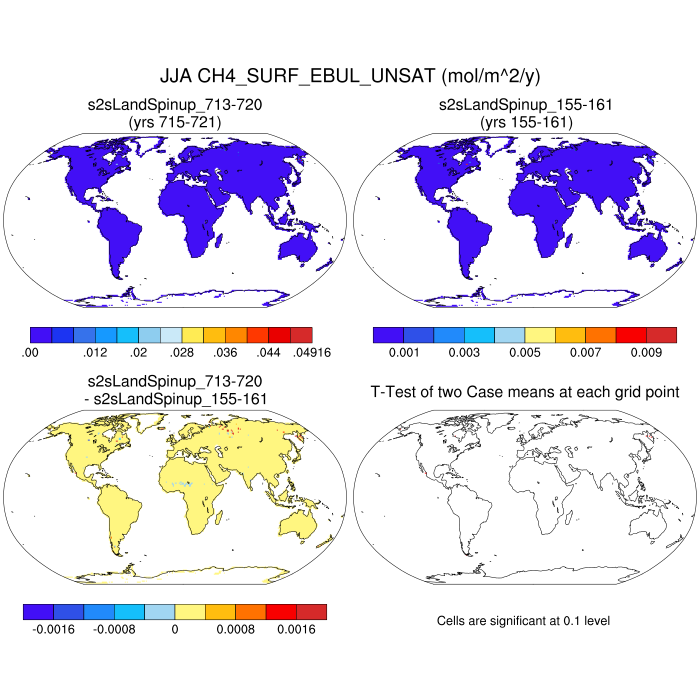
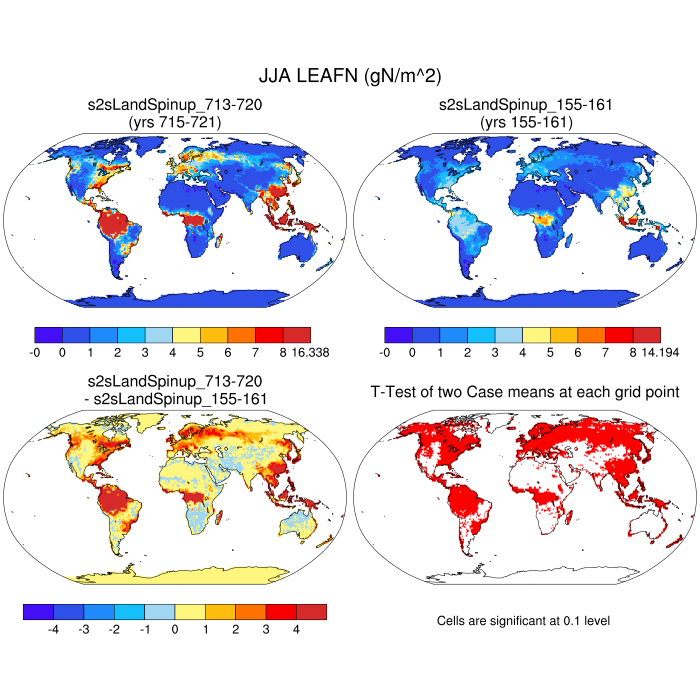
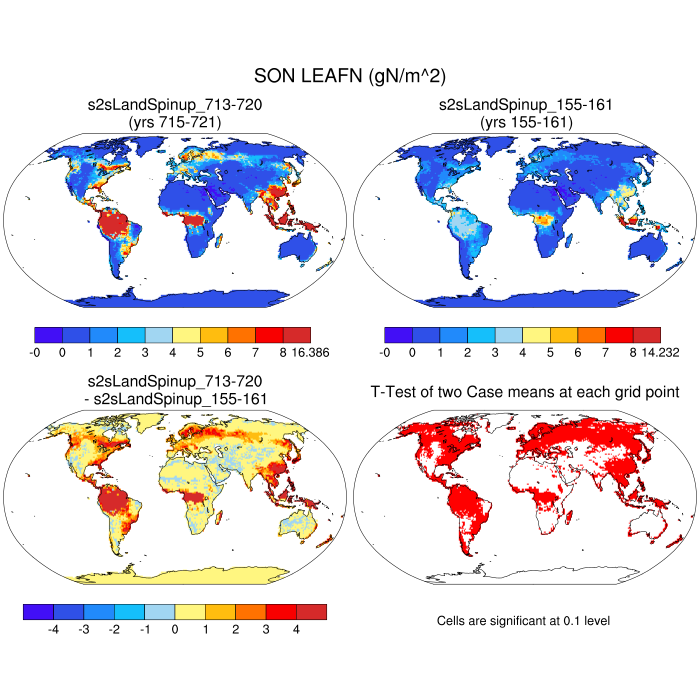
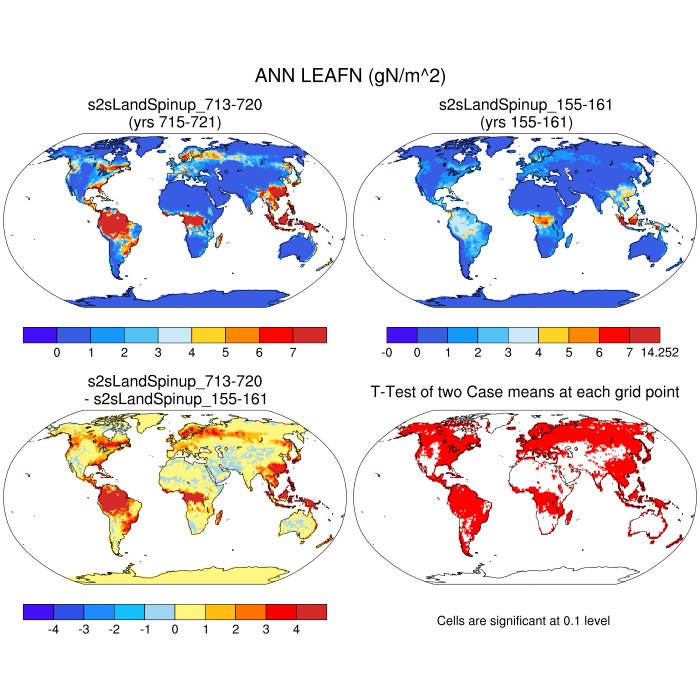
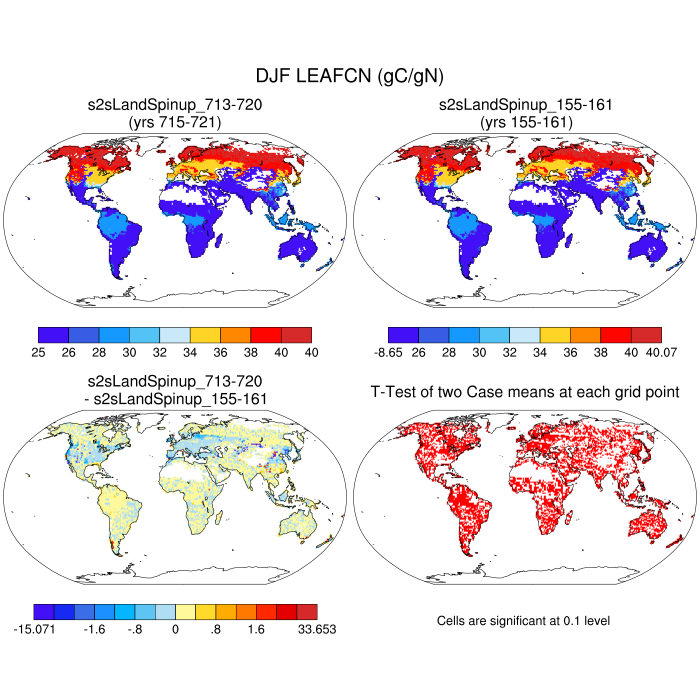
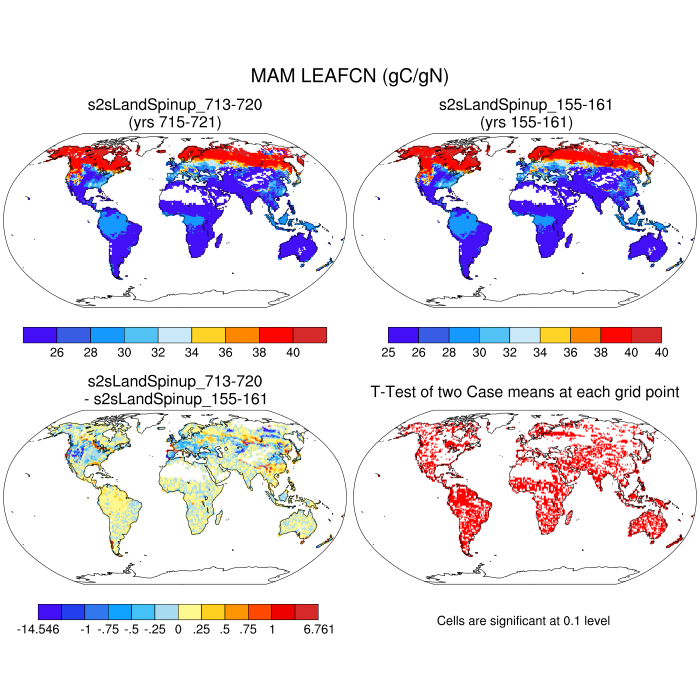
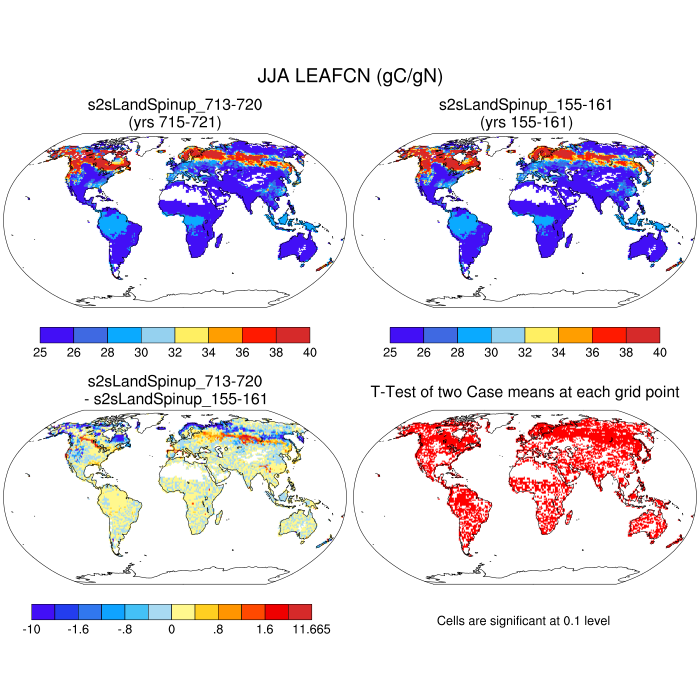
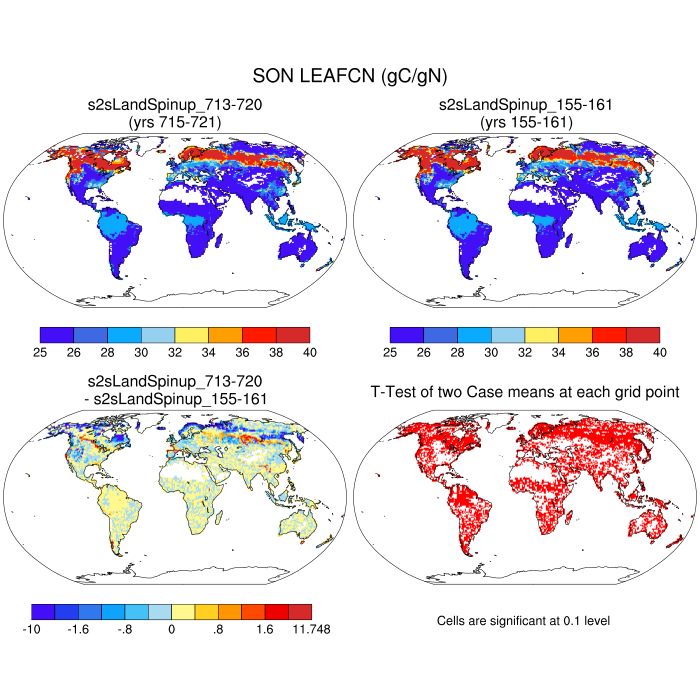
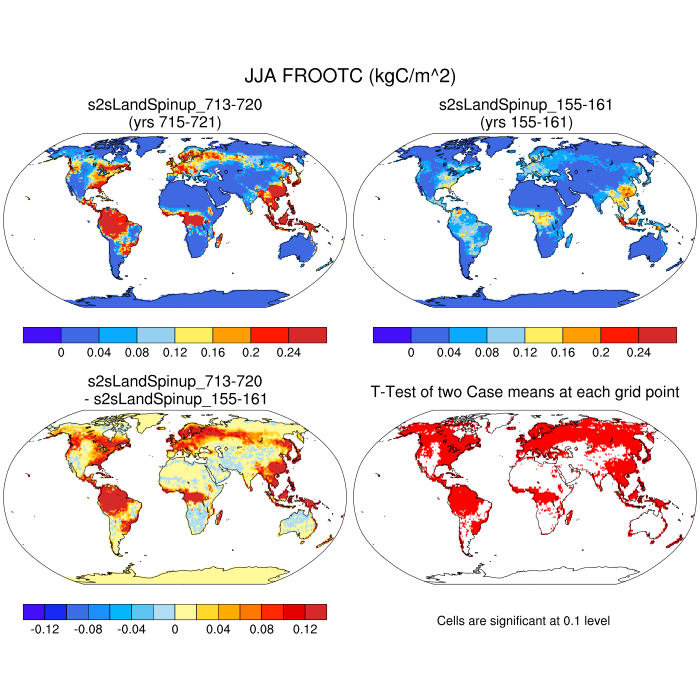
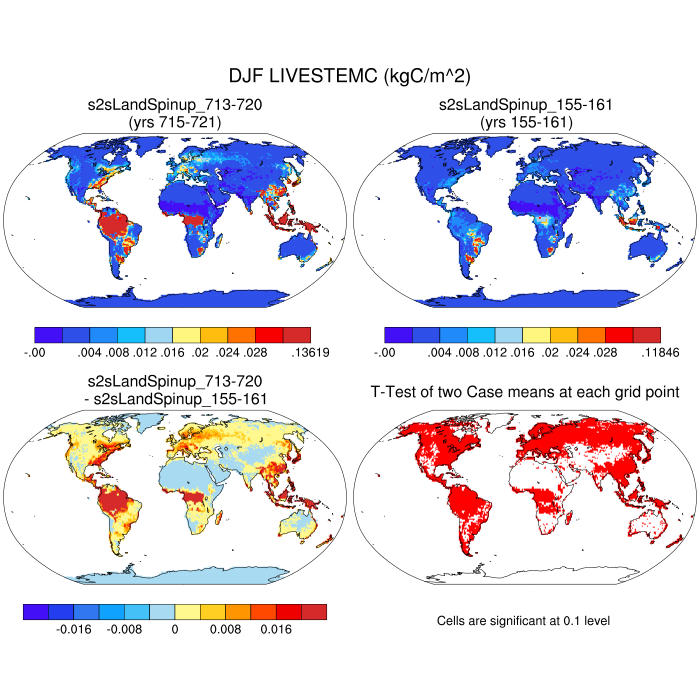
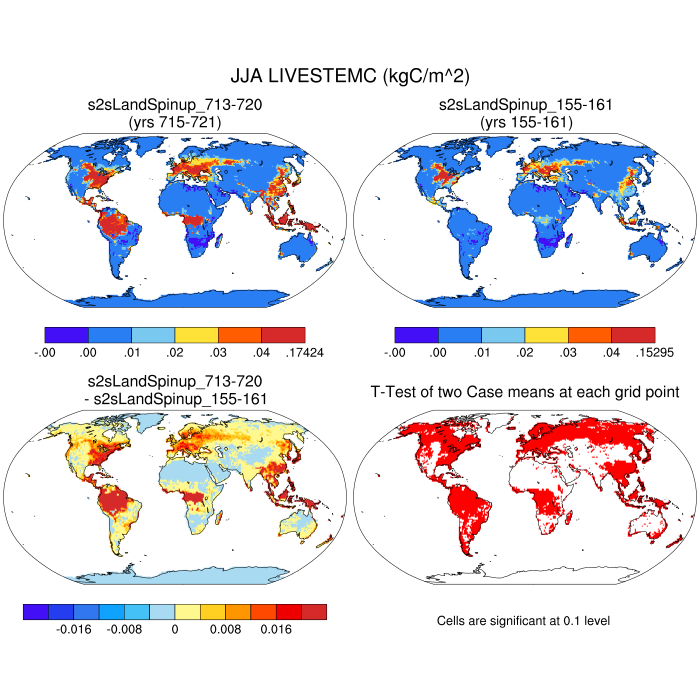
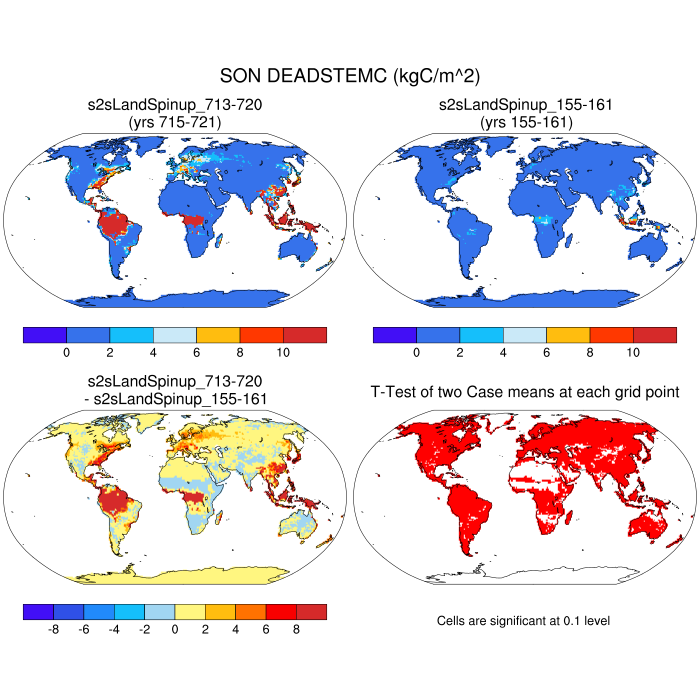
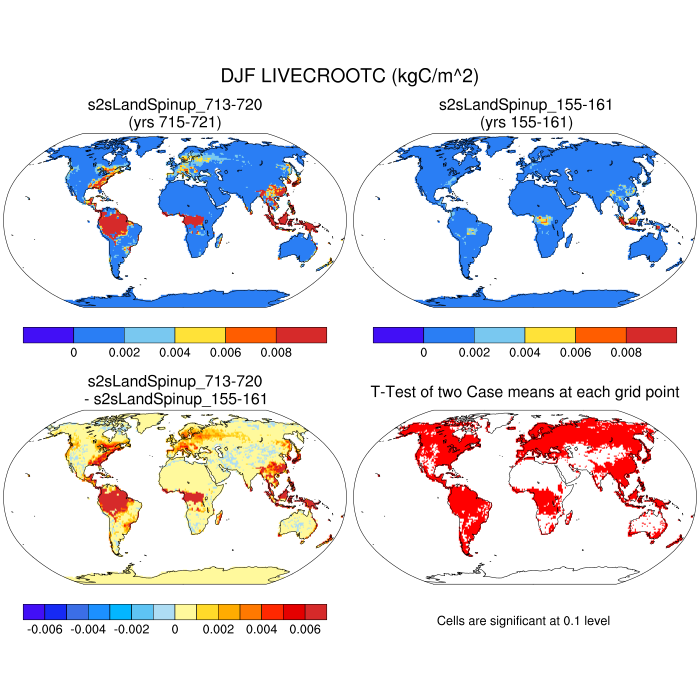
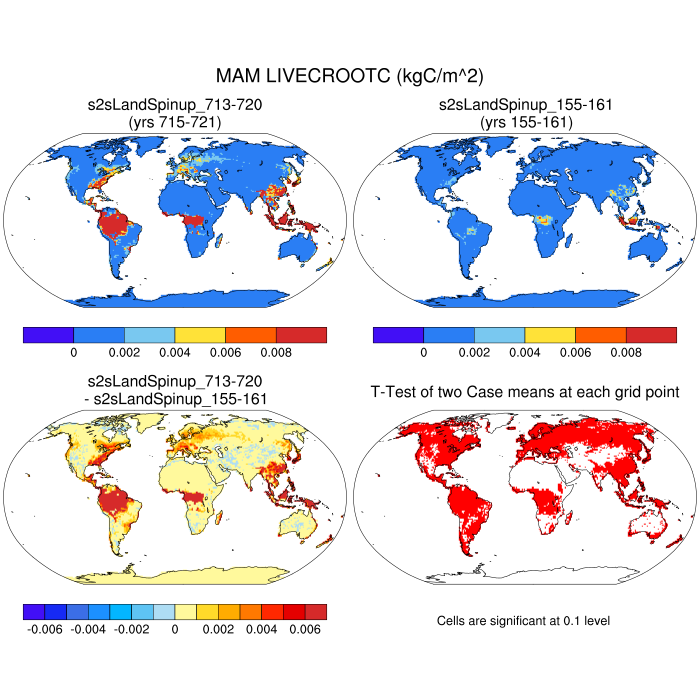
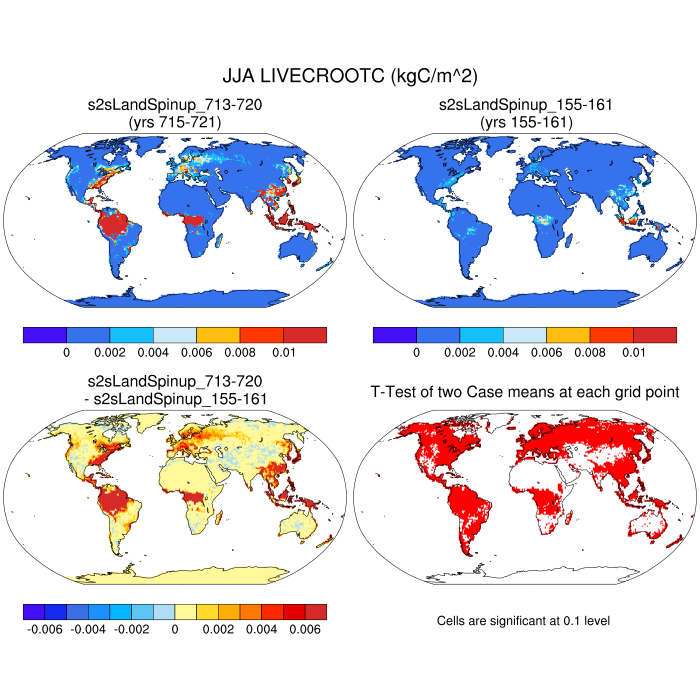
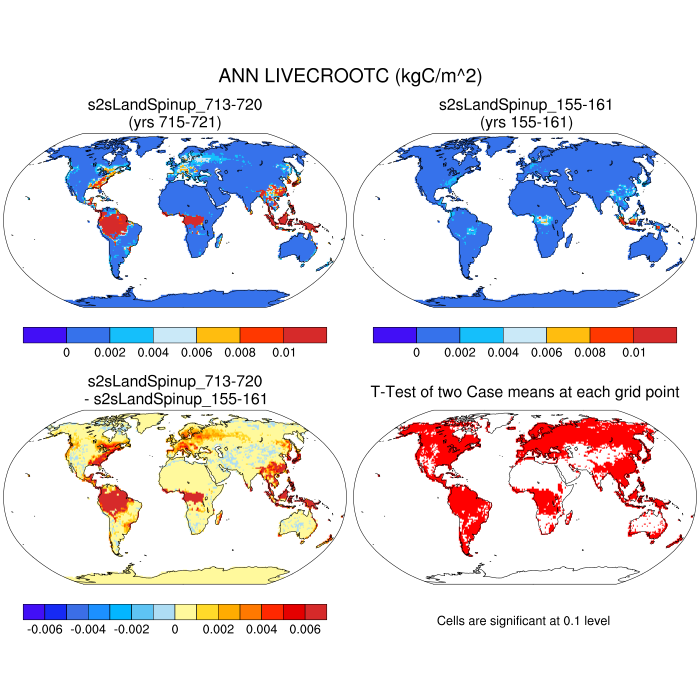
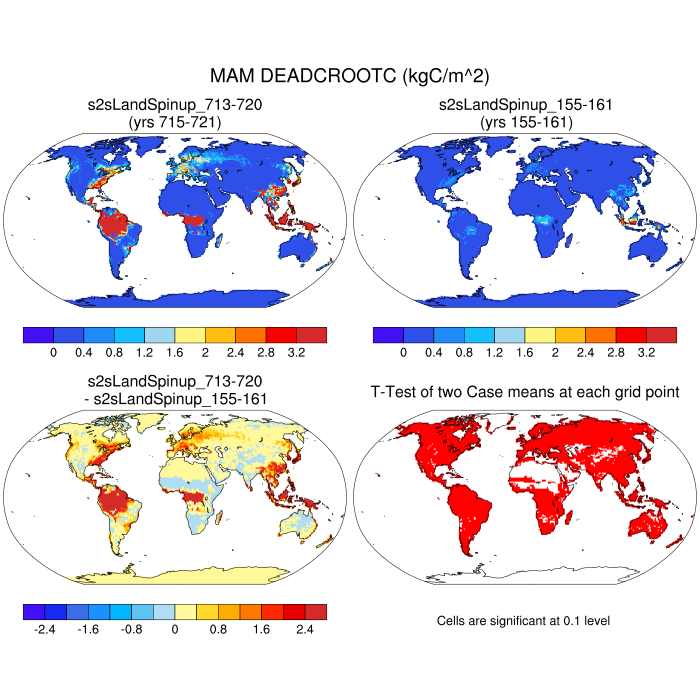
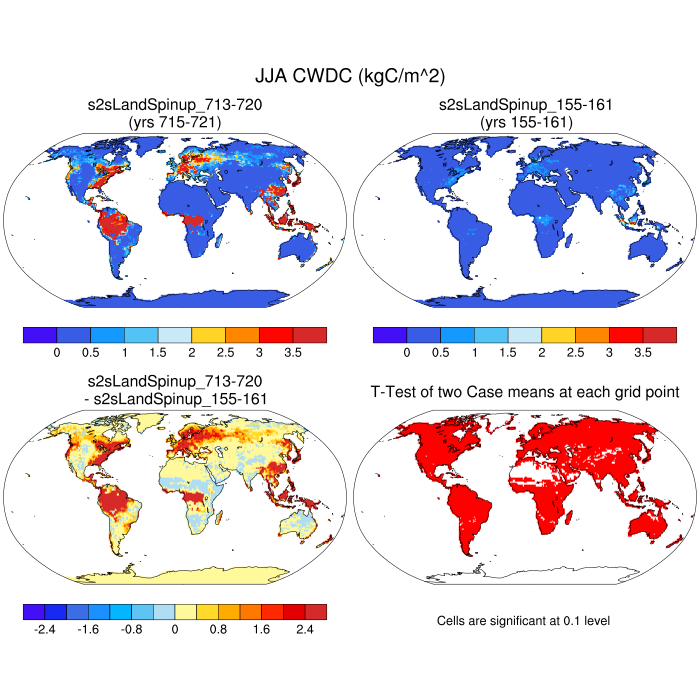
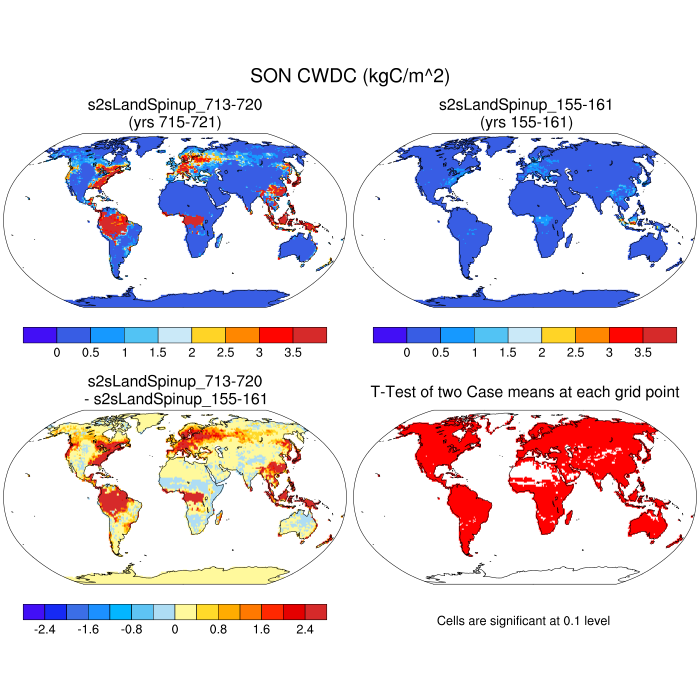
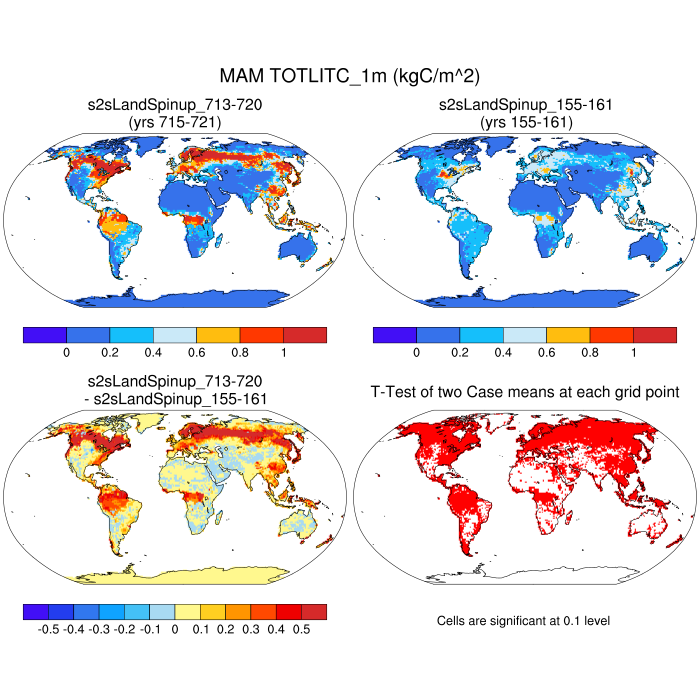
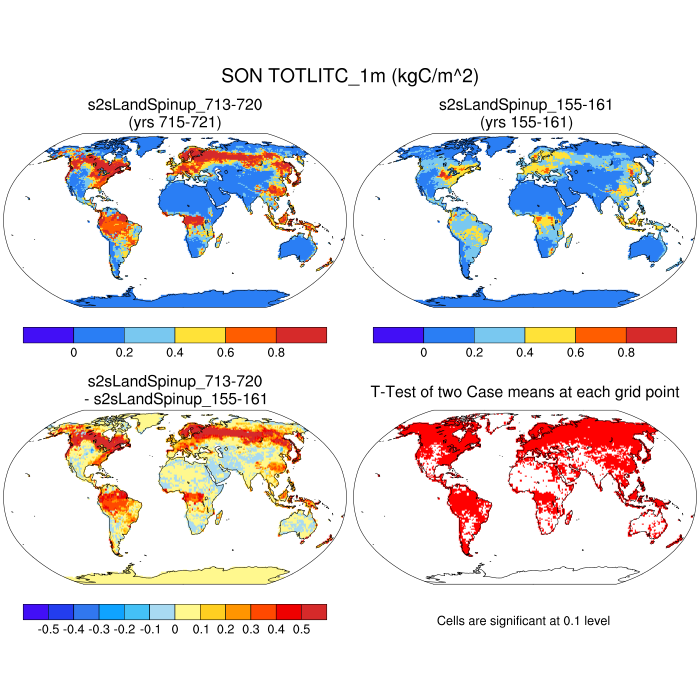
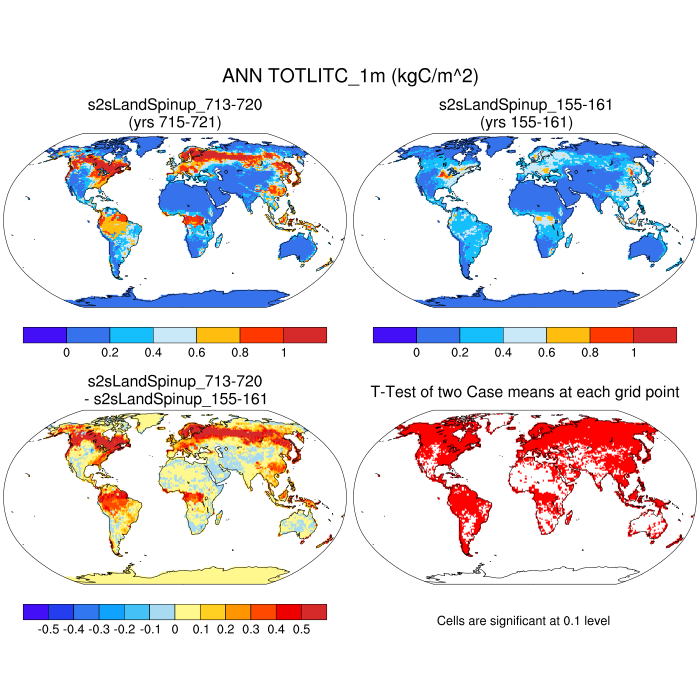
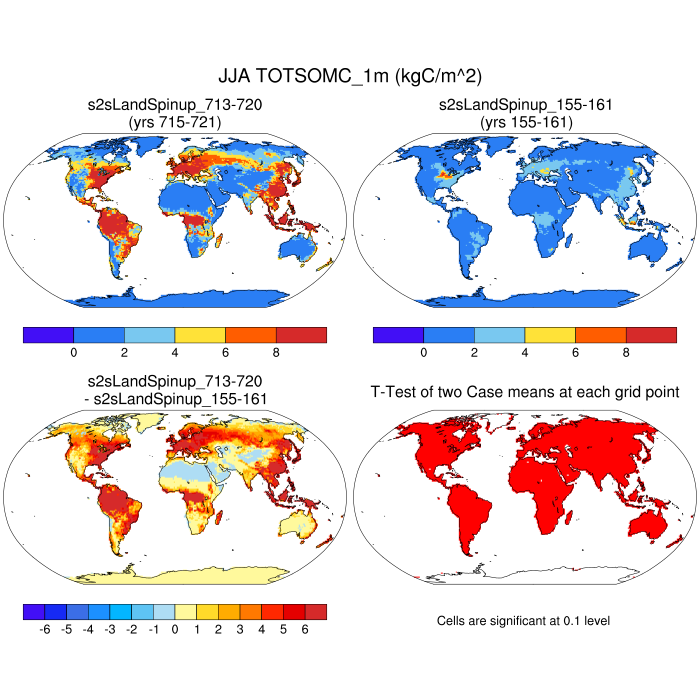
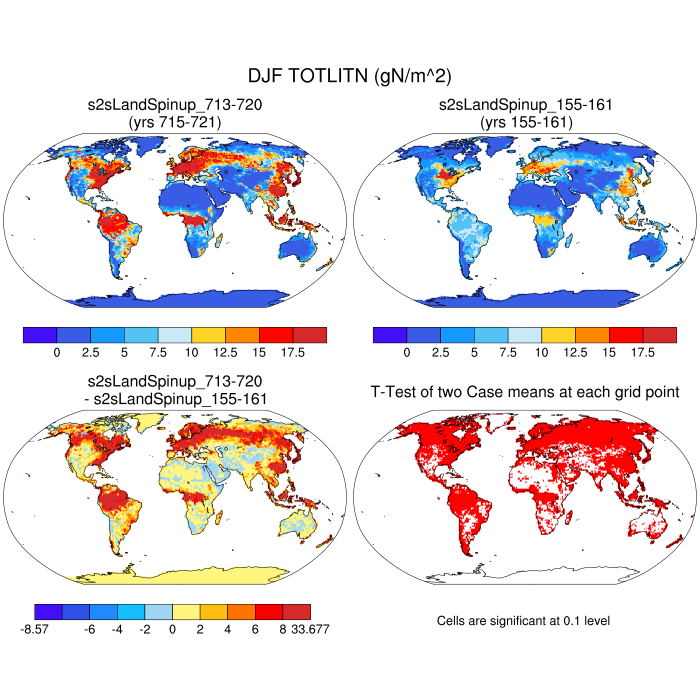
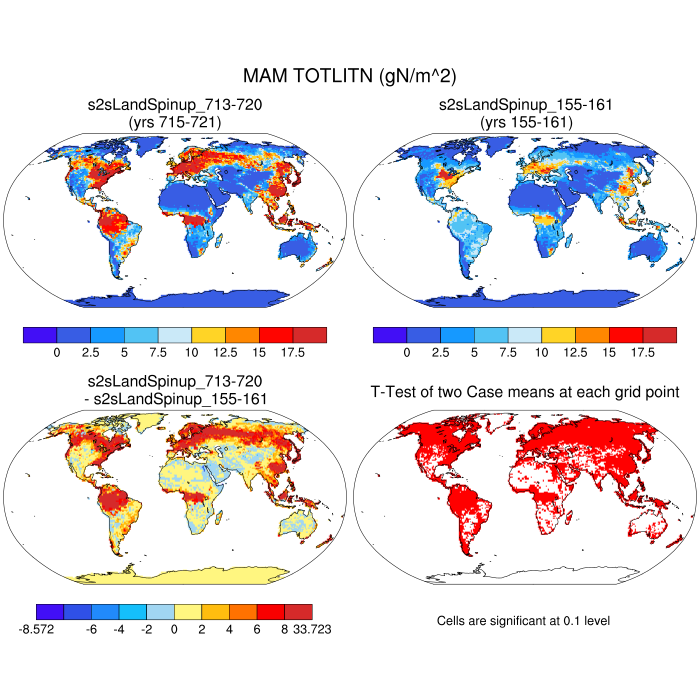
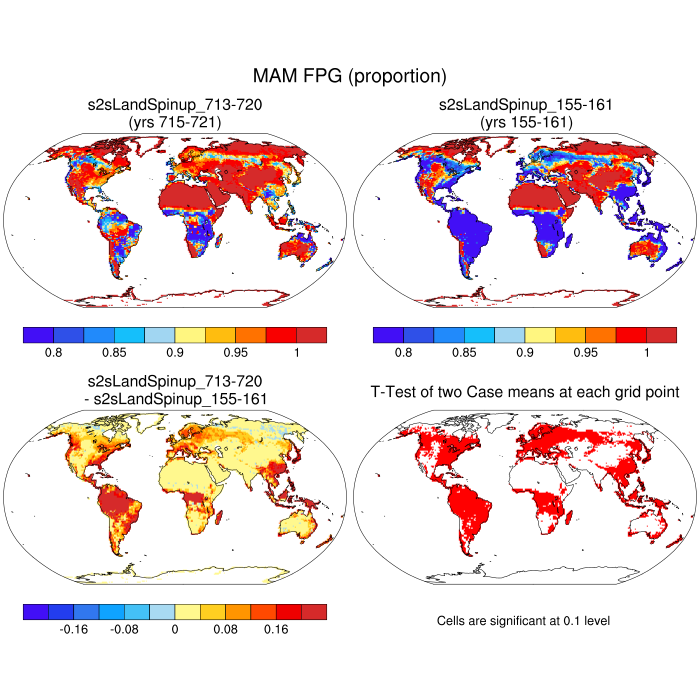
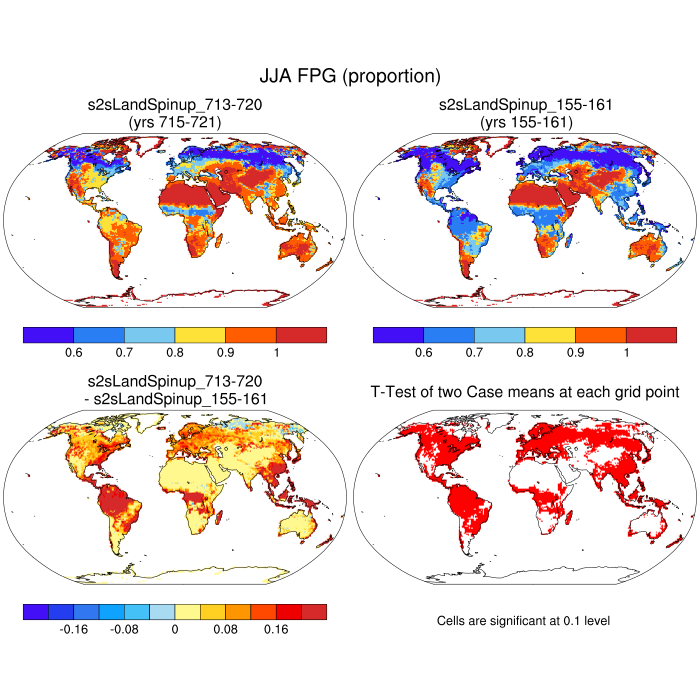
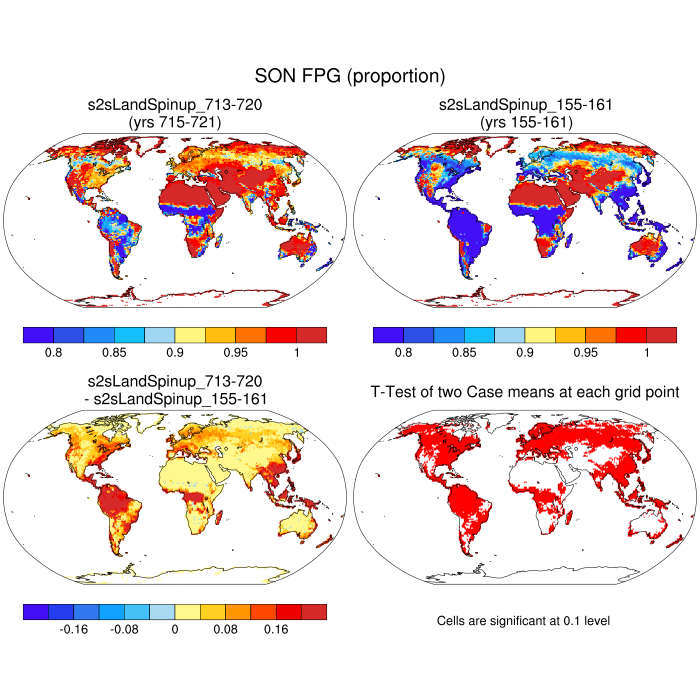
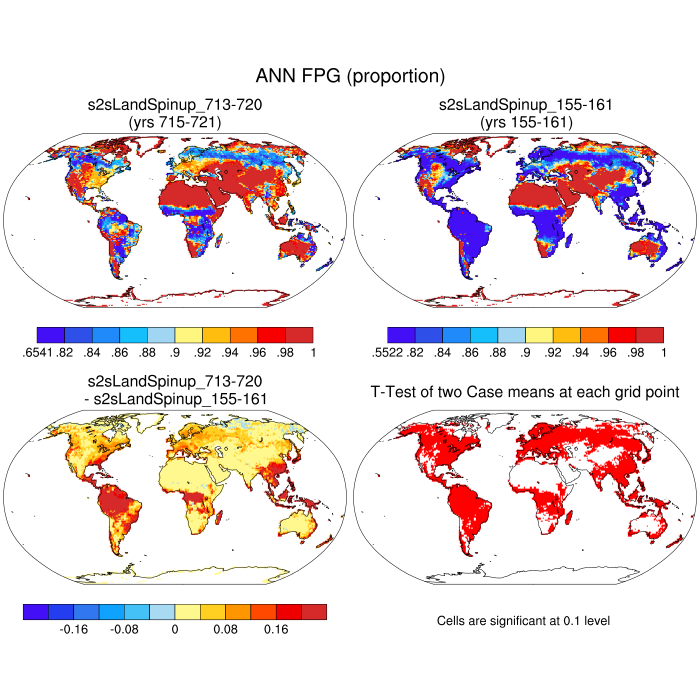
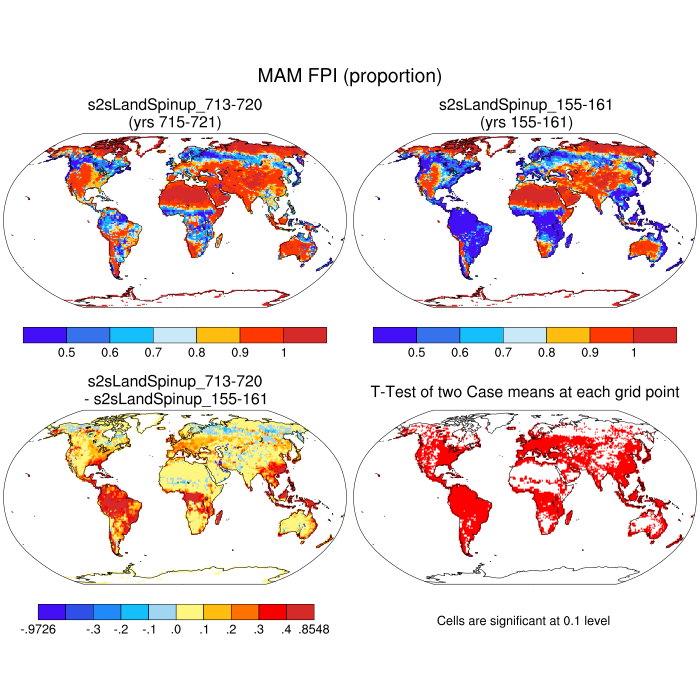
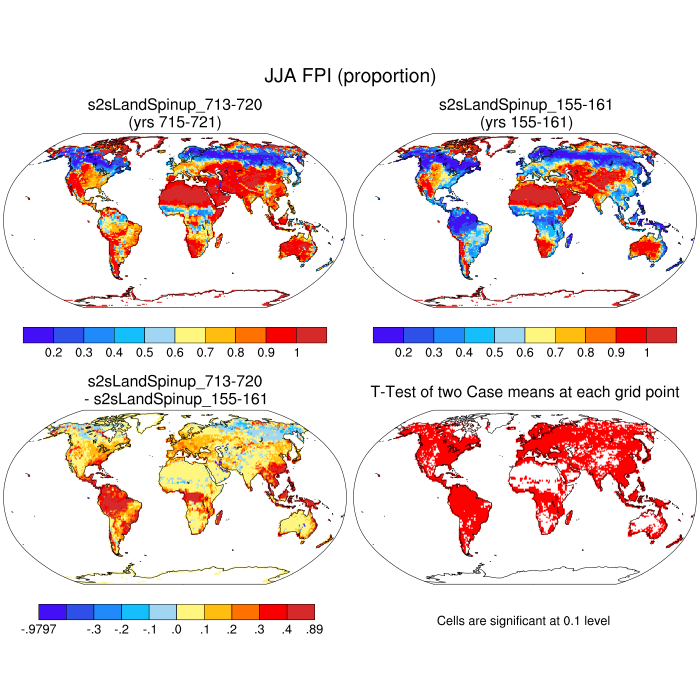
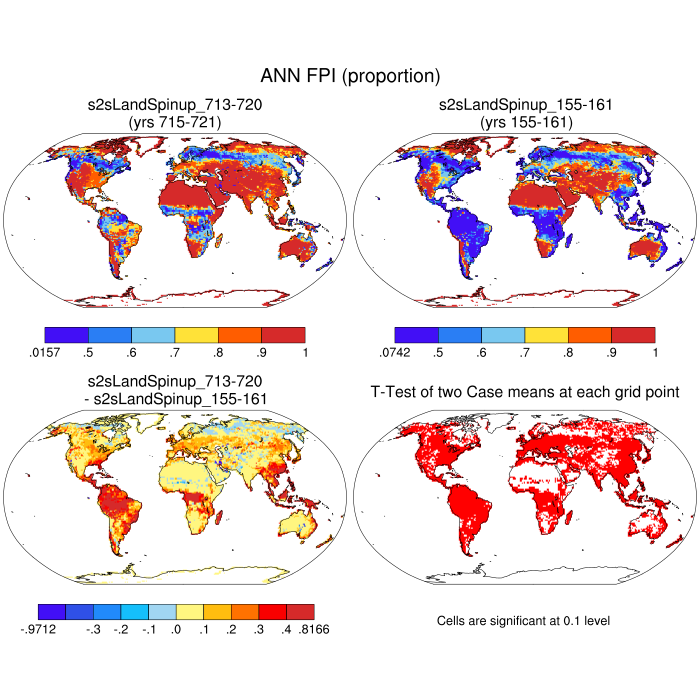
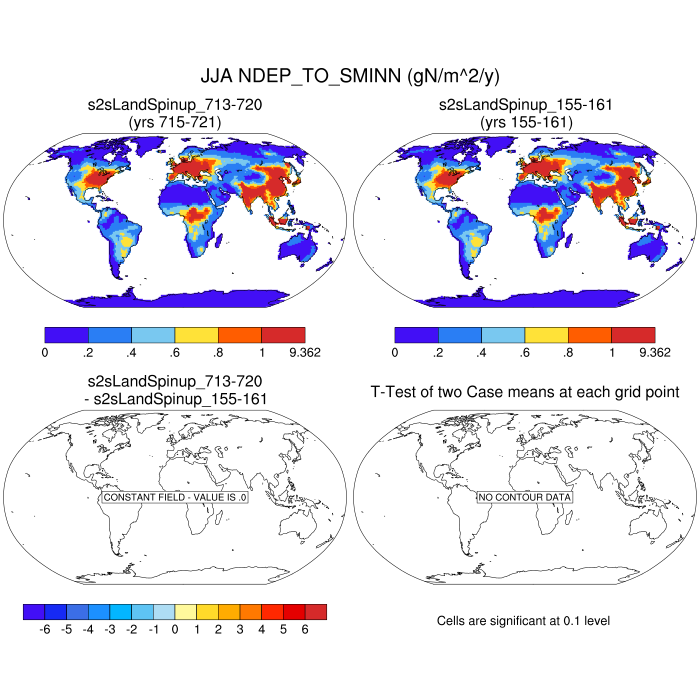
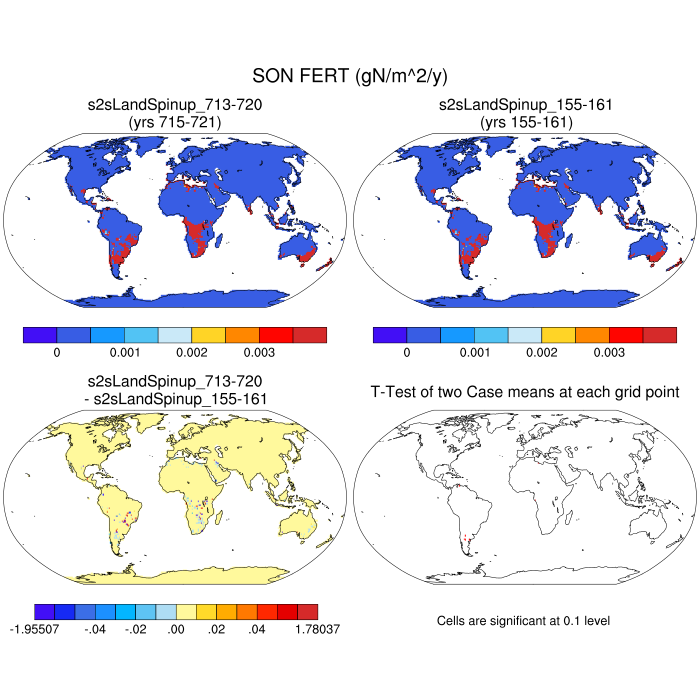
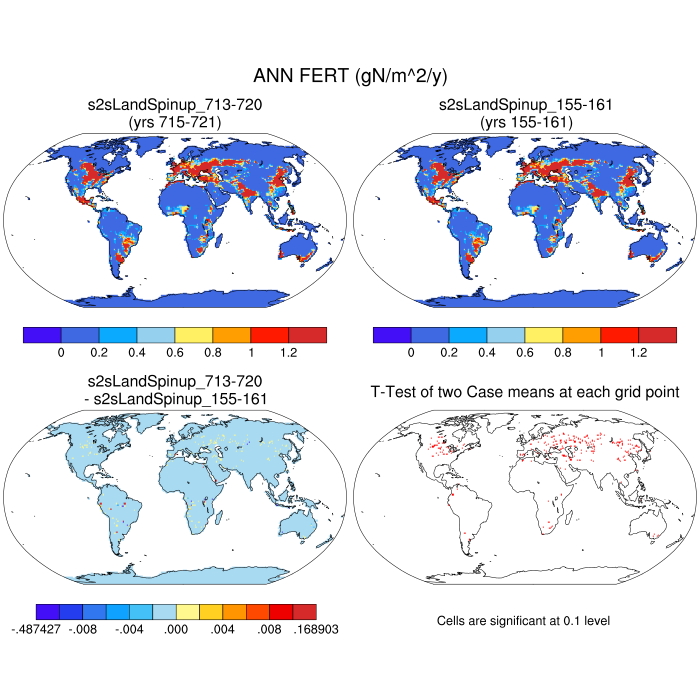
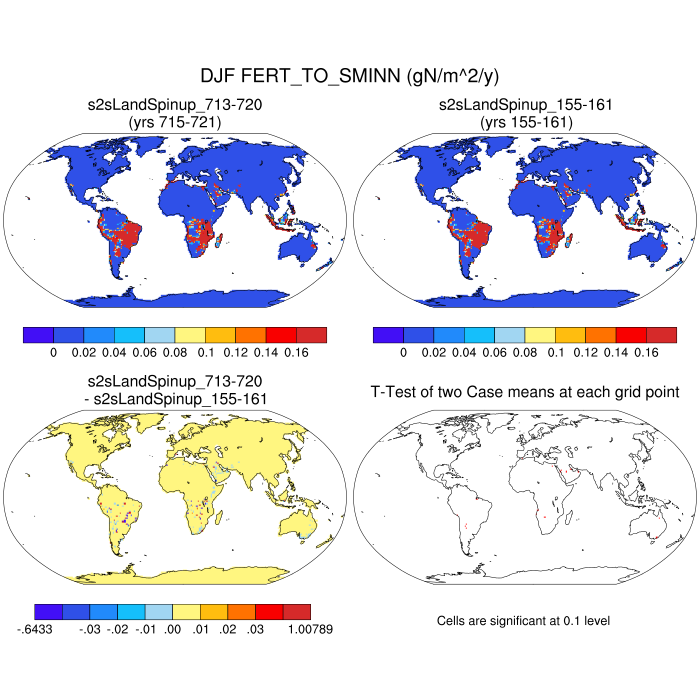
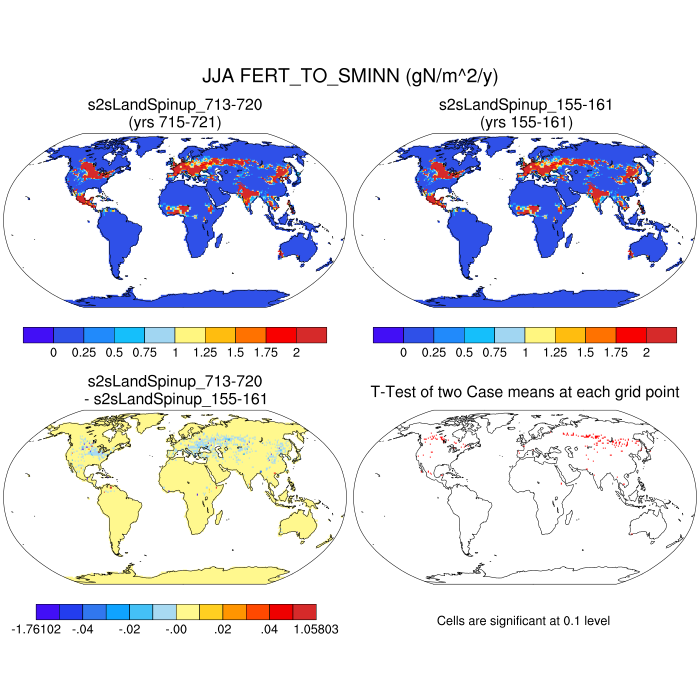
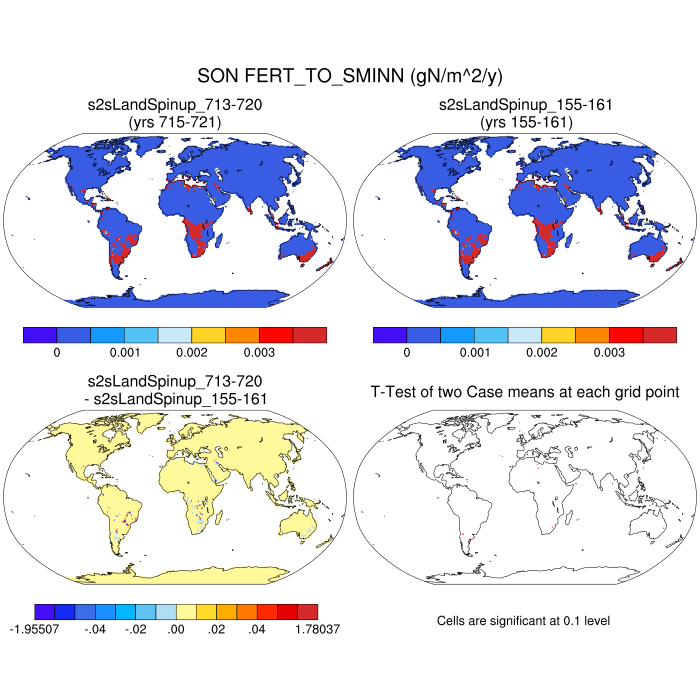
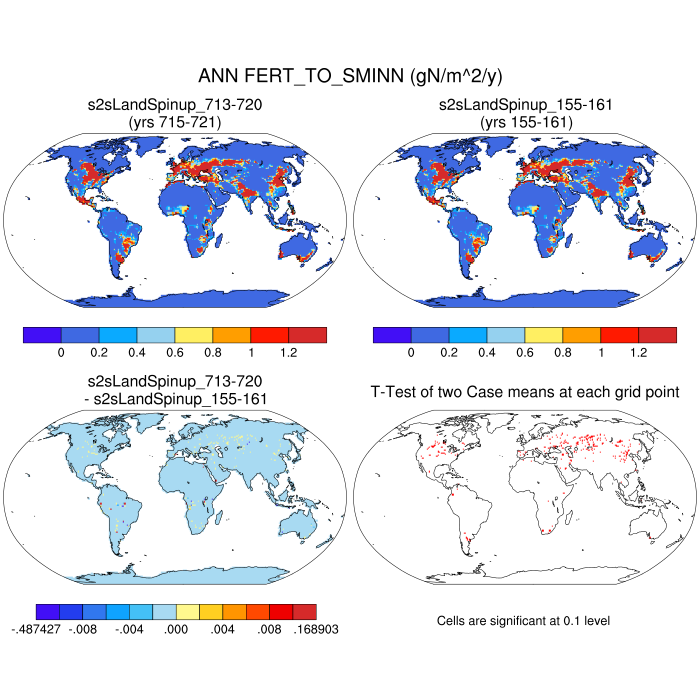
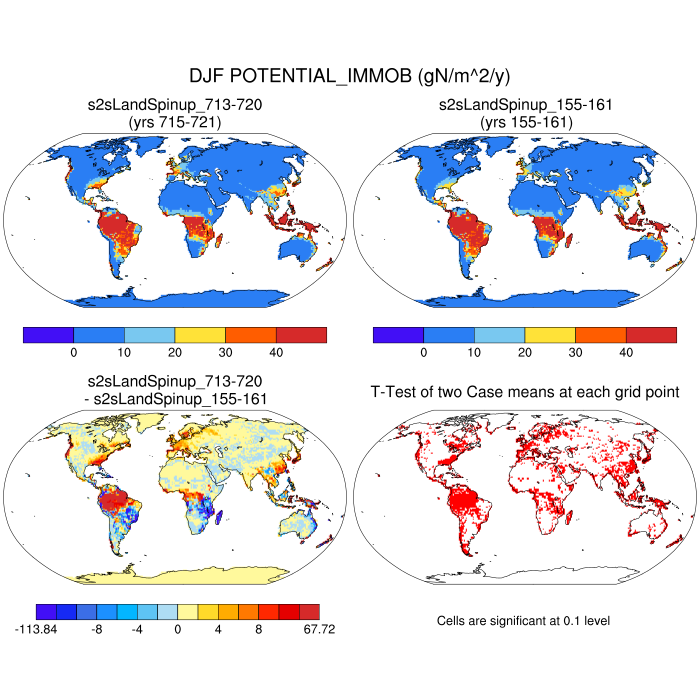
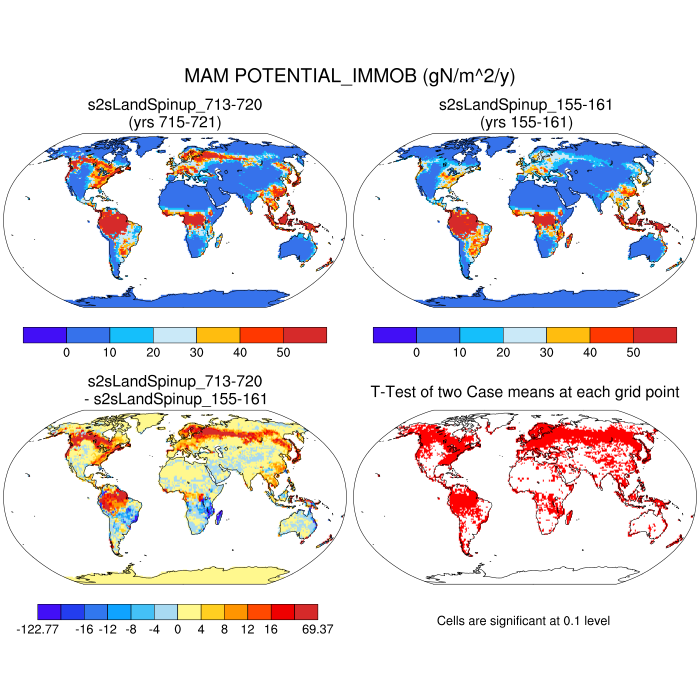
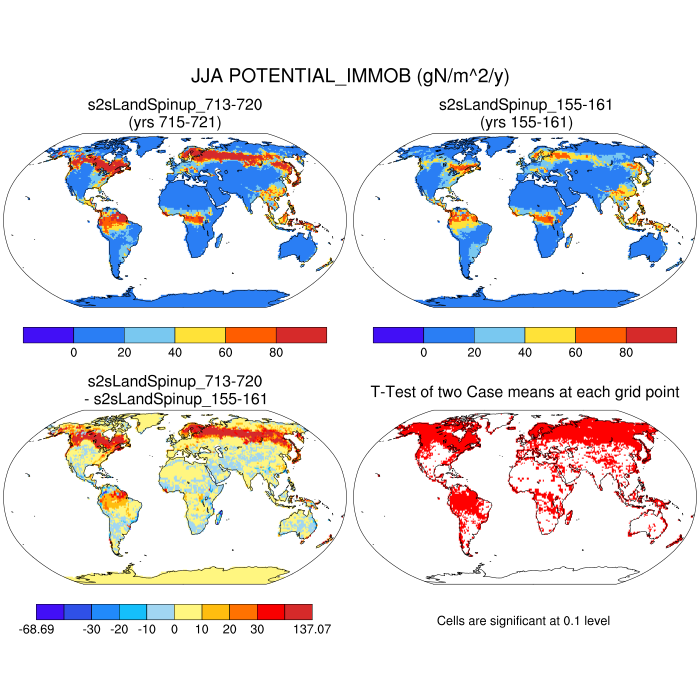
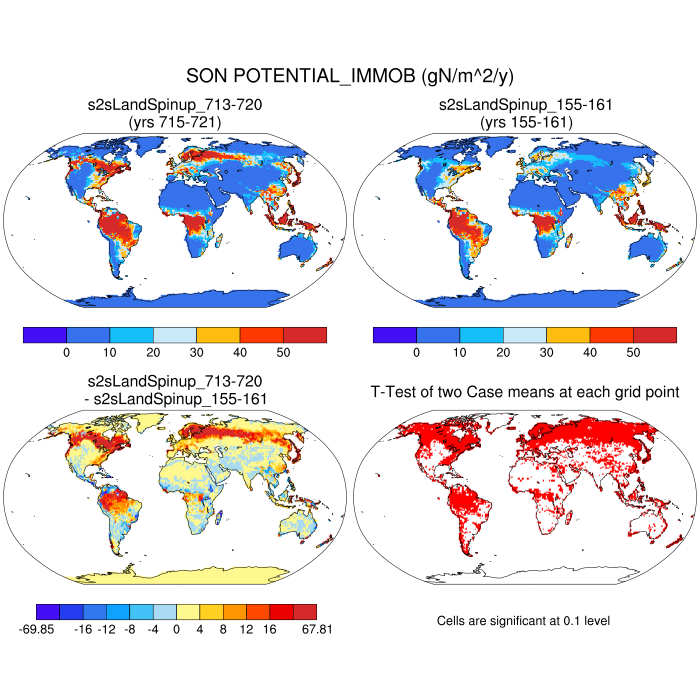
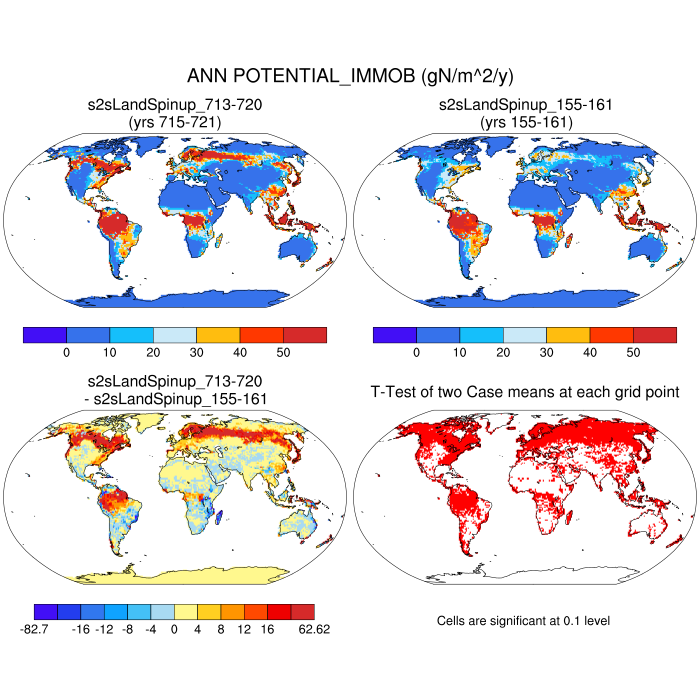
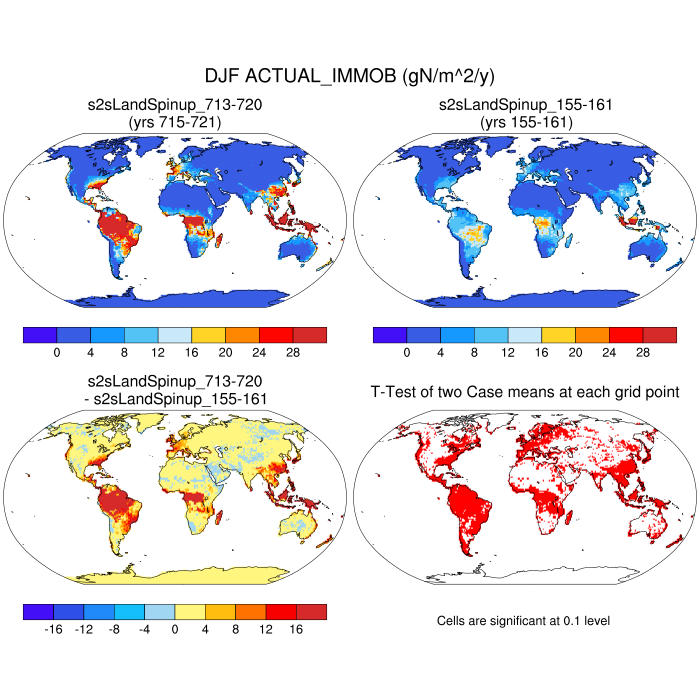
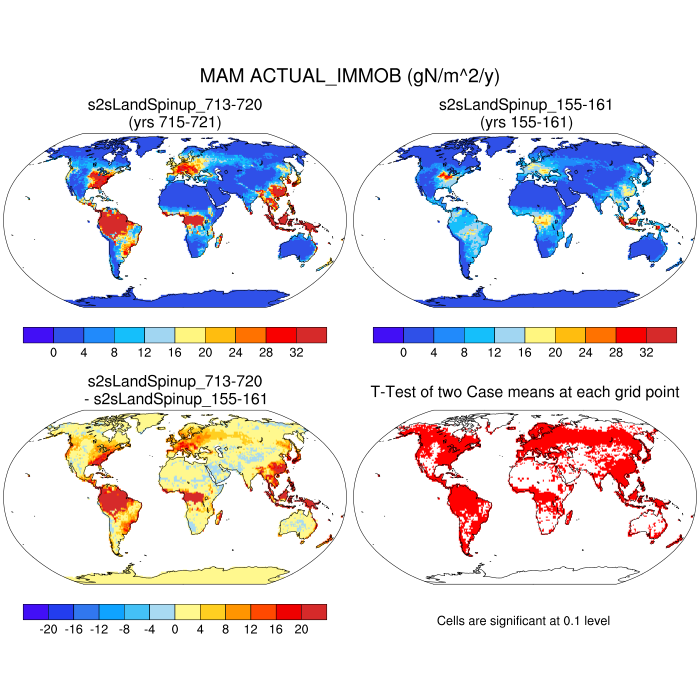
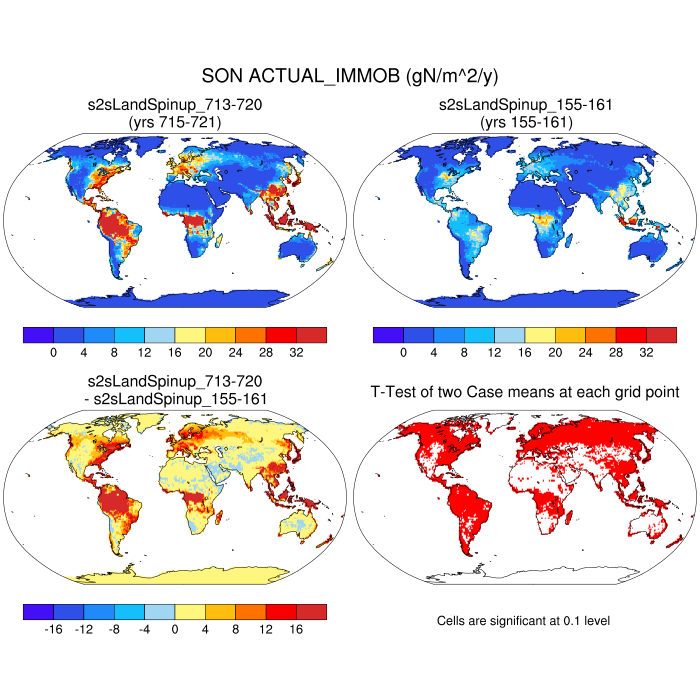
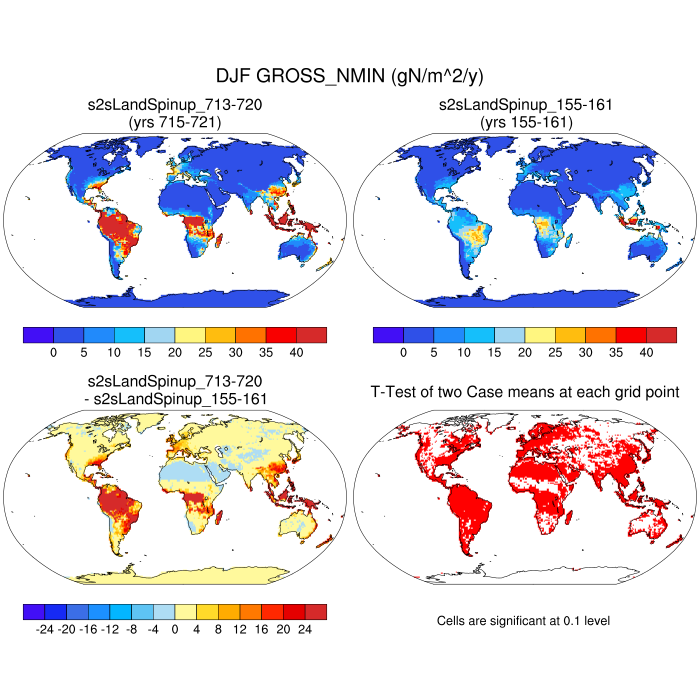
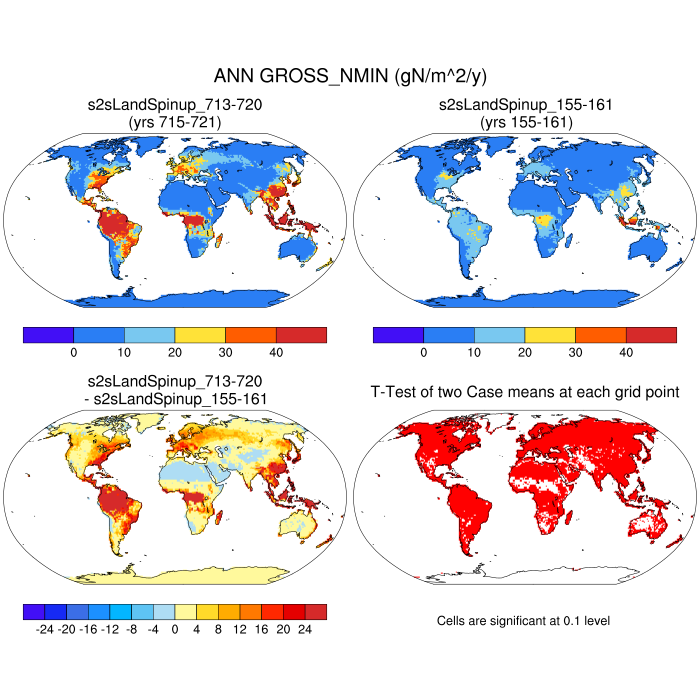
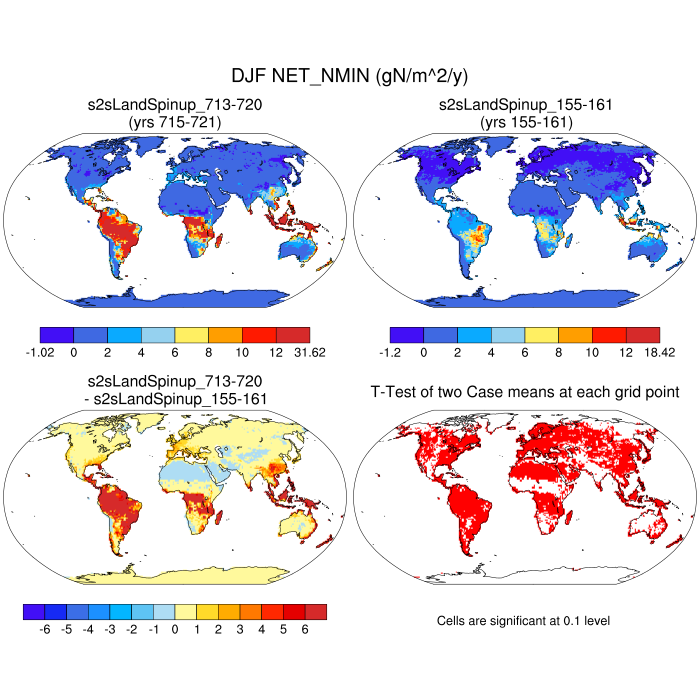
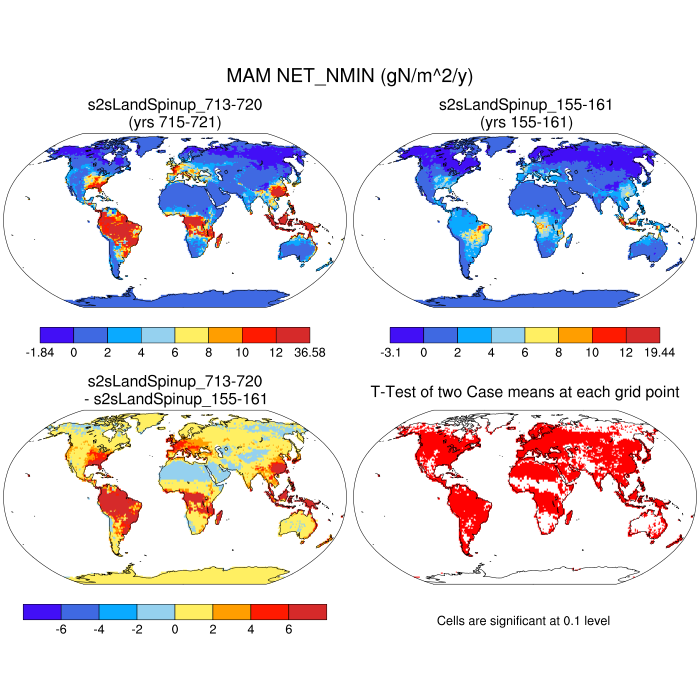
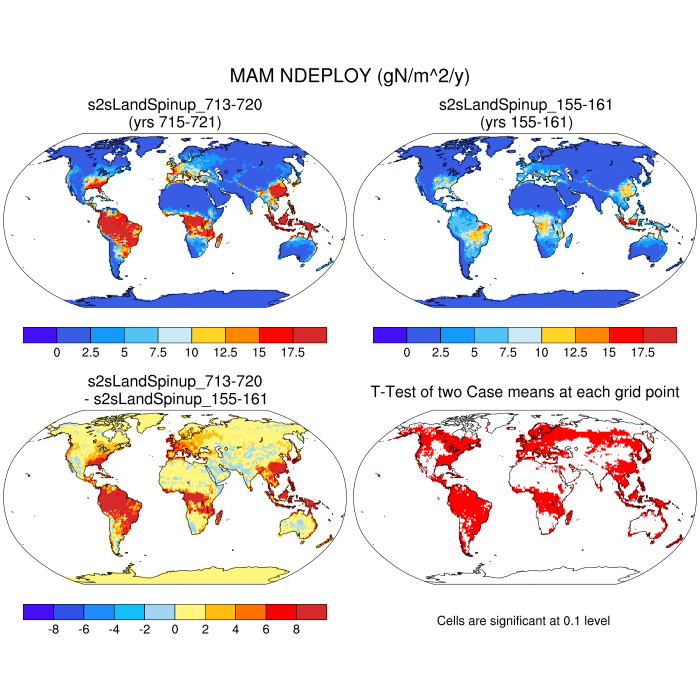
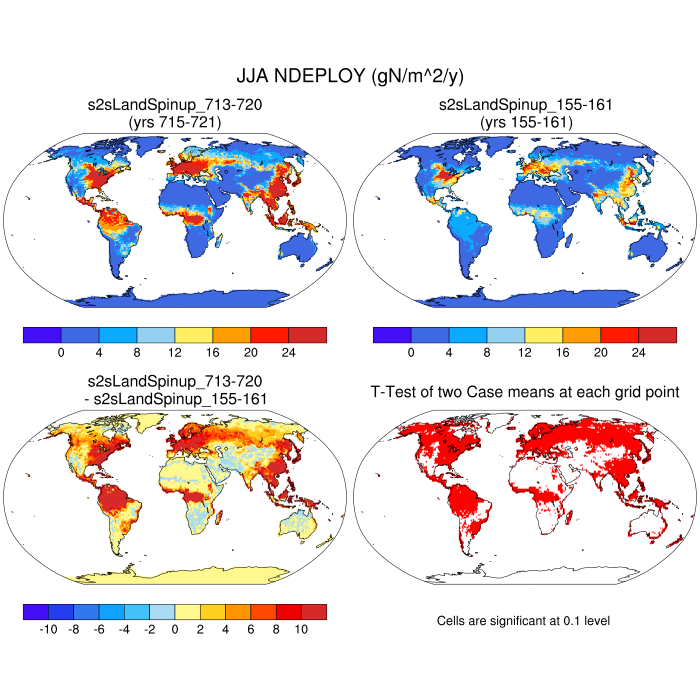
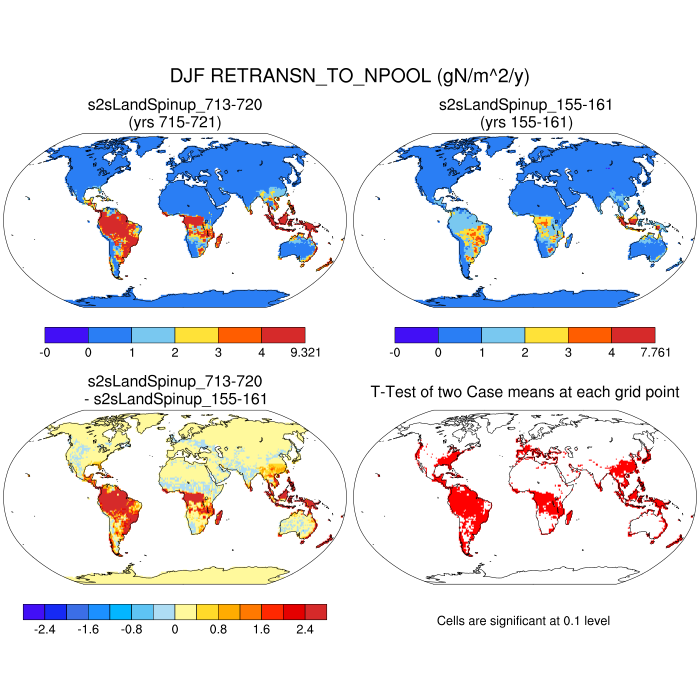
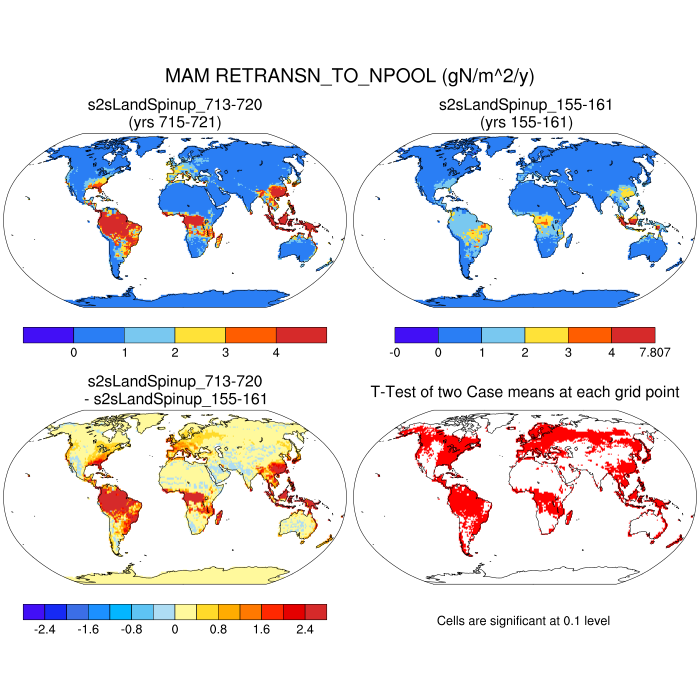
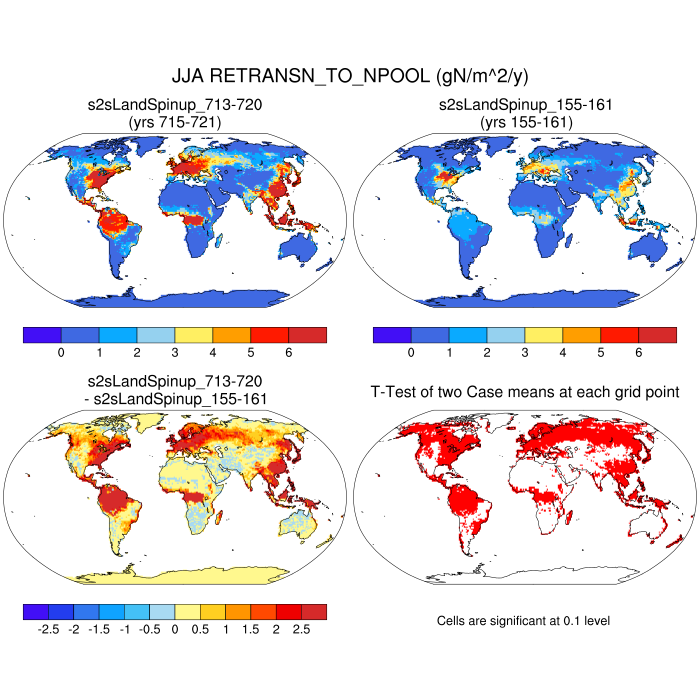
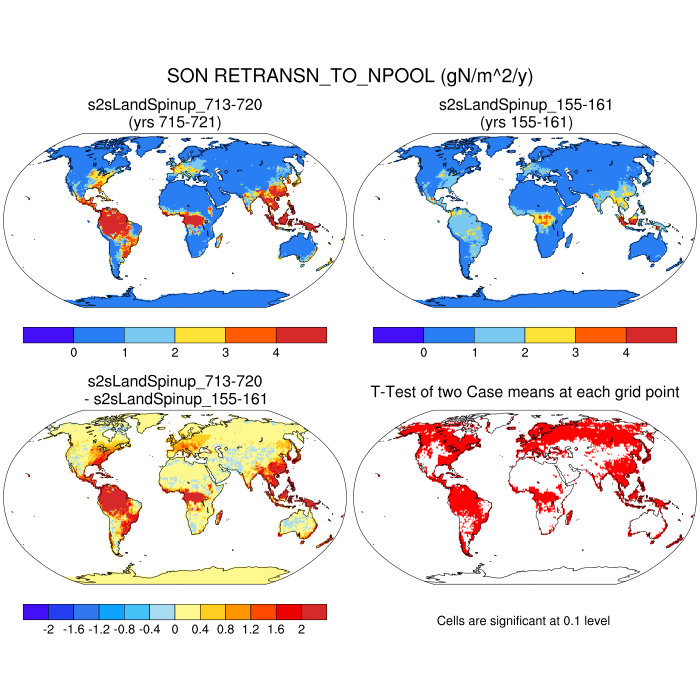
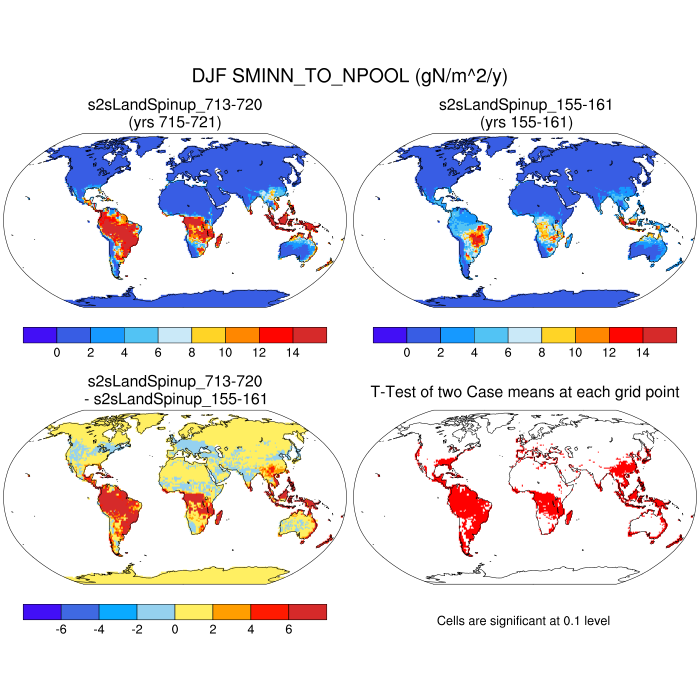
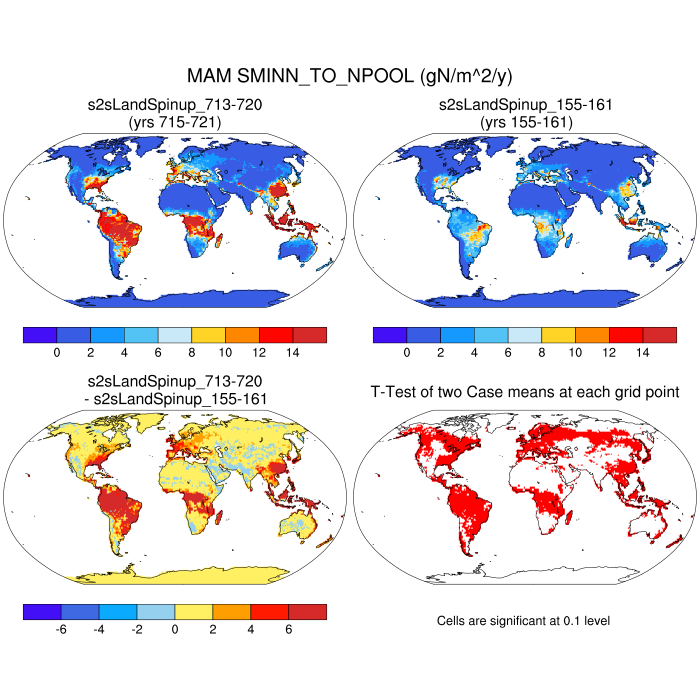
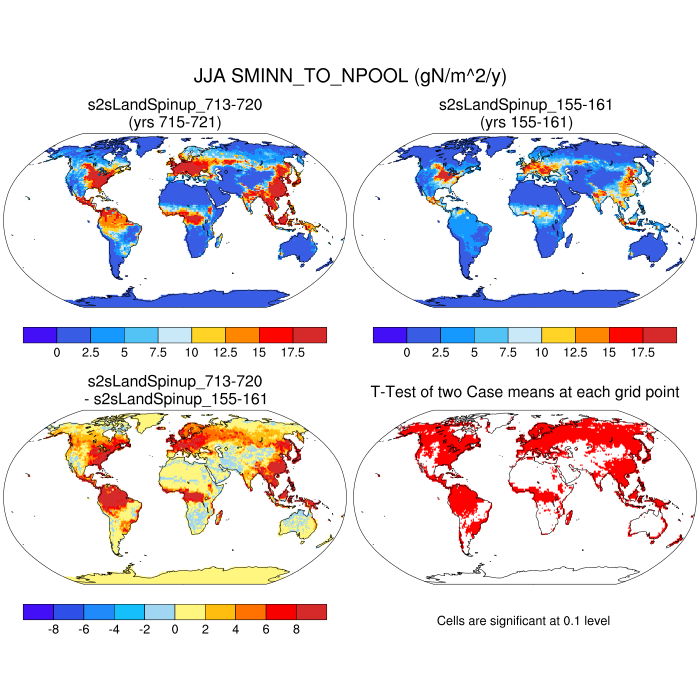
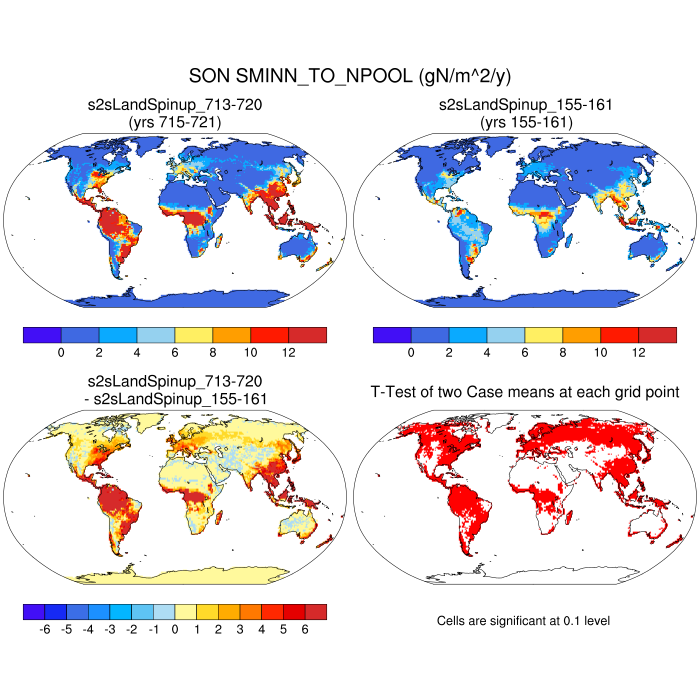
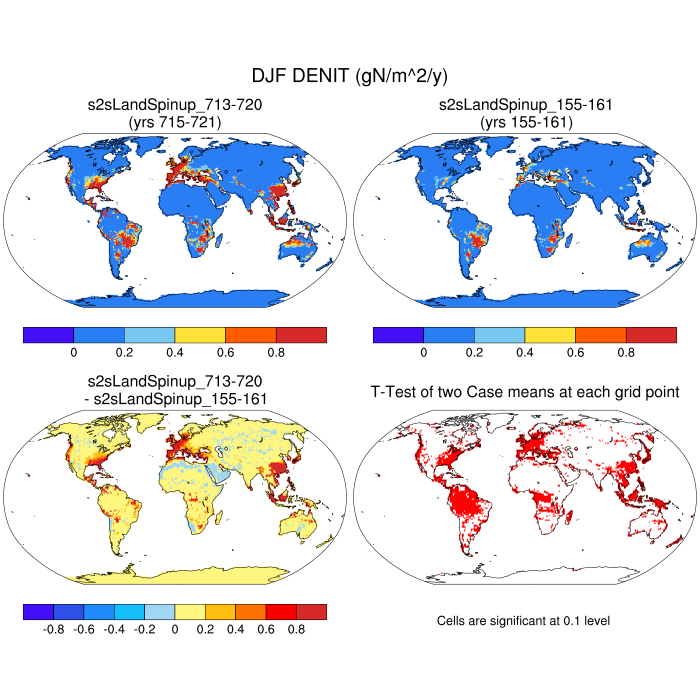
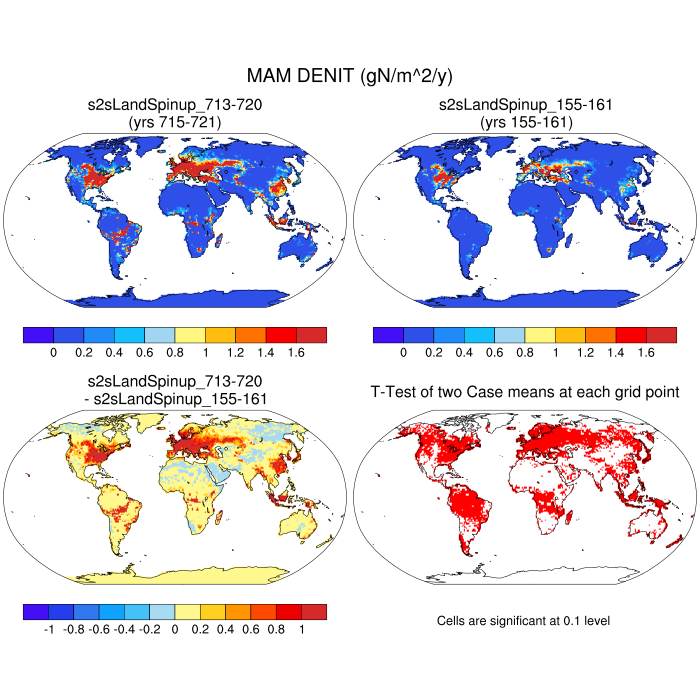
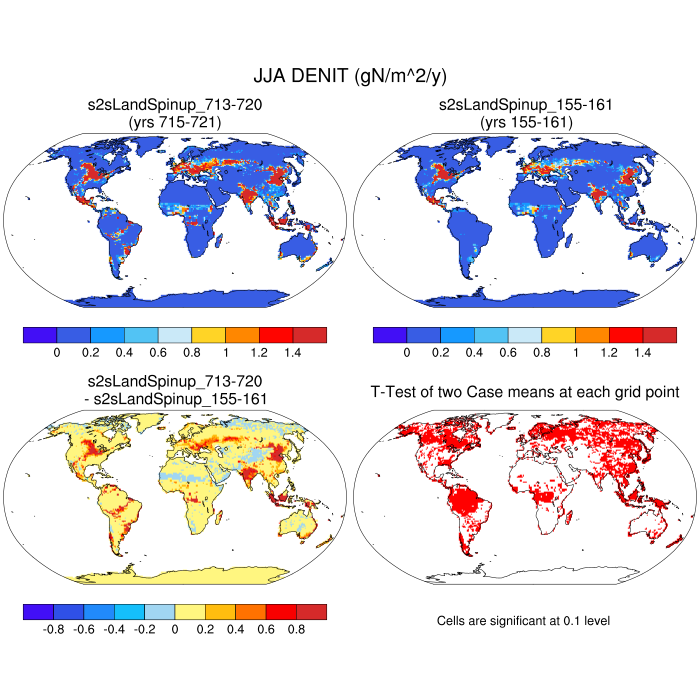
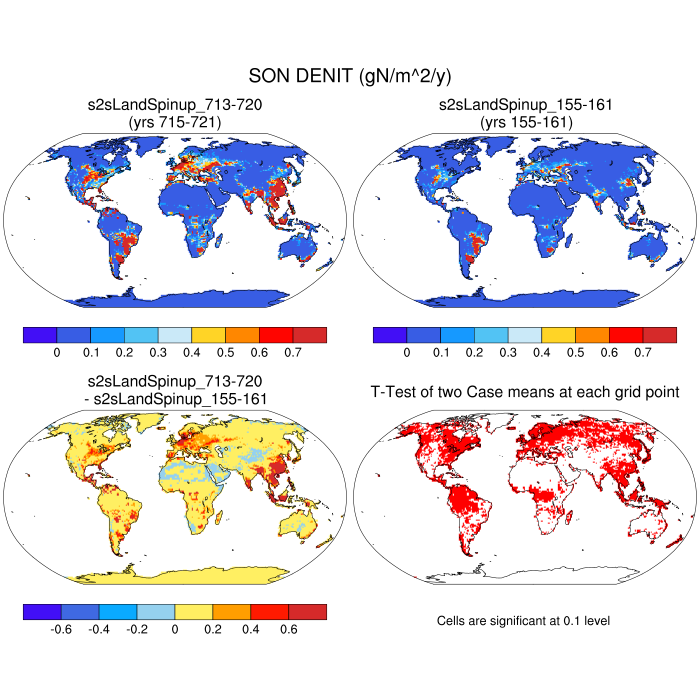
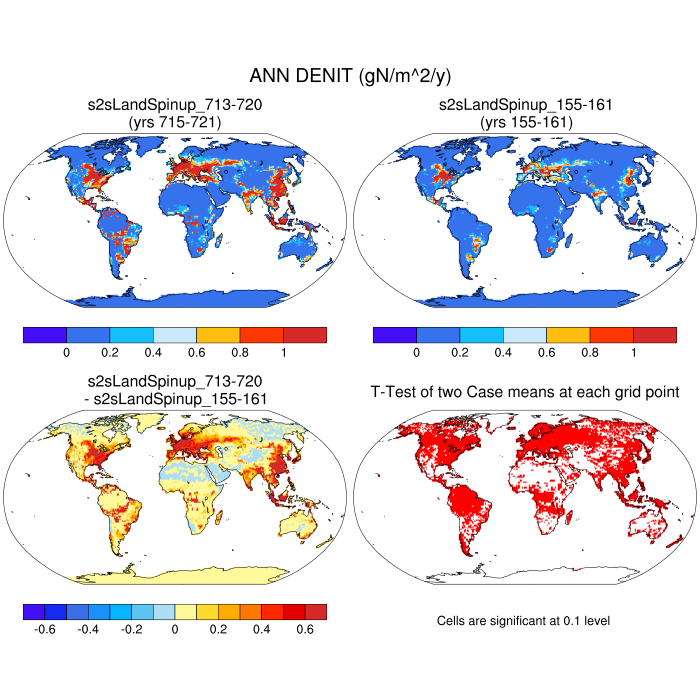
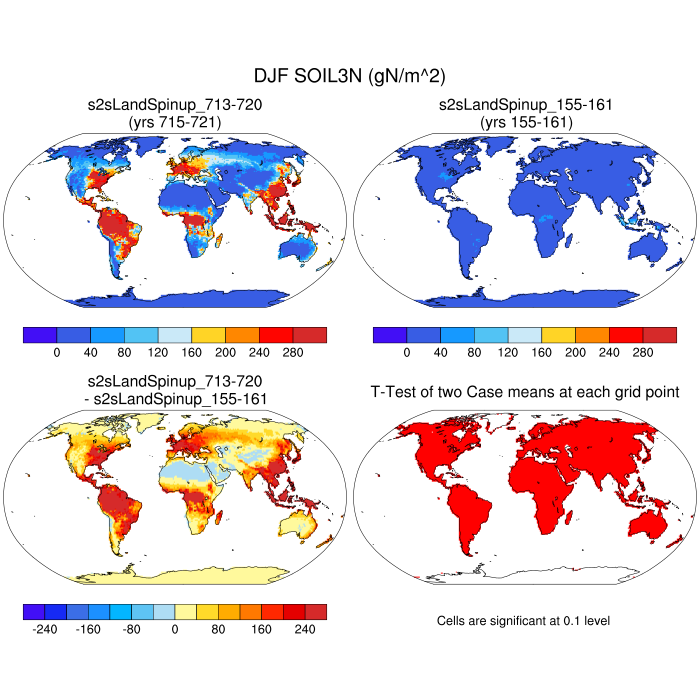
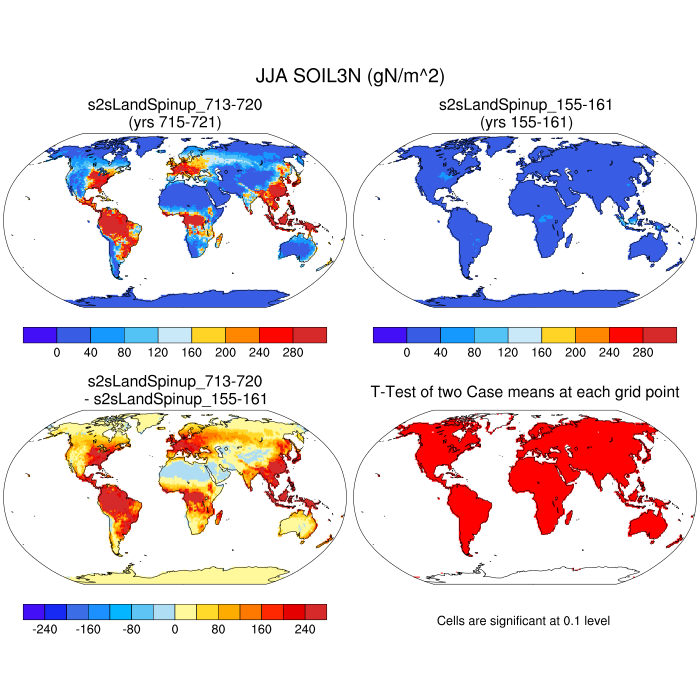
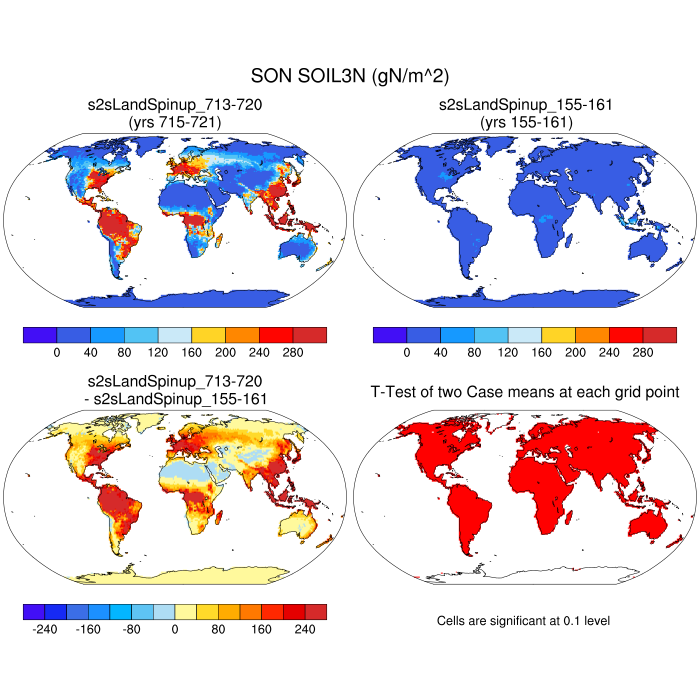
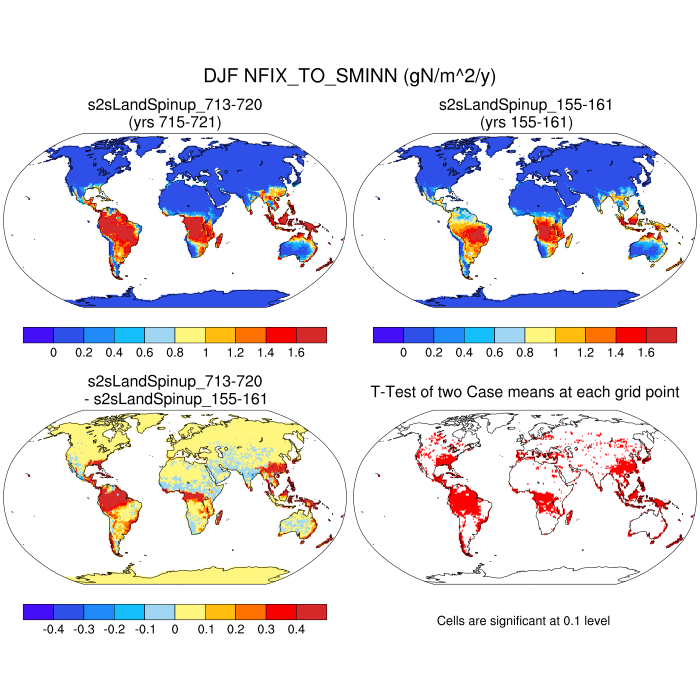
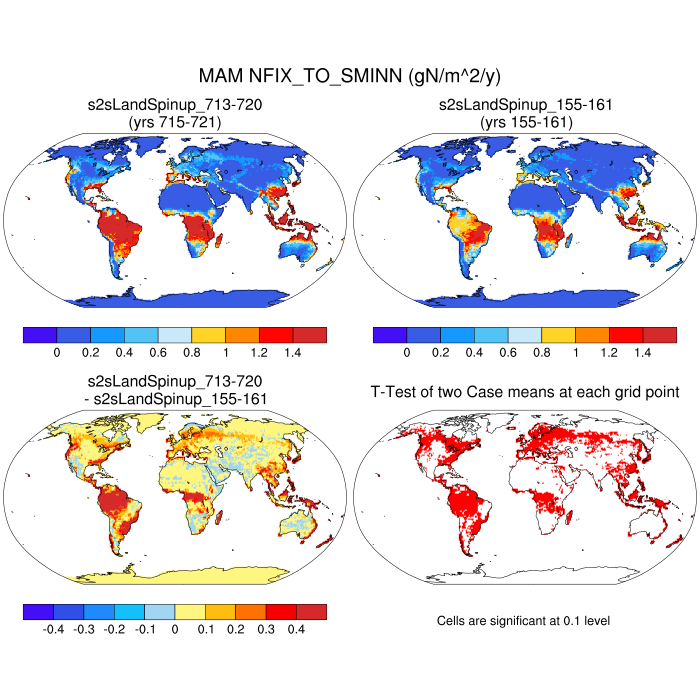
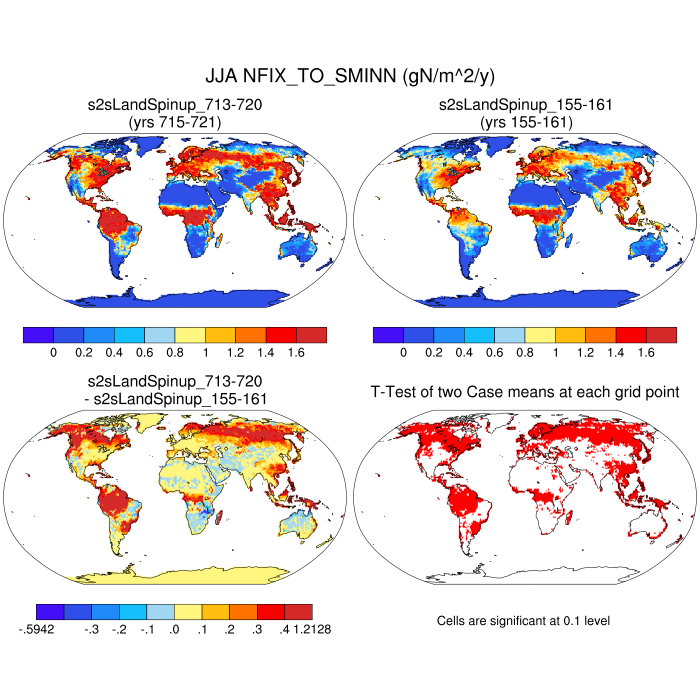
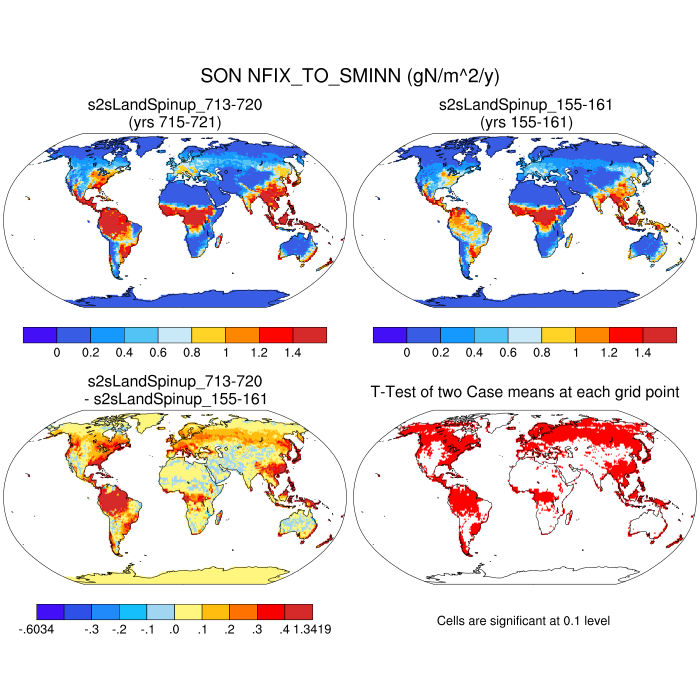
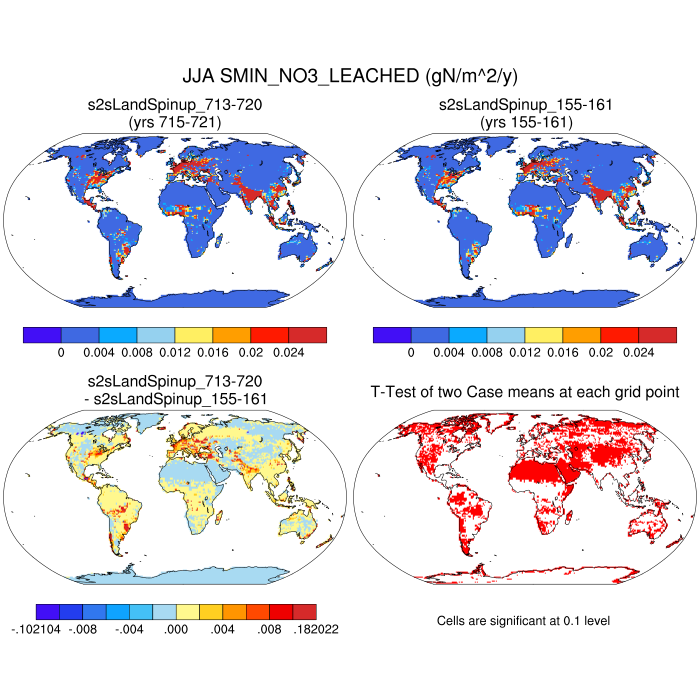
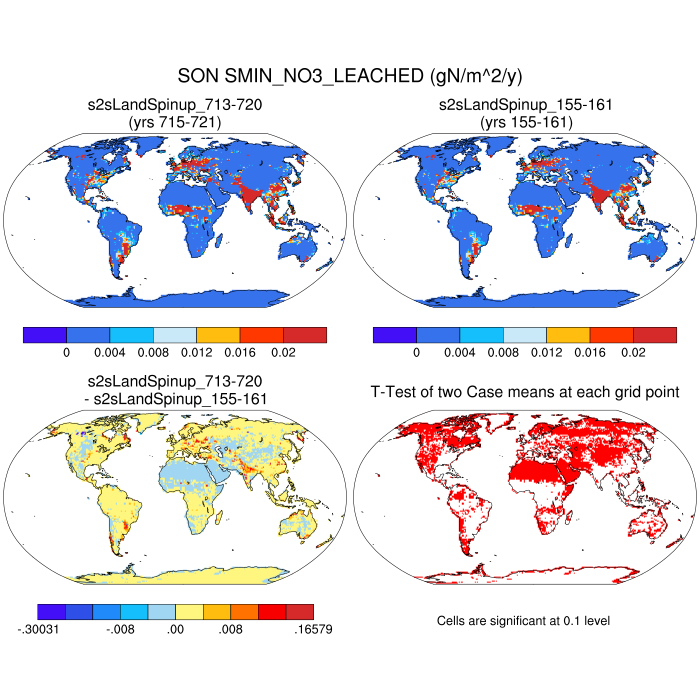
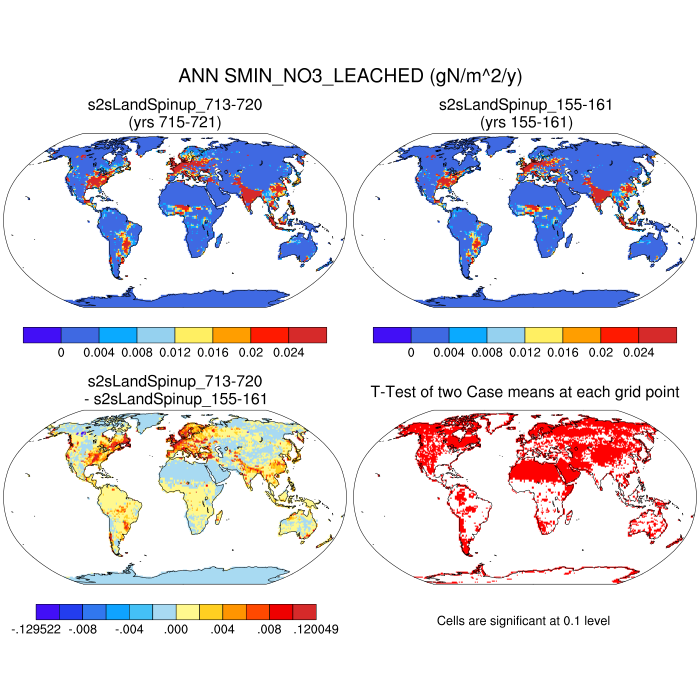
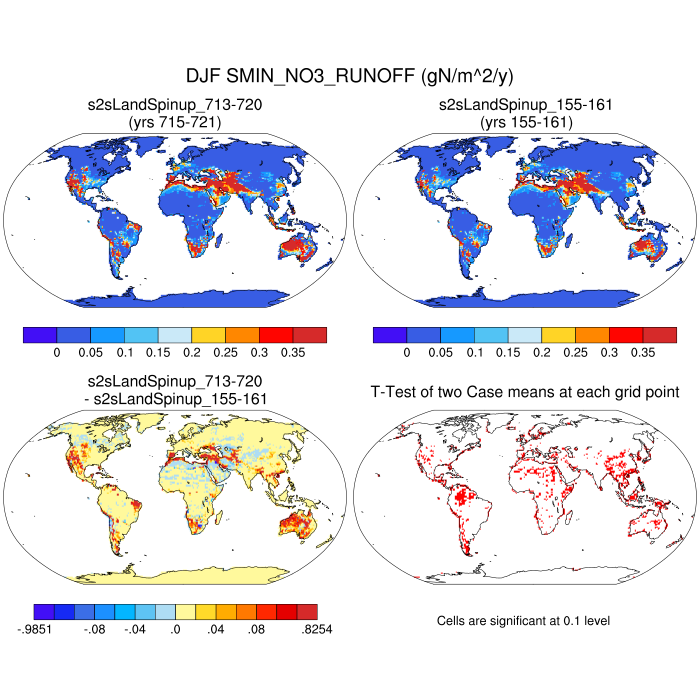
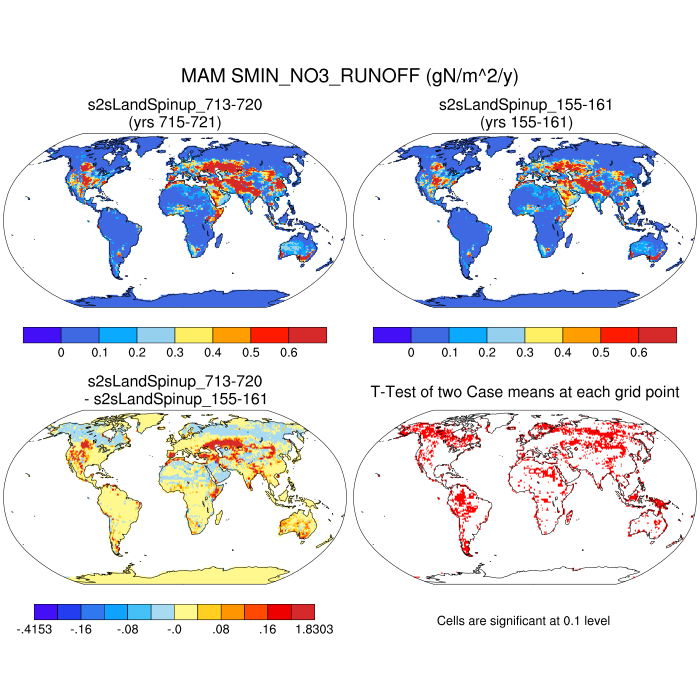
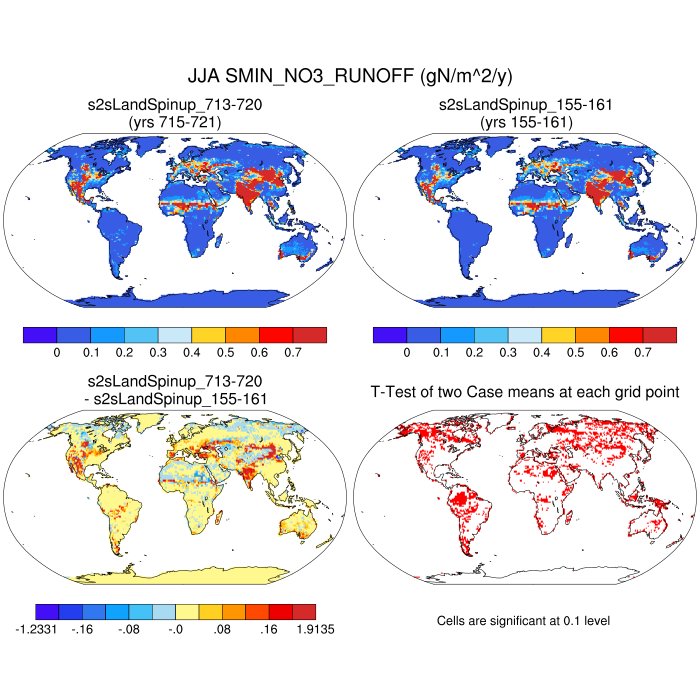
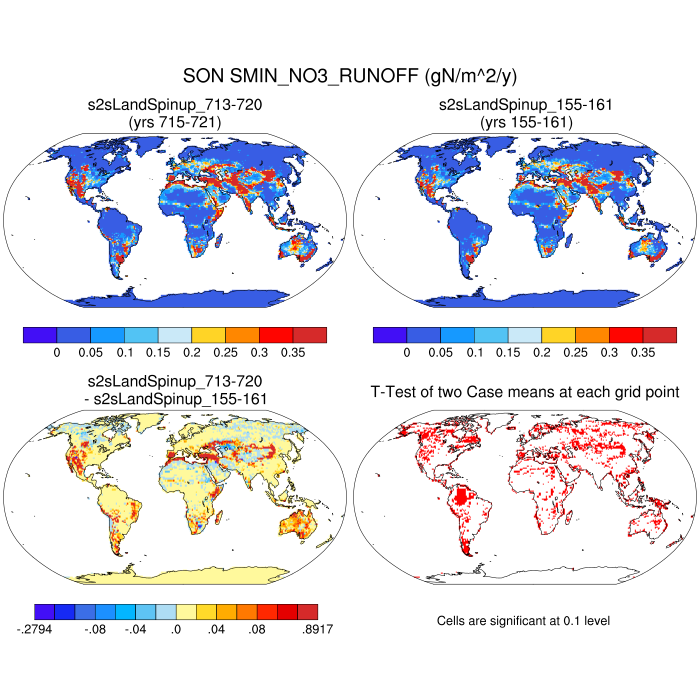
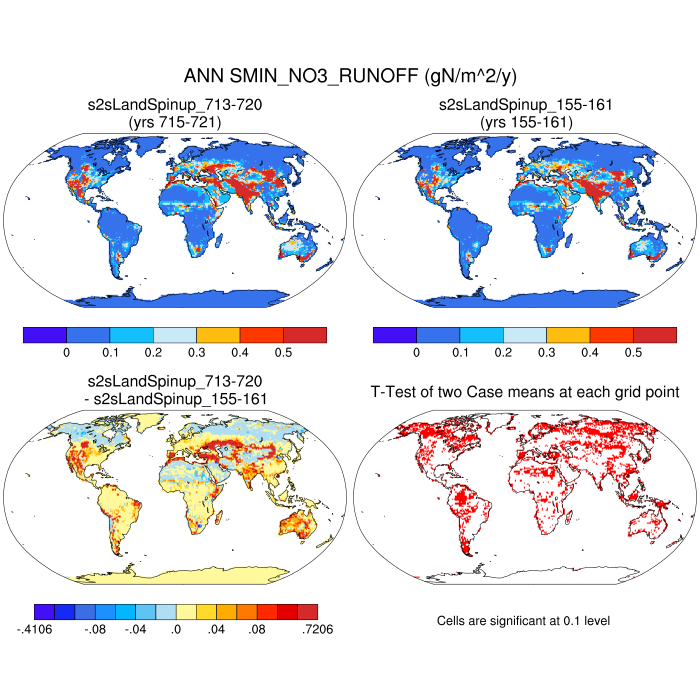
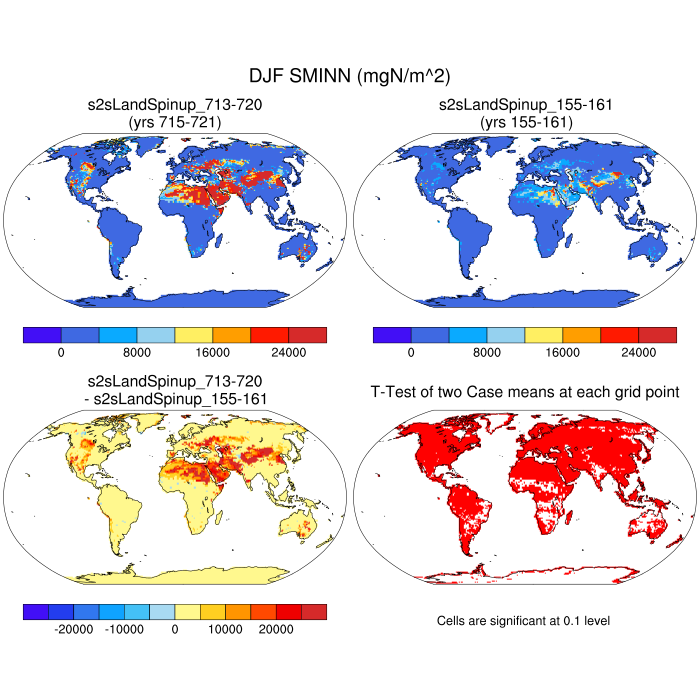
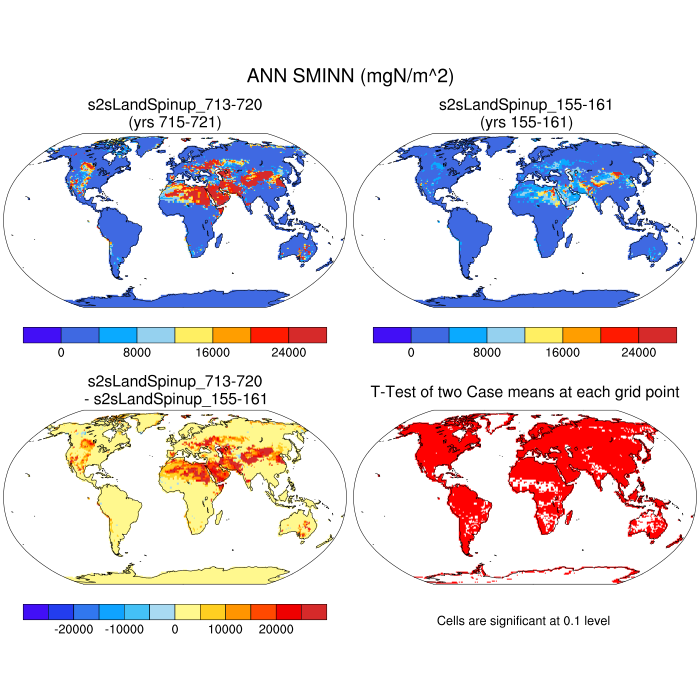
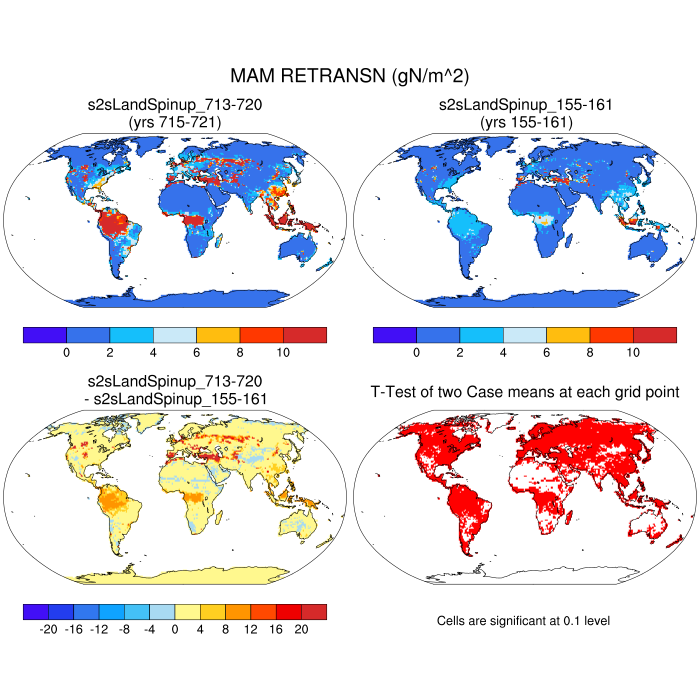
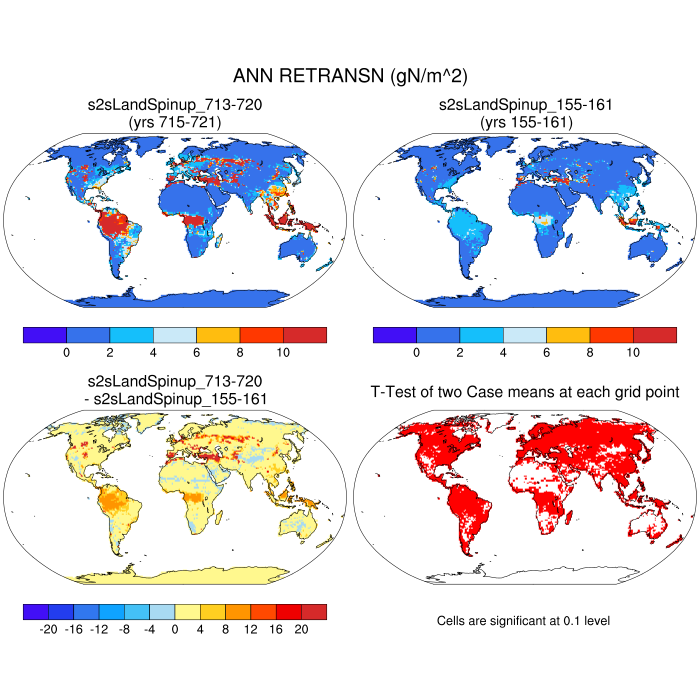
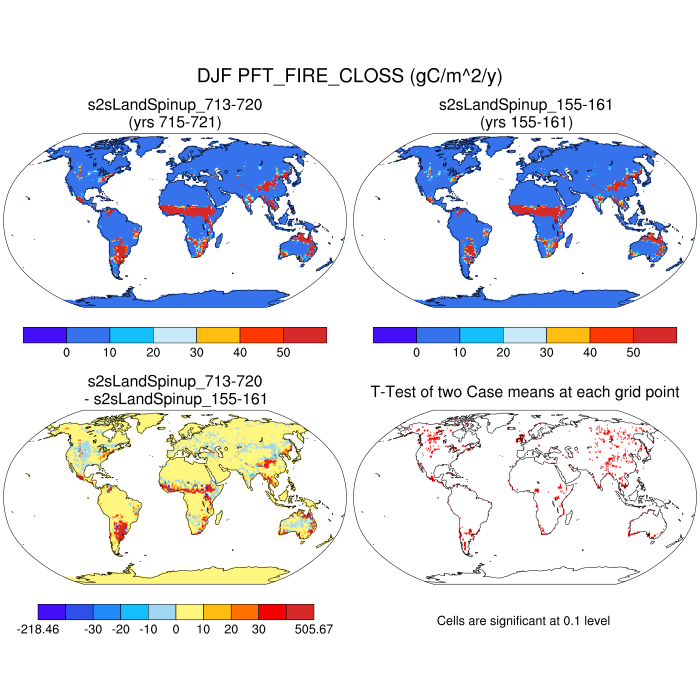
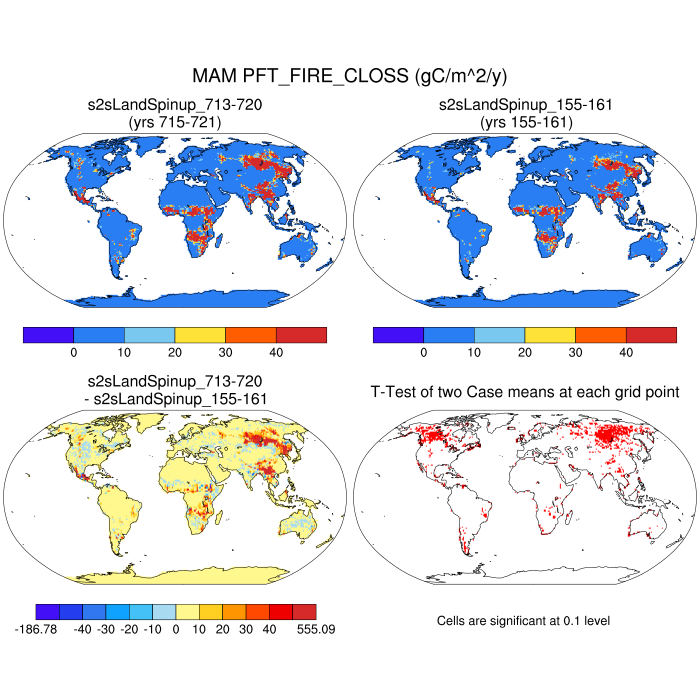
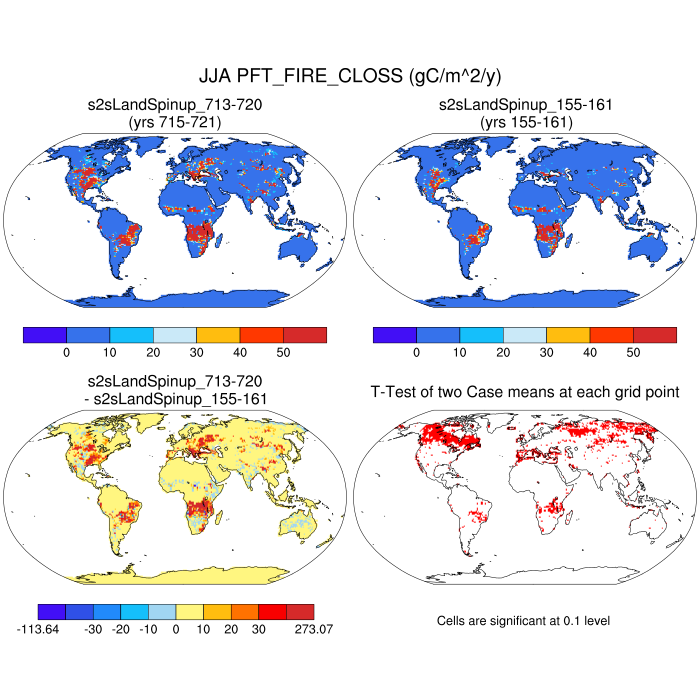
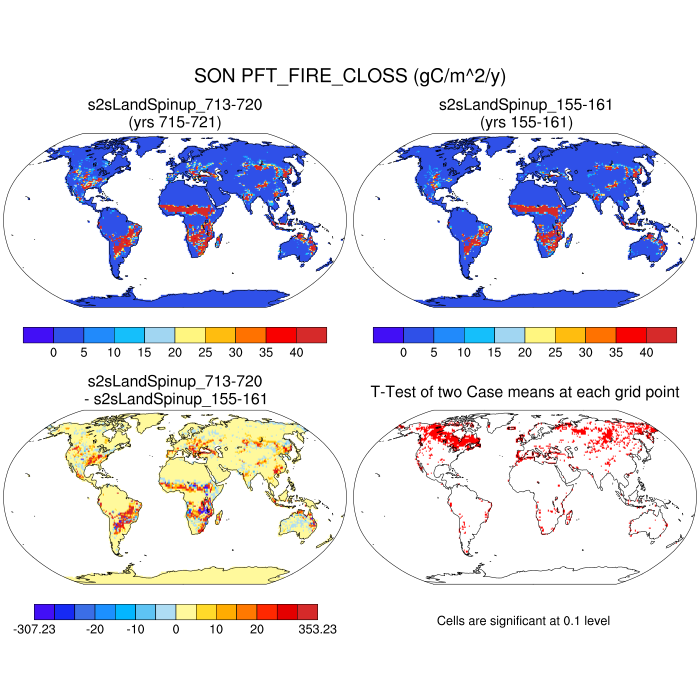
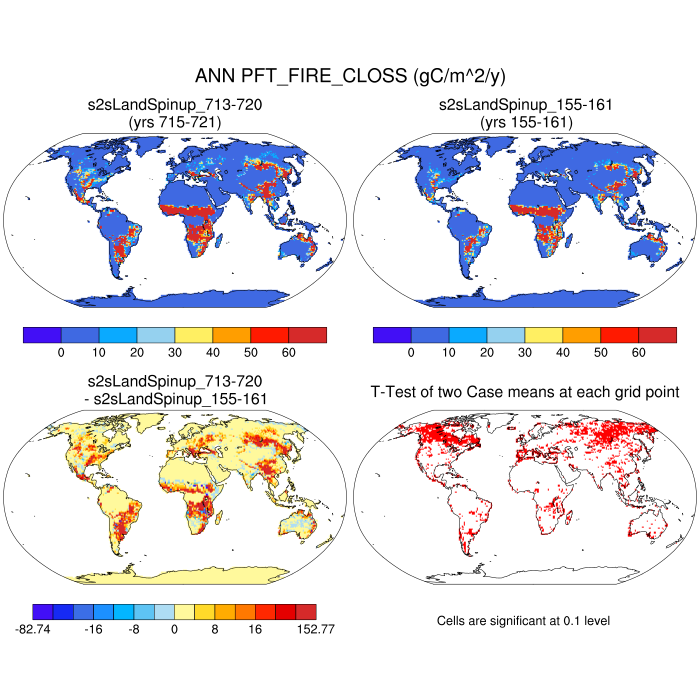
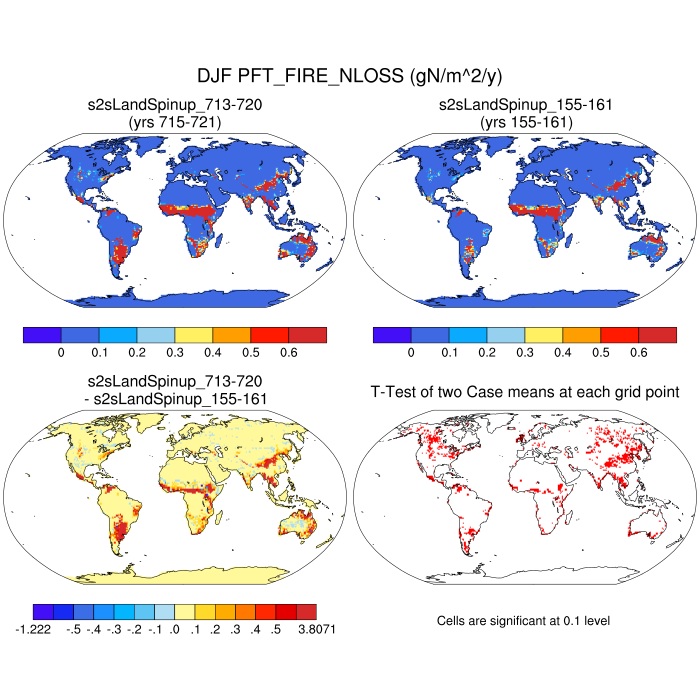
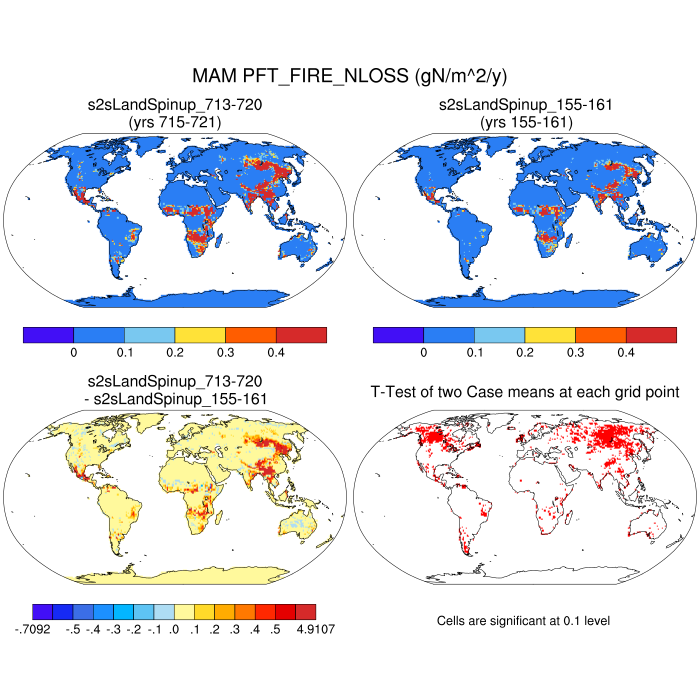
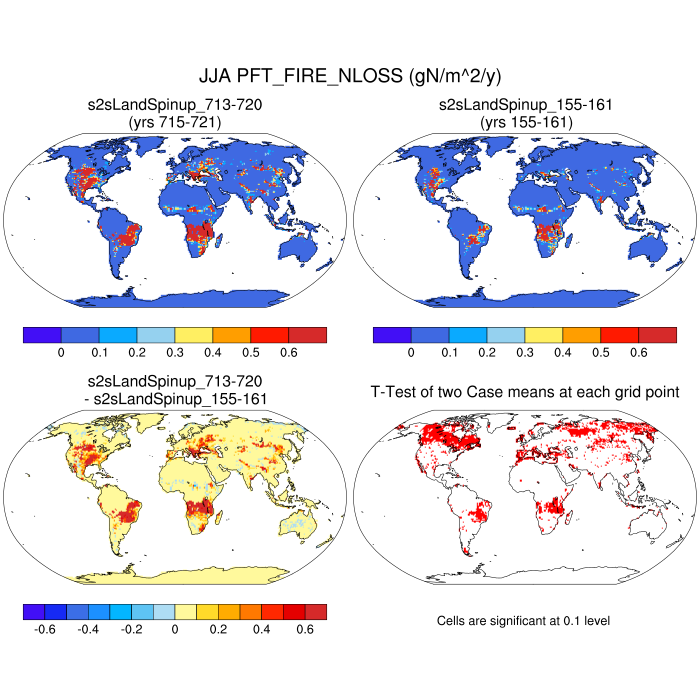
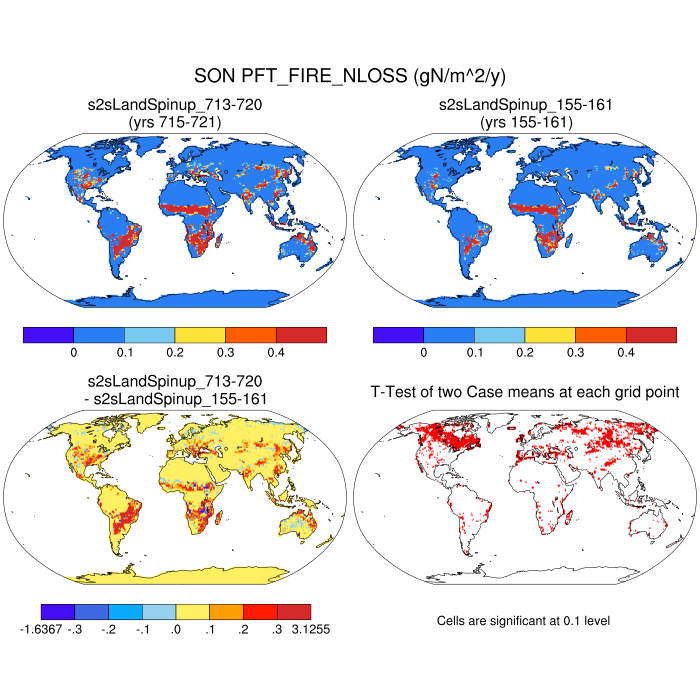
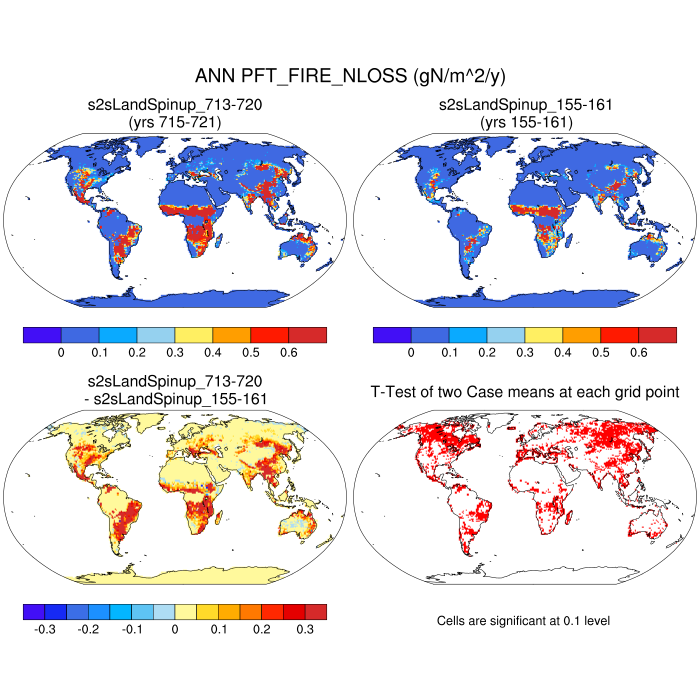
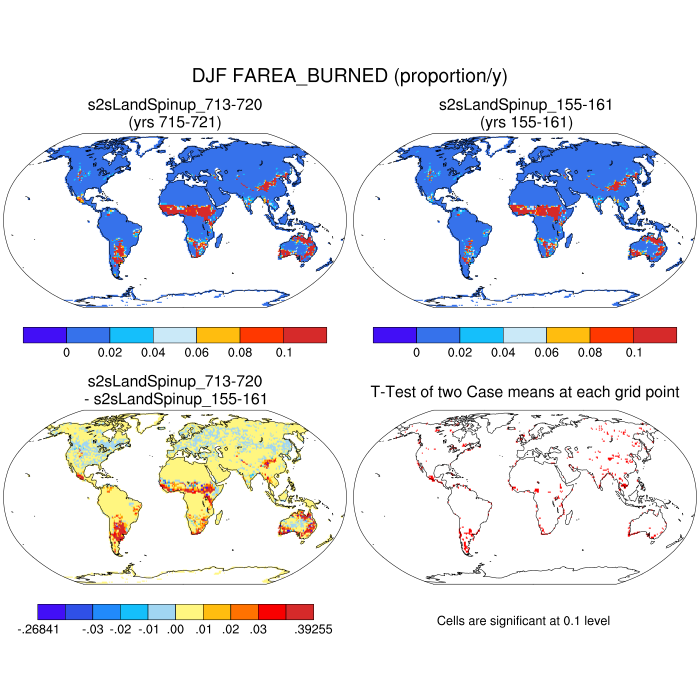
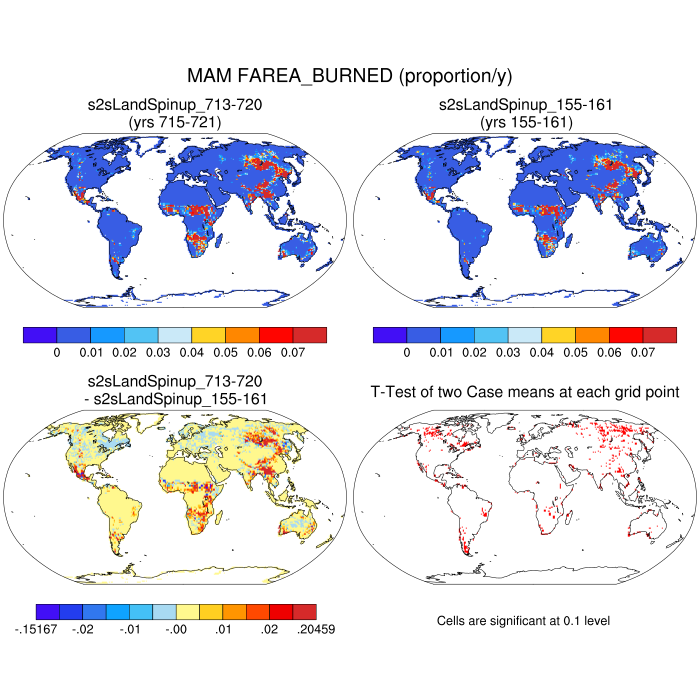
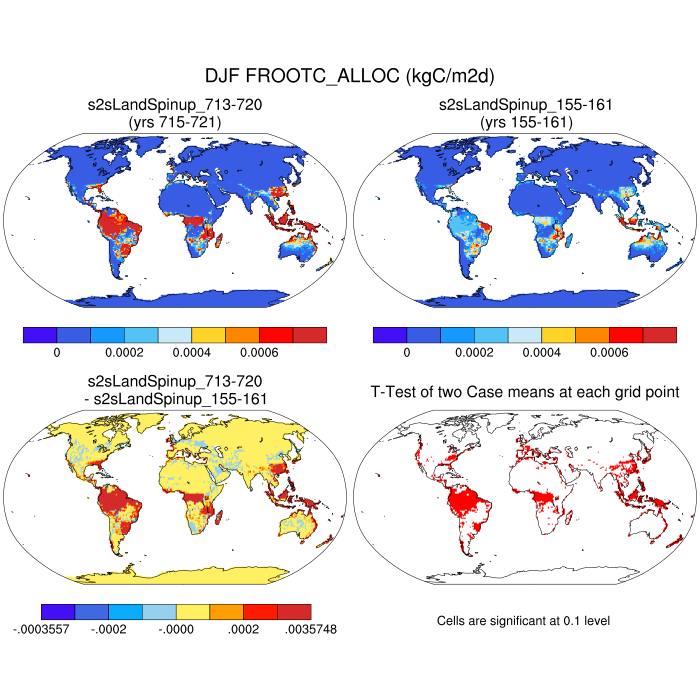
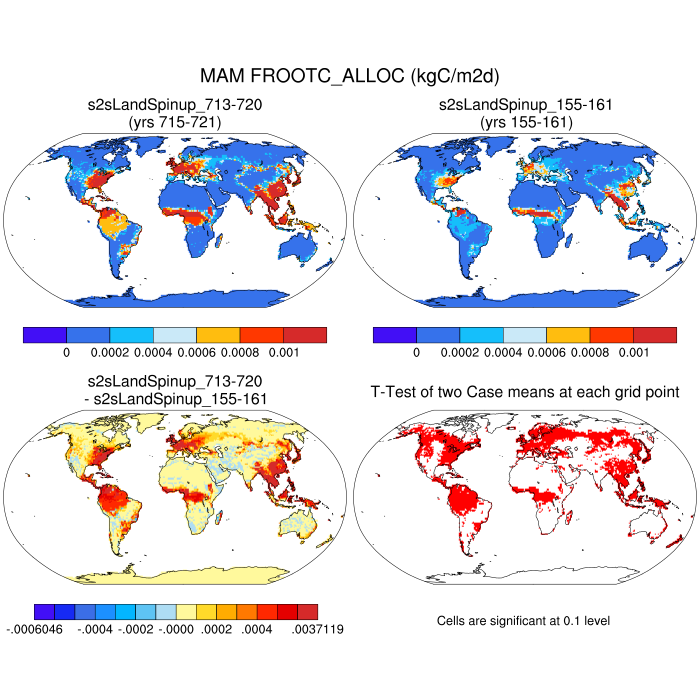
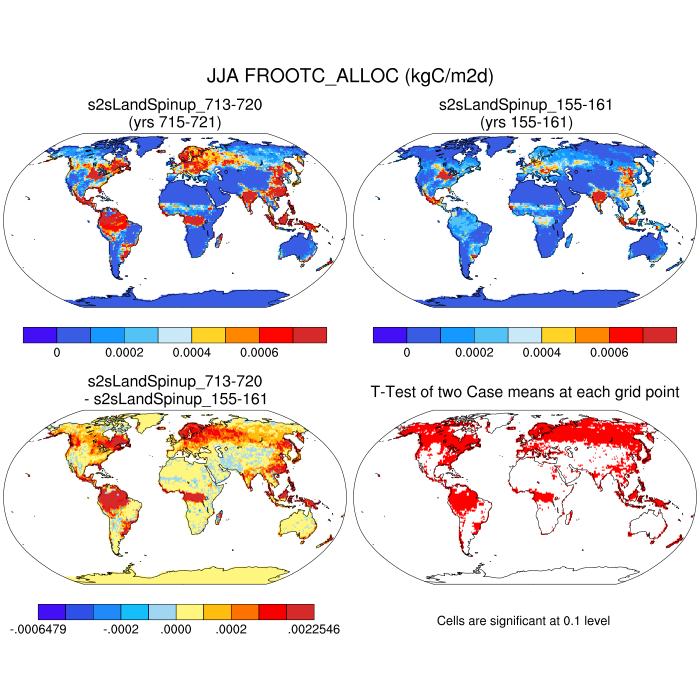
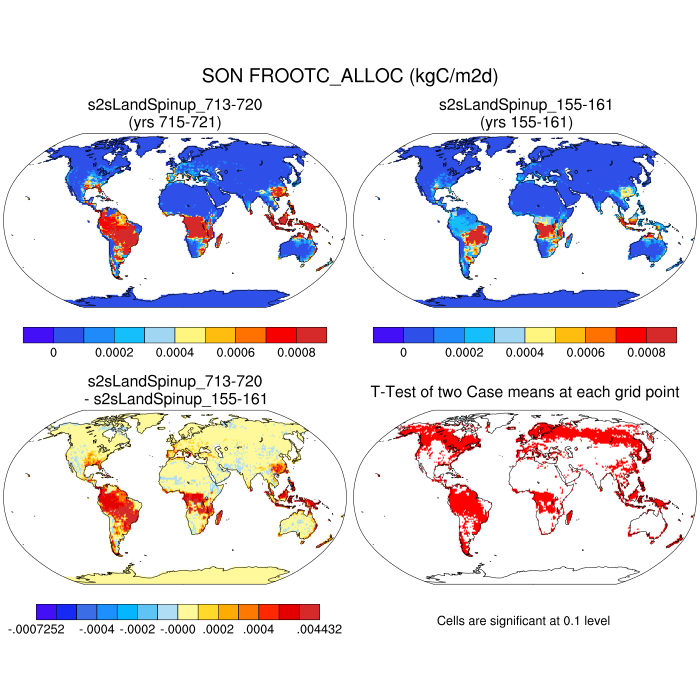
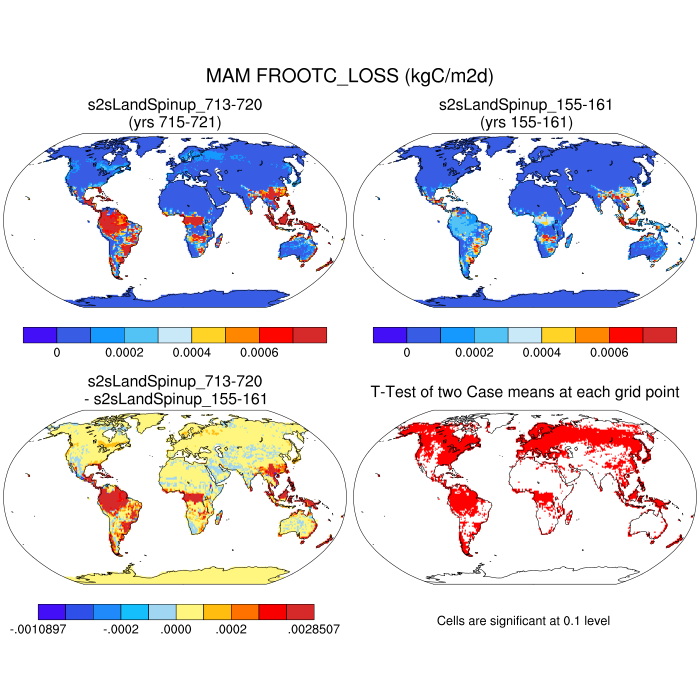
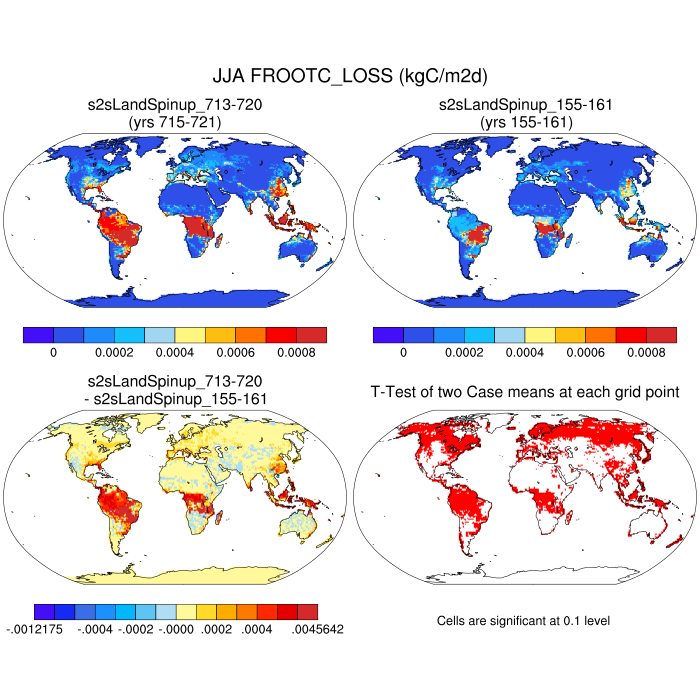
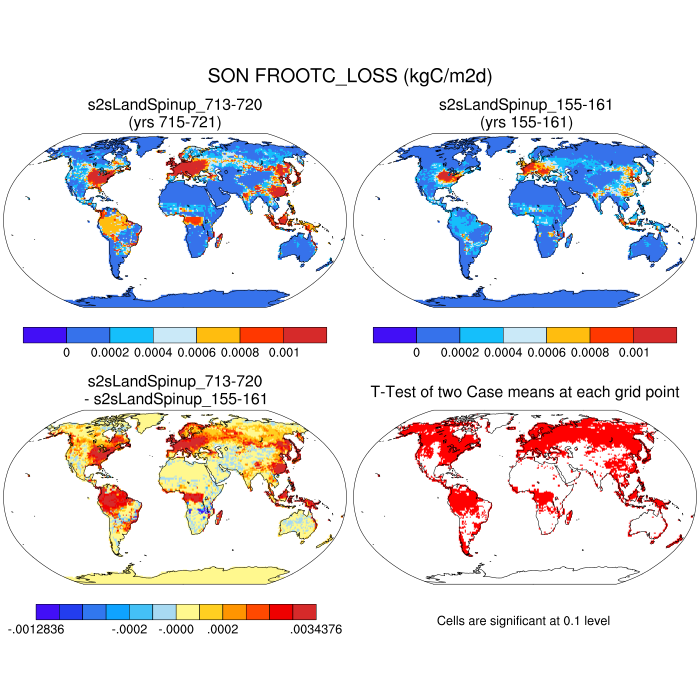
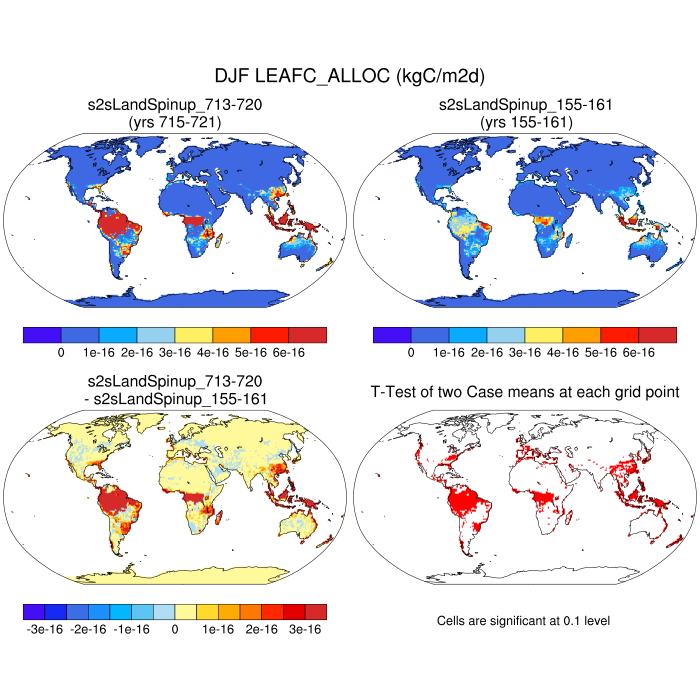
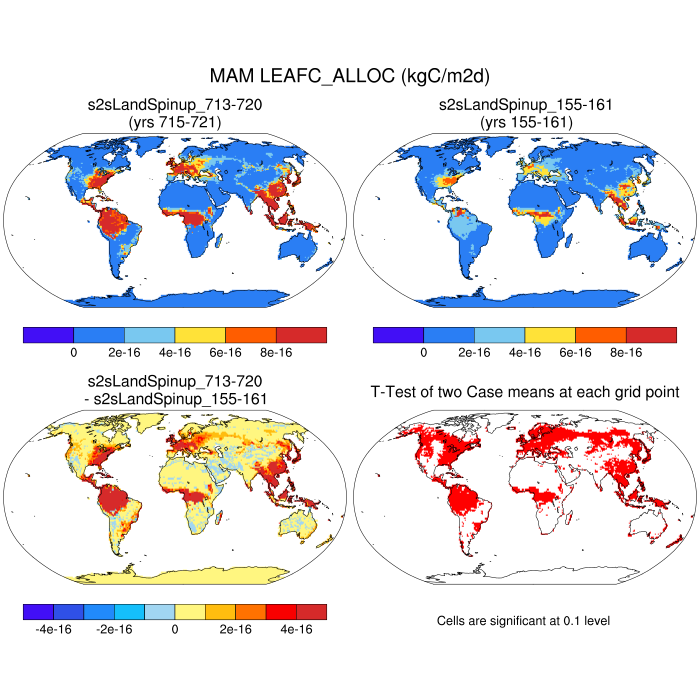
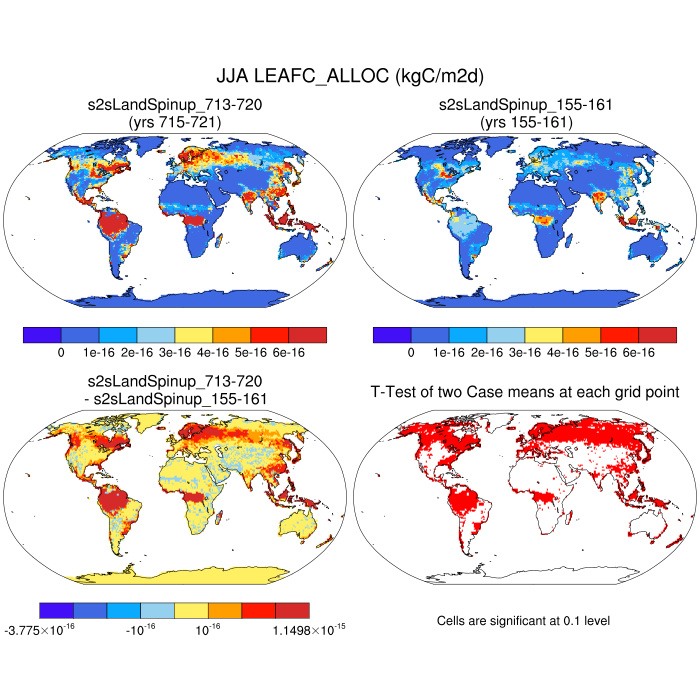
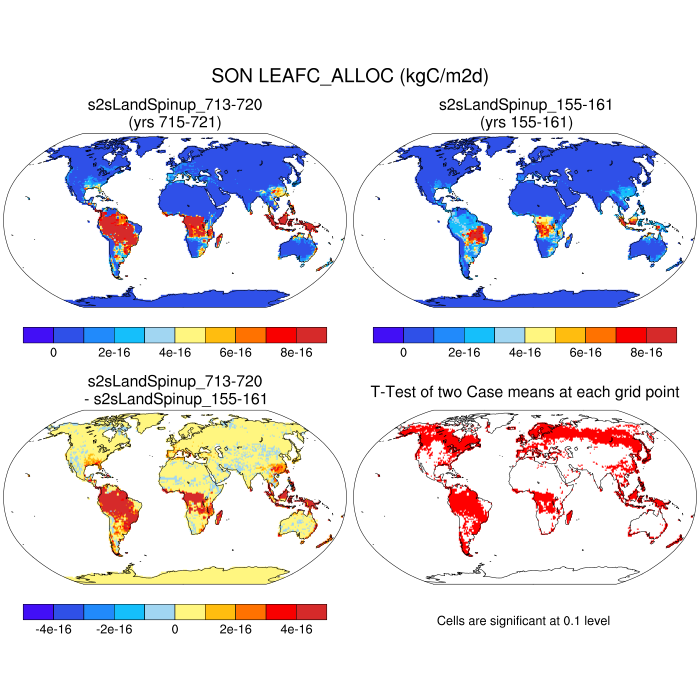
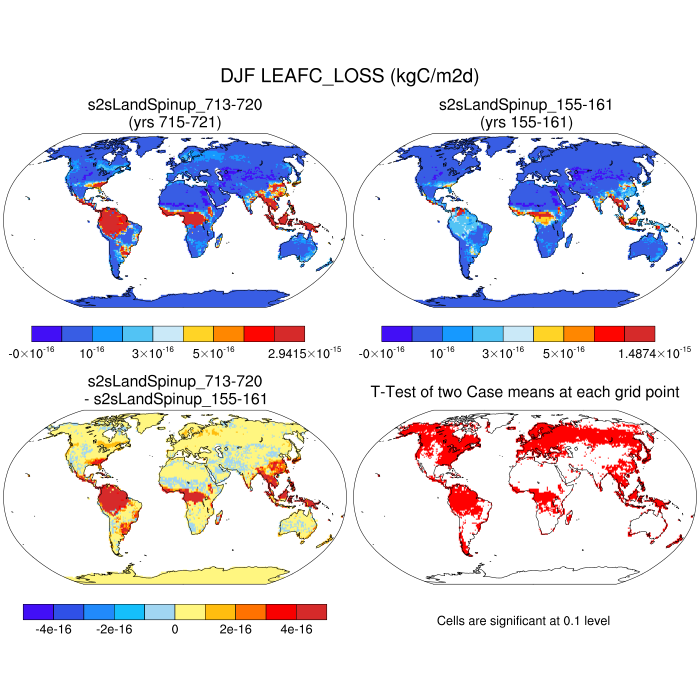
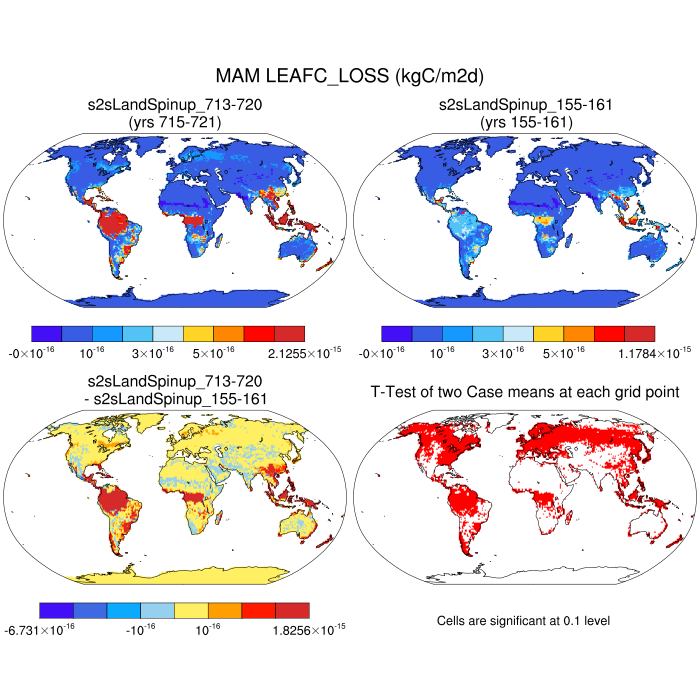
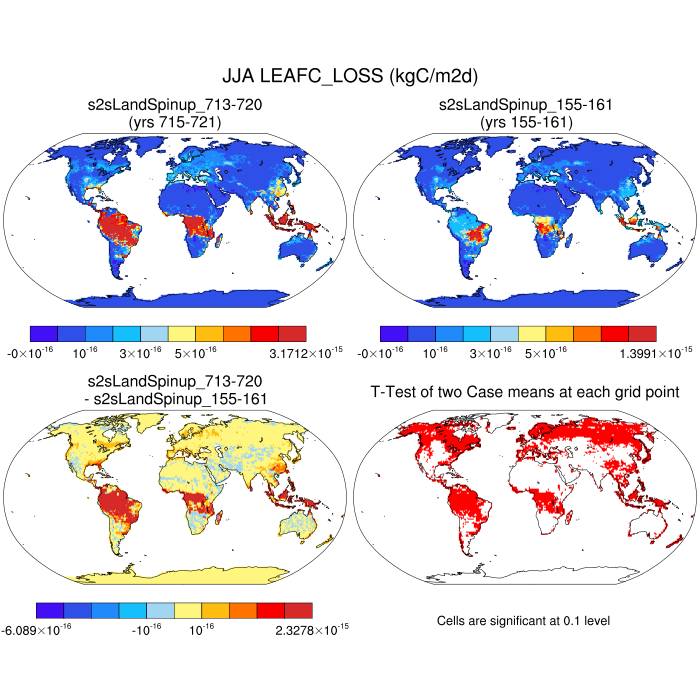
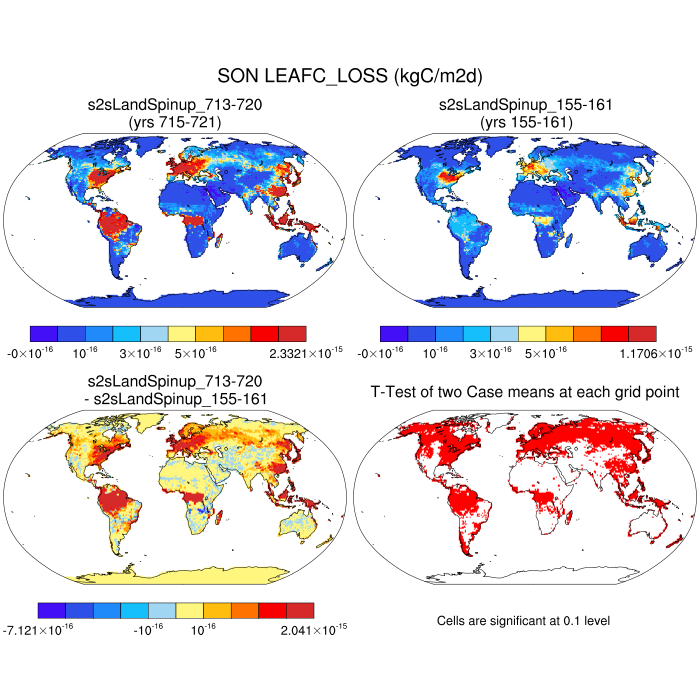
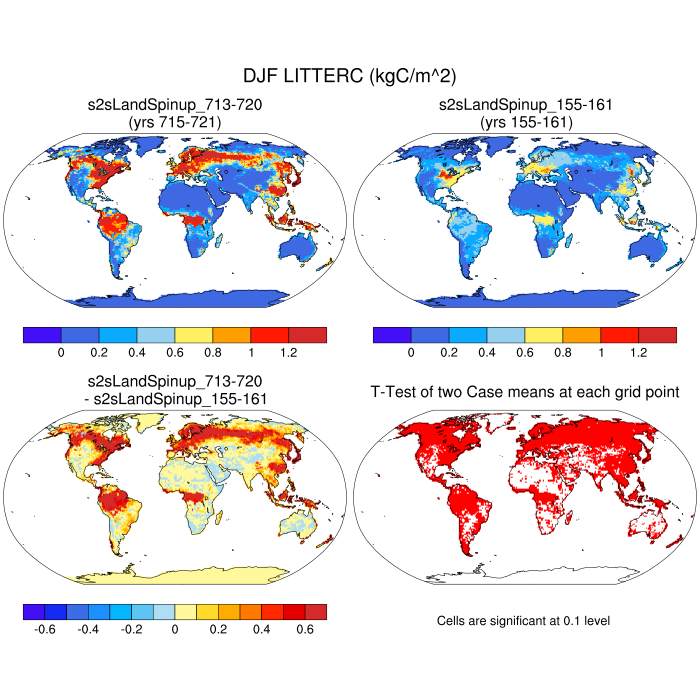
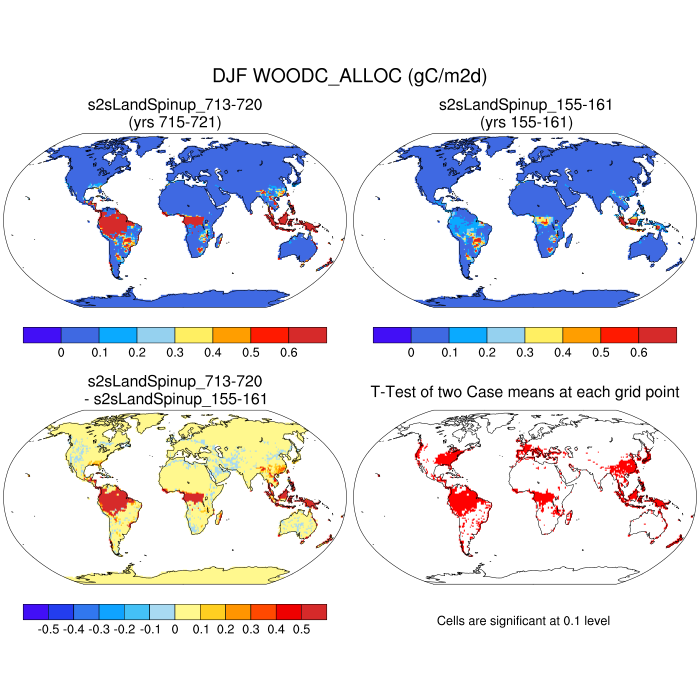
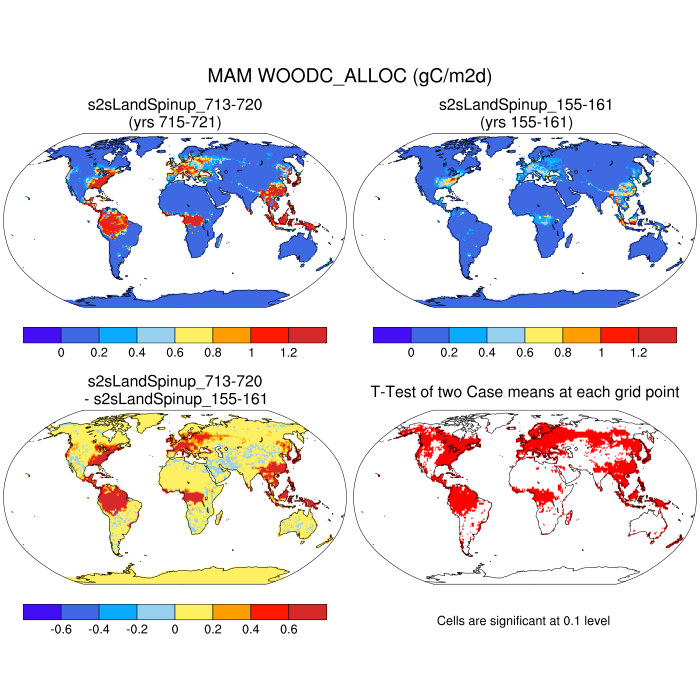
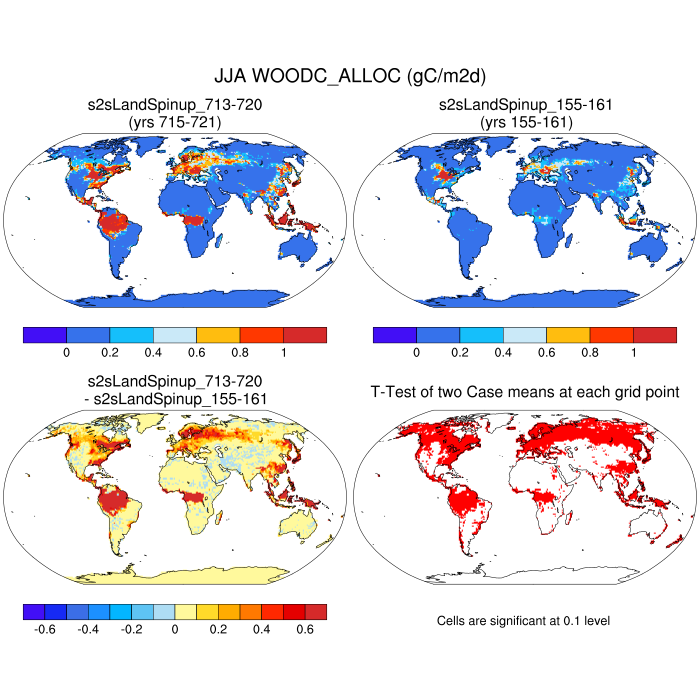
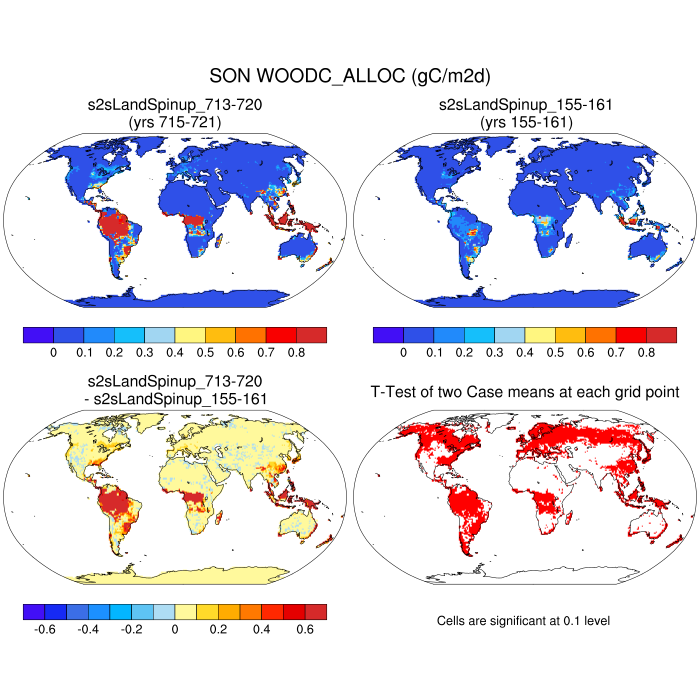
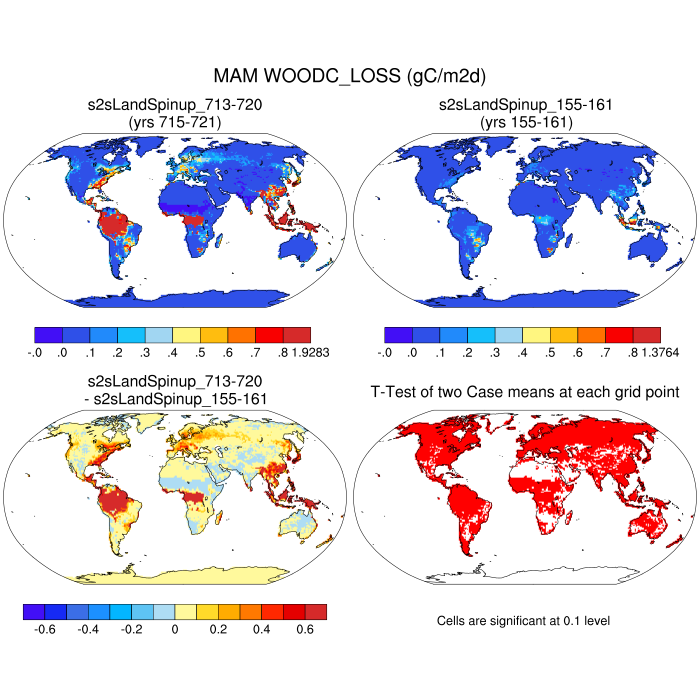
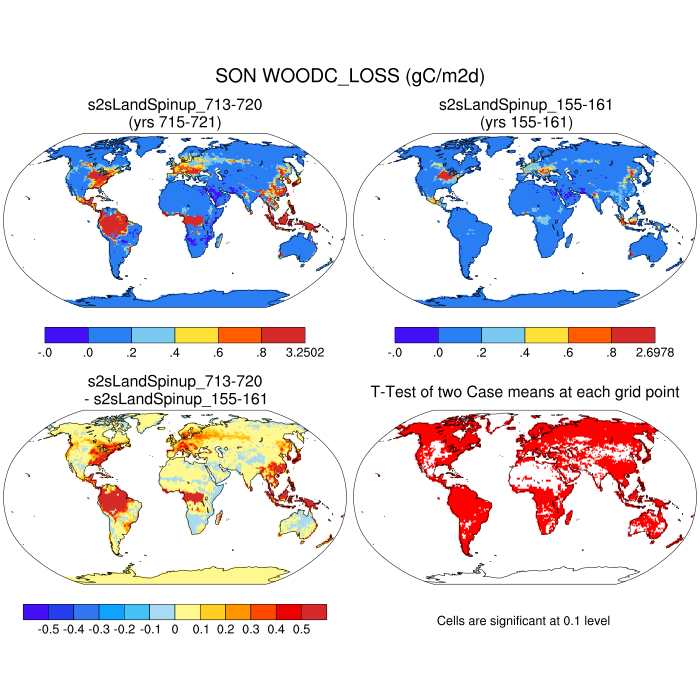
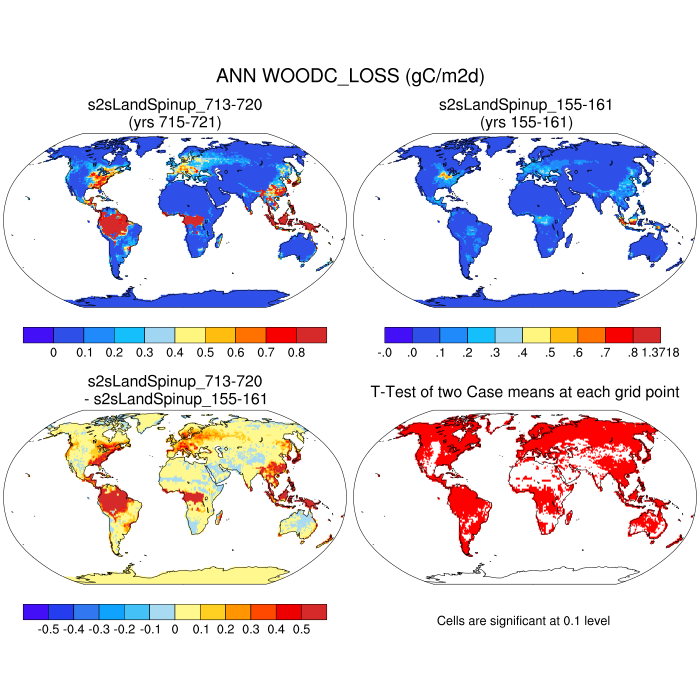
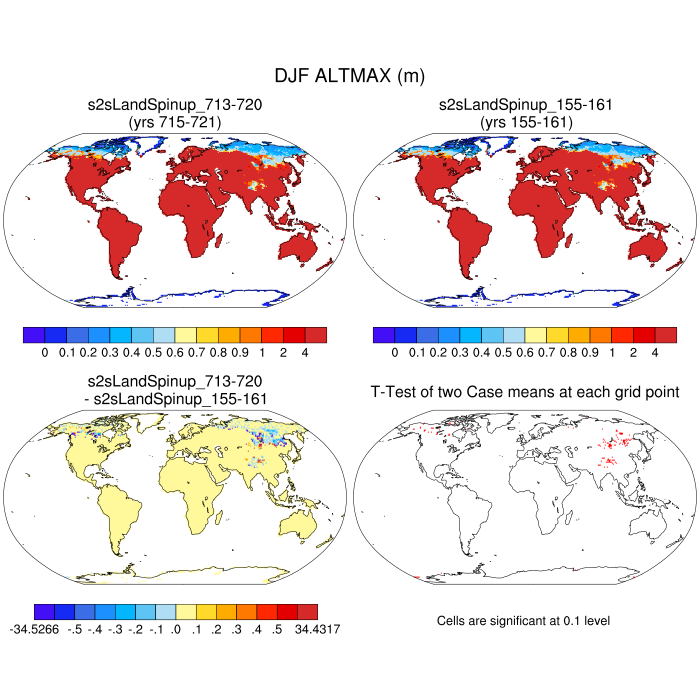
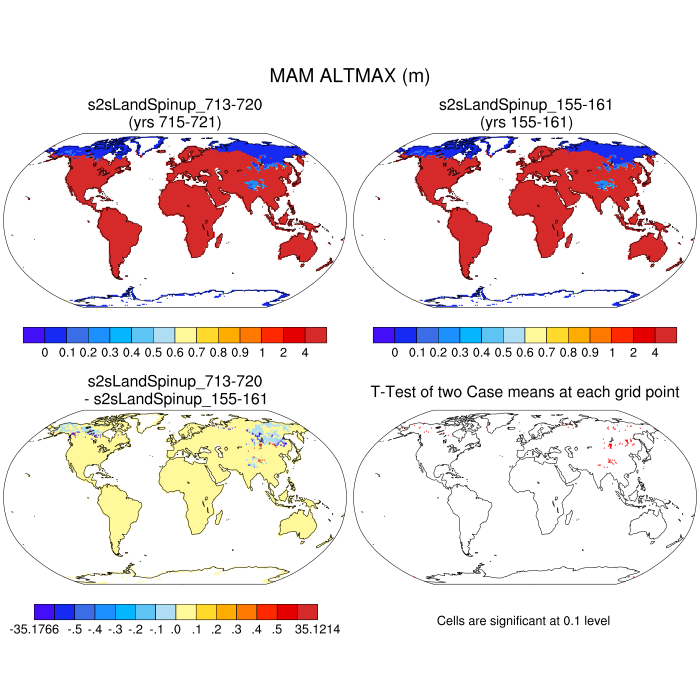
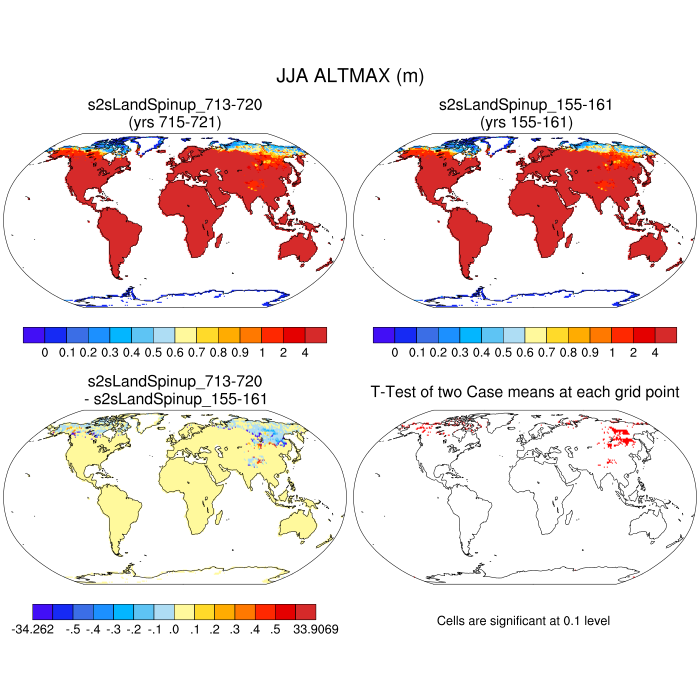
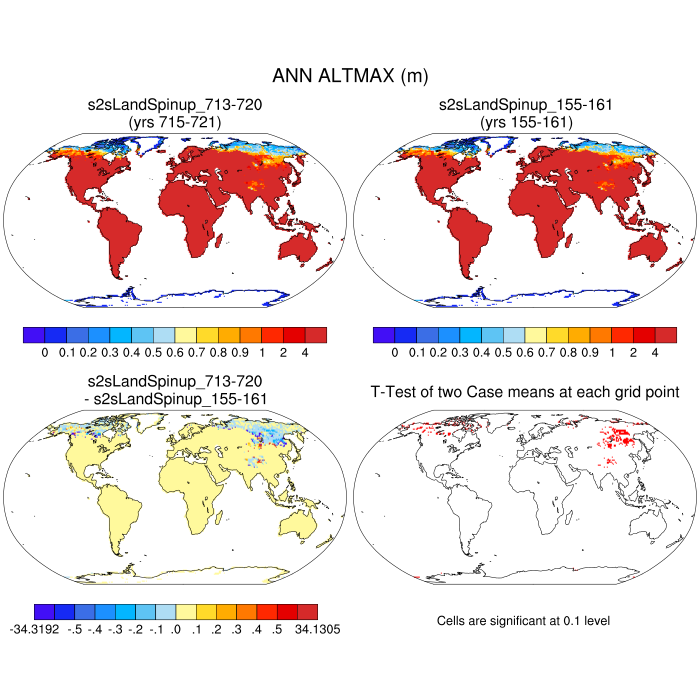
Set 2 Description: Horizontal contour plots of DJF, MAM, JJA, SON, and ANN means
Lookup Table: Set 2 Variable Definition
| Willmott-Matsuura | DJF | MAM | JJA | SON | ANN | |
|---|---|---|---|---|---|---|
| TSA | 2m air temperature | plot | plot | plot | plot | plot |
| PREC | ppt: rain+snow | plot | plot | plot | plot | plot |
| GRDC | ||||||
| TOTRUNOFF | Total Liquid Runoff | plot | plot | plot | plot | plot |
| USAF/ETAC - FOSTERDAVY | ||||||
| SNOWDP | snow height | plot | plot | plot | plot | plot |
| CMC | ||||||
| SNOWDP | snow height | plot | plot | plot | plot | plot |
| H2OSNO | total snow water equiv (SNOWICE + SNOWLIQ) | plot | plot | plot | plot | plot |
| NOAA-AVHRR | ||||||
| FSNO | fraction of ground covered by snow | plot | plot | plot | plot | plot |
| MODIS | ||||||
| VBSA | visible black-sky albedo | plot | plot | plot | plot | plot |
| NBSA | near-IR black-sky albedo | plot | plot | plot | plot | plot |
| VWSA | visible white-sky albedo | plot | plot | plot | plot | plot |
| NWSA | near-IR white-sky albedo | plot | plot | plot | plot | plot |
| ASA | all-sky albedo:FSR/FSDS | plot | plot | plot | plot | plot |
| FLUXNET | ||||||
| LHEAT | latent heat:FCTR+FCEV+FGEV | plot | plot | plot | plot | plot |
| GPP | gross primary production | plot | plot | plot | plot | plot |
| MODIS | ||||||
| TLAI | total one-sided leaf area index | plot | plot | plot | plot | plot |
| Model Only | DJF | MAM | JJA | SON | ANN | |
| ASA | all-sky albedo:FSR/FSDS | plot | plot | plot | plot | plot |
| RNET | net radiation:fsa-fira | plot | plot | plot | plot | plot |
| FPSN | photosynthesis | plot | plot | plot | plot | plot |
| FSH | sensible heat | plot | plot | plot | plot | plot |
| FSH_V | sensible heat from vegetation | plot | plot | plot | plot | plot |
| FSH_G | sensible heat from ground | plot | plot | plot | plot | plot |
| FSH_TO_COUPLER | sensible heat sent to coupler | --- | --- | --- | --- | --- |
| FSH_PRECIP_CONVERSION | SHF from conv of rain/snow atm forcing | --- | --- | --- | --- | --- |
| FSH_RUNOFF_ICE_TO_LIQ | SHF from conv of ice runoff to liquid | --- | --- | --- | --- | --- |
| CPL_ENERGY_BAL | Coupler Energy Balance (Global Area) | --- | --- | --- | --- | --- |
| TV | vegetation temperature | plot | plot | plot | plot | plot |
| TG | ground temperature | plot | plot | plot | plot | plot |
| FSA | absorbed solar radiation | plot | plot | plot | plot | plot |
| SABV | solar rad absorbed by vegetation | plot | plot | plot | plot | plot |
| SABG | solar rad absorbed by ground | plot | plot | plot | plot | plot |
| FSR | reflected solar radiation | plot | plot | plot | plot | plot |
| FIRA | net infrared (longwave) radiation | plot | plot | plot | plot | plot |
| FIRE | emitted infrared (longwave) radiation | plot | plot | plot | plot | plot |
| FCTR | canopy transpiration | plot | plot | plot | plot | plot |
| FCEV | canopy evaporation | plot | plot | plot | plot | plot |
| FGEV | ground evaporation | plot | plot | plot | plot | plot |
| FGR | heat flux into snow/soil (includes snow melt) | plot | plot | plot | plot | plot |
| FSM | snow melt heat flux | plot | plot | plot | plot | plot |
| FGNET | net ground heat flux:fgr-fsm | plot | plot | plot | plot | plot |
| TAUX | zonal surface stress | plot | plot | plot | plot | plot |
| TAUY | meridional surface stress | plot | plot | plot | plot | plot |
| ELAI | exposed one-sided leaf area index | plot | plot | plot | plot | plot |
| ESAI | exposed one-sided stem area index | plot | plot | plot | plot | plot |
| TSAI | total one-sided stem area index | plot | plot | plot | plot | plot |
| LAISUN | Sunlit Projected Leaf Area Index | plot | plot | plot | plot | plot |
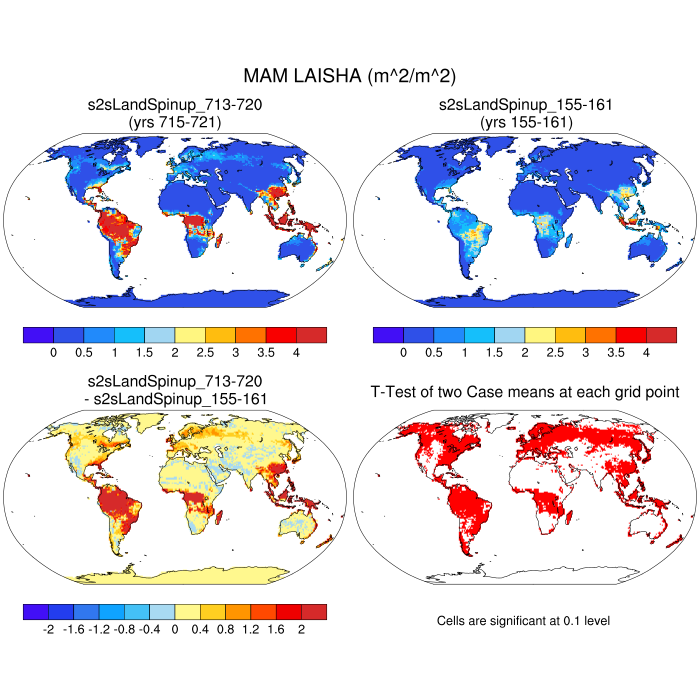
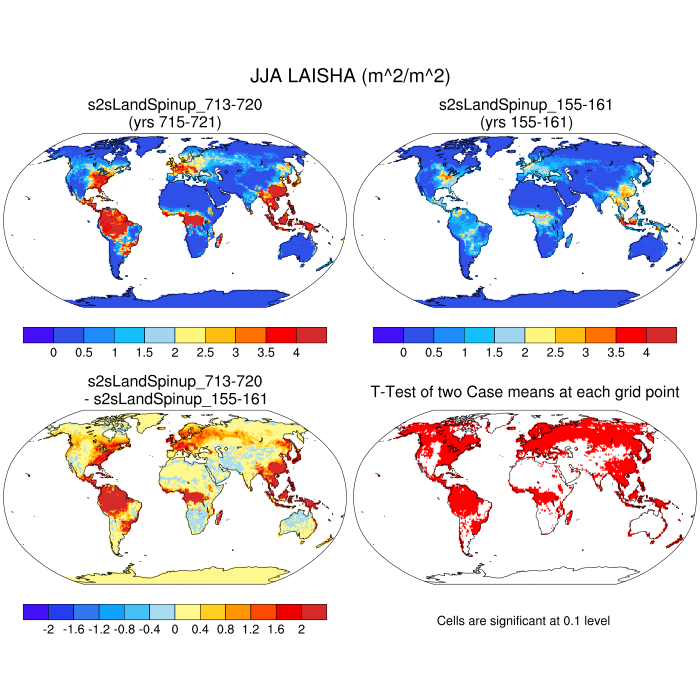
| LAISHA | Shaded Projected Leaf Area Index | plot | plot | plot | plot | plot |
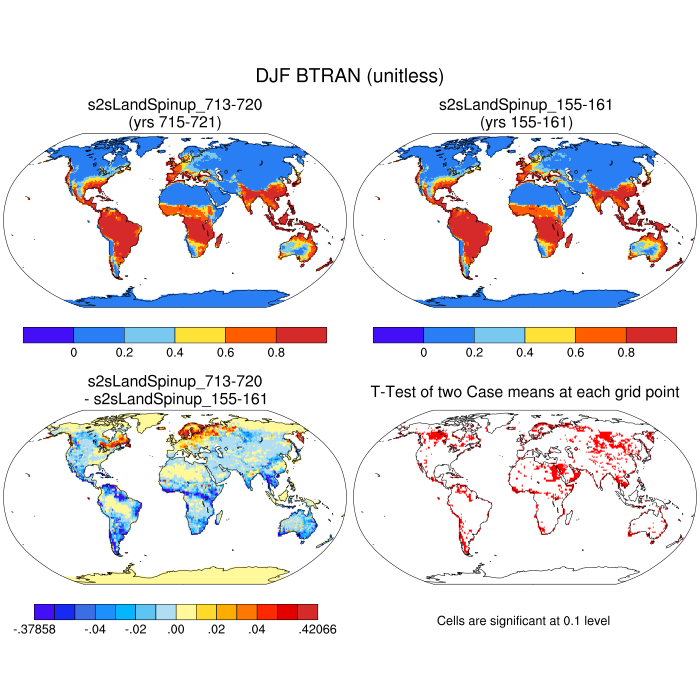
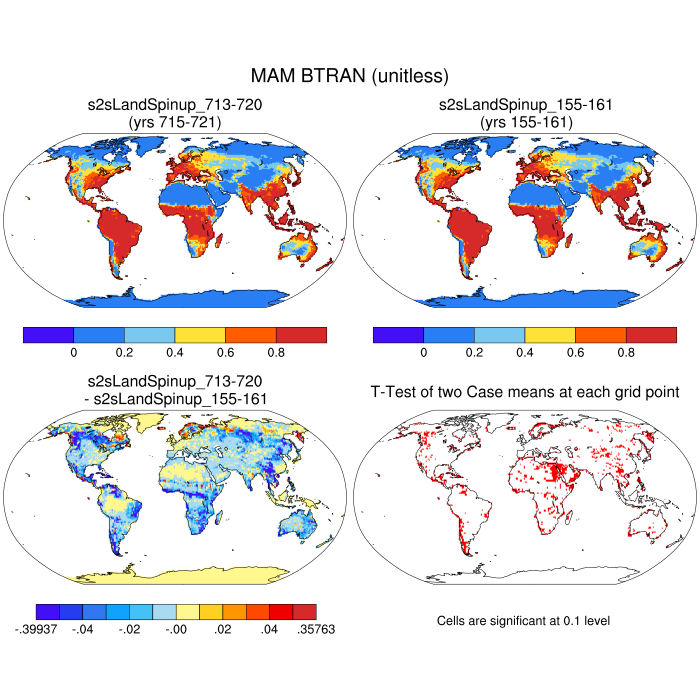
| BTRAN | transpiration beta factor | plot | plot | plot | plot | plot |
| H2OCAN | intercepted water | plot | plot | plot | plot | plot |
| SNOWLIQ | snow liquid water | plot | plot | plot | plot | plot |
| SNOWICE | snow ice | plot | plot | plot | plot | plot |
| QINFL | infiltration | plot | plot | plot | plot | plot |
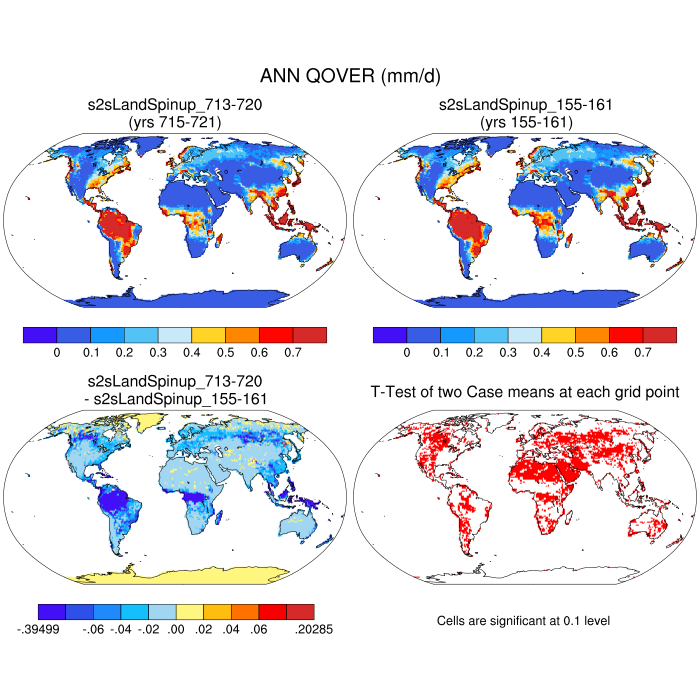
| QOVER | surface runoff | plot | plot | plot | plot | plot |
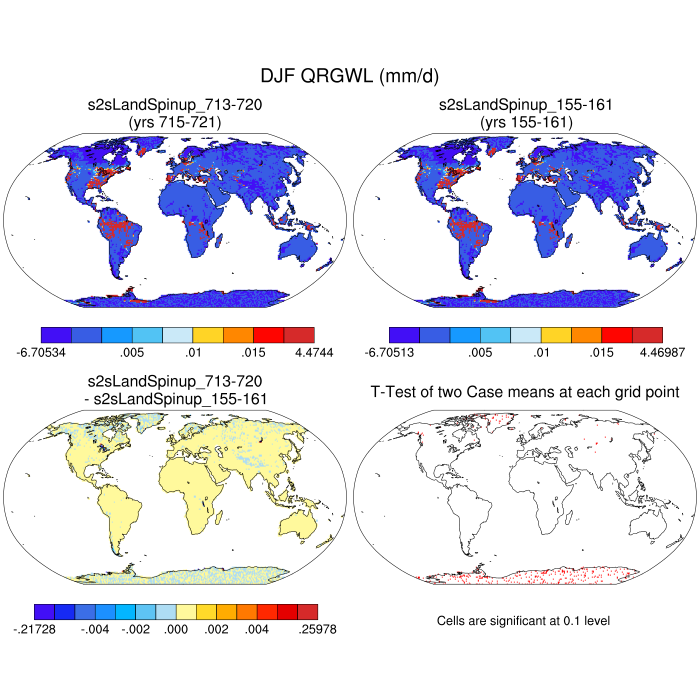
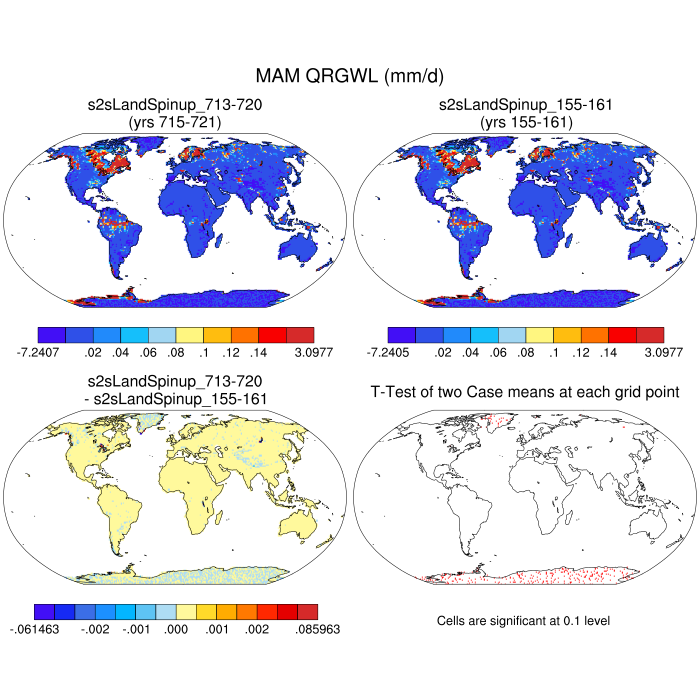
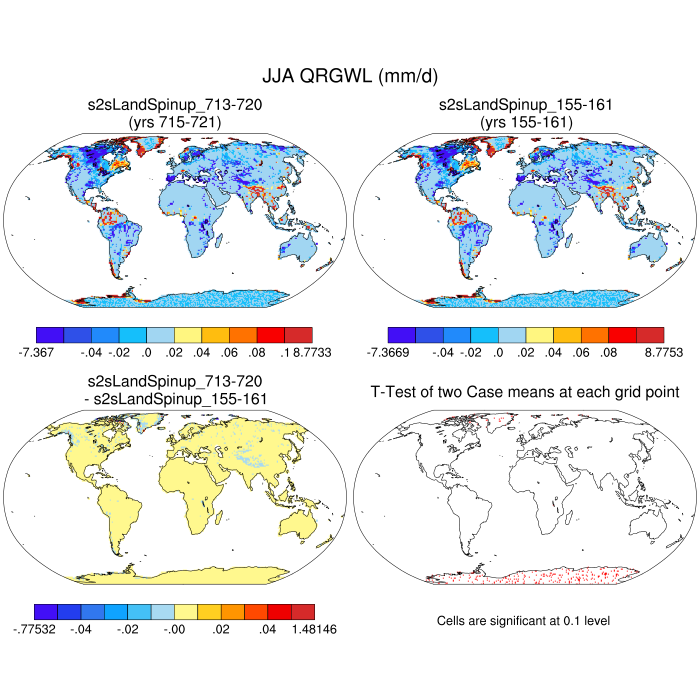
| QRGWL | surface runoff at glaciers (liquid only), wetlands, lakes; also includes melted ice runoff from QSNWCPICE | plot | plot | plot | plot | plot |
| QDRAI | sub-surface drainage | plot | plot | plot | plot | plot |
| QINTR | interception | plot | plot | plot | plot | plot |
| QDRIP | throughfall | plot | plot | plot | plot | plot |
| QSNOMELT | snow melt | plot | plot | plot | plot | plot |
| QSOIL | ground evaporation | plot | plot | plot | plot | plot |
| QVEGE | canopy evaporation | plot | plot | plot | plot | plot |
| QVEGT | canopy transpiration | plot | plot | plot | plot | plot |
| ERRSOI | soil/lake energy conservation error | plot | plot | plot | plot | plot |
| ERRSEB | surface energy conservation error | plot | plot | plot | plot | plot |
| ERRSOL | solar radiation conservation error | plot | plot | plot | plot | plot |
| ERRH2O | total water conservation error | plot | plot | plot | plot | plot |
| RAIN | atmospheric rain | plot | plot | plot | plot | plot |
| SNOW | atmospheric snow | plot | plot | plot | plot | plot |
| TBOT | atmospheric air temperature | plot | plot | plot | plot | plot |
| TLAKE (1) | lake temperature | plot | plot | plot | plot | plot |
| TLAKE (5) | lake temperature | plot | plot | plot | plot | plot |
| TLAKE (10) | lake temperature | plot | plot | plot | plot | plot |
| WIND | atmospheric wind velocity magnitude | plot | plot | plot | plot | plot |
| THBOT | atmospheric air potential temperature | plot | plot | plot | plot | plot |
| QBOT | atmospheric specific humidity | plot | plot | plot | plot | plot |
| ZBOT | atmospheric reference height | plot | plot | plot | plot | plot |
| FLDS | atmospheric longwave radiation | plot | plot | plot | plot | plot |
| FSDS | atmospheric incident solar radiation | plot | plot | plot | plot | plot |
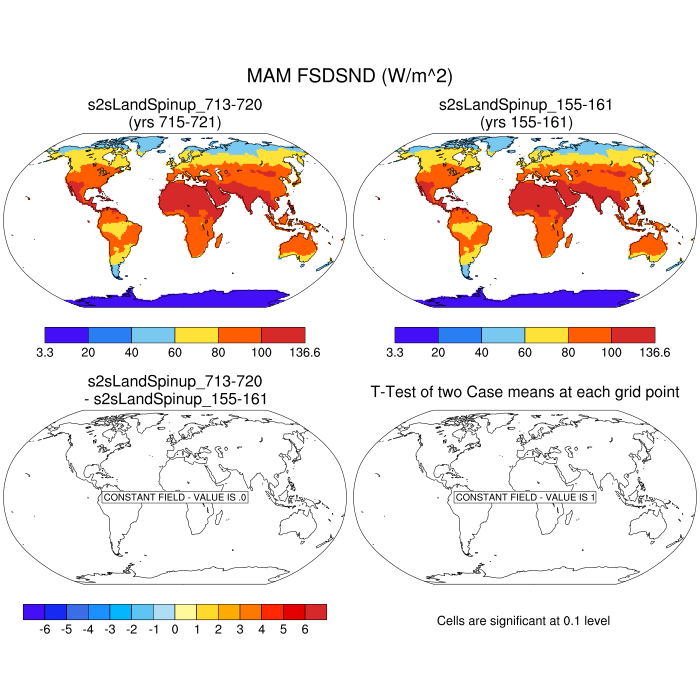
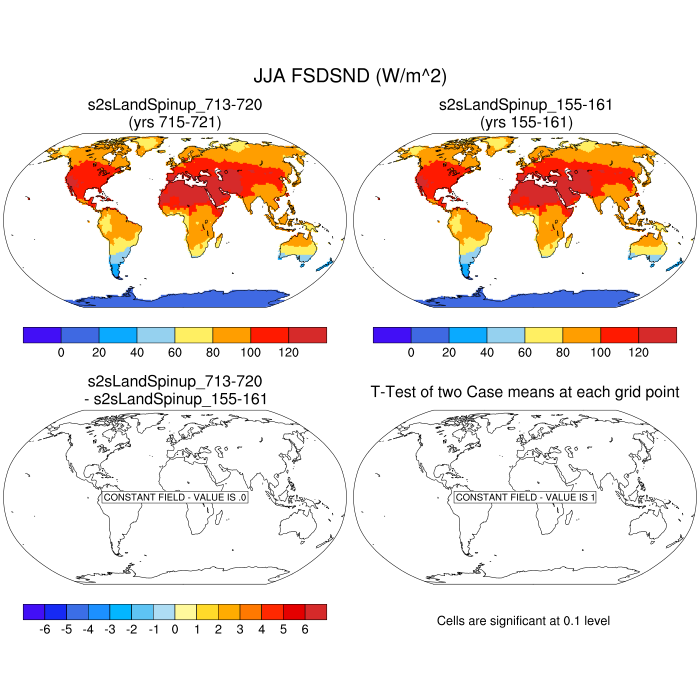
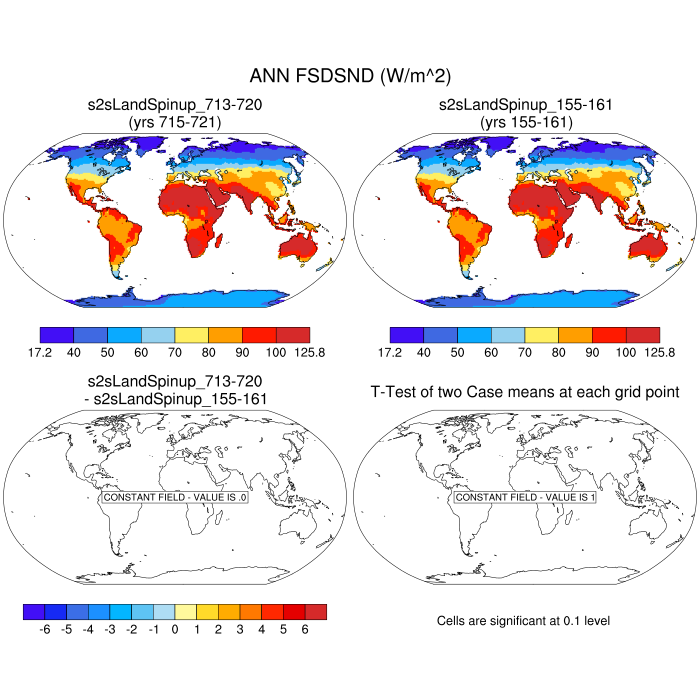
| FSDSND | direct nir incident solar radiation | plot | plot | plot | plot | plot |
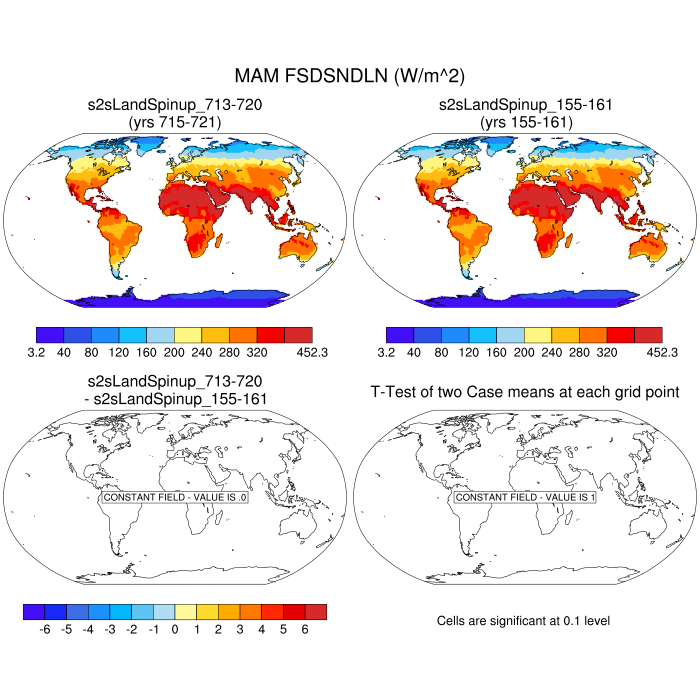
| FSDSNDLN | direct nir incident solar radiation at local noon | plot | plot | plot | plot | plot |
| FSDSNI | diffuse nir incident solar radiation | plot | plot | plot | plot | plot |
| FSDSVD | direct vis incident solar radiation | plot | plot | plot | plot | plot |
| FSDSVDLN | direct vis incident solar radiation at local noon | plot | plot | plot | plot | plot |
| FSDSVI | diffuse vis incident solar radiation | plot | plot | plot | plot | plot |
| FSRND | direct nir reflected solar radiation | plot | plot | plot | plot | plot |
| FSRNDLN | direct nir reflected solar radiation at local noon | plot | plot | plot | plot | plot |
| FSRNI | diffuse nir reflected solar radiation | plot | plot | plot | plot | plot |
| FSRVD | direct vis reflected solar radiation | plot | plot | plot | plot | plot |
| FSRVDLN | direct vis reflected solar radiation at local noon | plot | plot | plot | plot | plot |
| FSRVI | diffuse vis reflected solar radiation | plot | plot | plot | plot | plot |
| Q2M | 2m specific humidity | plot | plot | plot | plot | plot |
| RH2M | 2m relative humidity | plot | plot | plot | plot | plot |
| TREFMNAV | daily minimum of average 2m temperature | plot | plot | plot | plot | plot |
| TREFMXAV | daily maximum of average 2m temperature | plot | plot | plot | plot | plot |
| VBSA | visible black-sky albedo | plot | plot | plot | plot | plot |
| NBSA | near-IR black-sky albedo | plot | plot | plot | plot | plot |
| VWSA | visible white-sky albedo | plot | plot | plot | plot | plot |
| NWSA | near-IR white-sky albedo | plot | plot | plot | plot | plot |
| SOILLIQ (1) | soil liquid water | plot | plot | plot | plot | plot |
| SOILLIQ (5) | soil liquid water | plot | plot | plot | plot | plot |
| SOILLIQ (10) | soil liquid water | plot | plot | plot | plot | plot |
| SOILICE (1) | soil ice | plot | plot | plot | plot | plot |
| SOILICE (5) | soil ice | plot | plot | plot | plot | plot |
| SOILICE (10) | soil ice | plot | plot | plot | plot | plot |
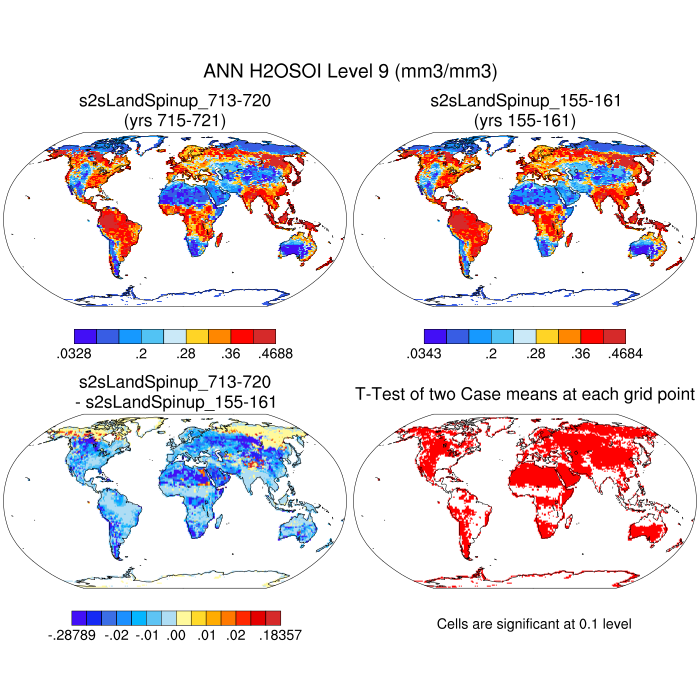
| H2OSOI (1) | volumetric soil water | plot | plot | plot | plot | plot |
| H2OSOI (5) | volumetric soil water | plot | plot | plot | plot | plot |
| H2OSOI (10) | volumetric soil water | plot | plot | plot | plot | plot |
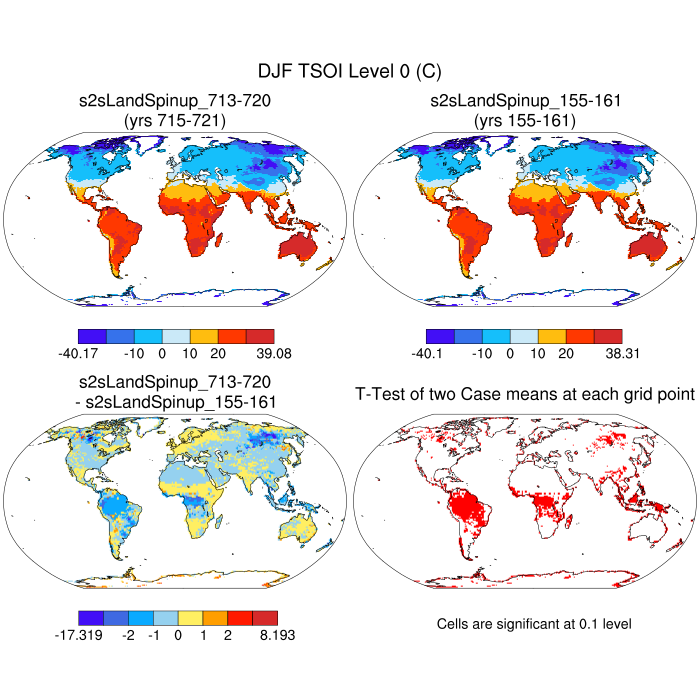
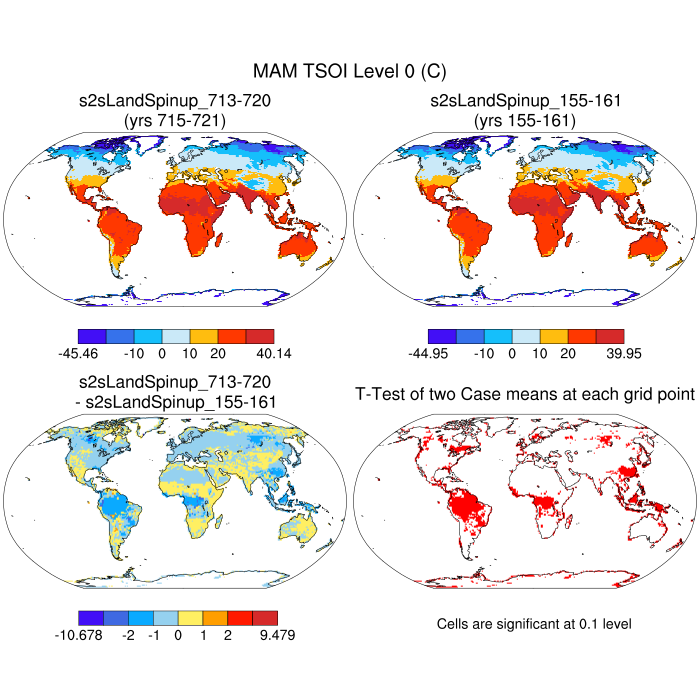
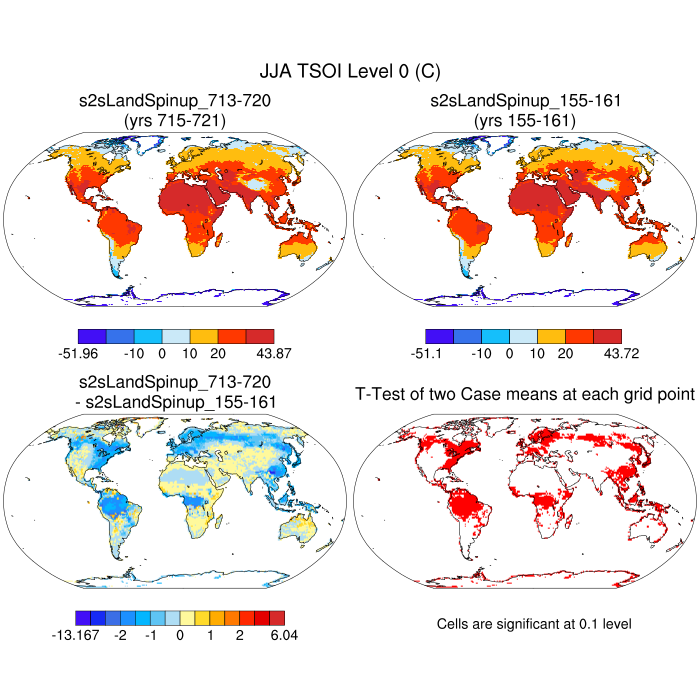
| TSOI (1) | soil temperature | plot | plot | plot | plot | plot |
| TSOI (5) | soil temperature | plot | plot | plot | plot | plot |
| TSOI (10) | soil temperature | plot | plot | plot | plot | plot |
| EVAPFRAC | LHEAT/(LHEAT+FSH) | plot | plot | plot | plot | plot |
| XIM | moisture index | plot | plot | plot | plot | plot |
| P-E | PREC-ET | plot | plot | plot | plot | plot |
| WA | water in the unconfined aquifer | plot | plot | plot | plot | plot |
| ZWT | water table depth | plot | plot | plot | plot | plot |
| TWS | total water storage | plot | plot | plot | plot | plot |
| VOLR | river channel total water storage | plot | plot | plot | plot | plot |
| QCHARGE | aquifer recharge rate | plot | plot | plot | plot | plot |
| FCOV | fractional area with water table at surface | plot | plot | plot | plot | plot |
| PCO2 | partial pressure of CO2 | plot | plot | plot | plot | plot |
| DSTDEP | total dust deposition (dry+wet) from atmosphere | plot | plot | plot | plot | plot |
| DSTFLXT | total surface dust emission | plot | plot | plot | plot | plot |
| OCDEP | total OC deposition (dry+wet) from atmosphere | plot | plot | plot | plot | plot |
| BCDEP | total BC deposition (dry+wet) from atmosphere | plot | plot | plot | plot | plot |
| U10 | 10-m wind | plot | plot | plot | plot | plot |
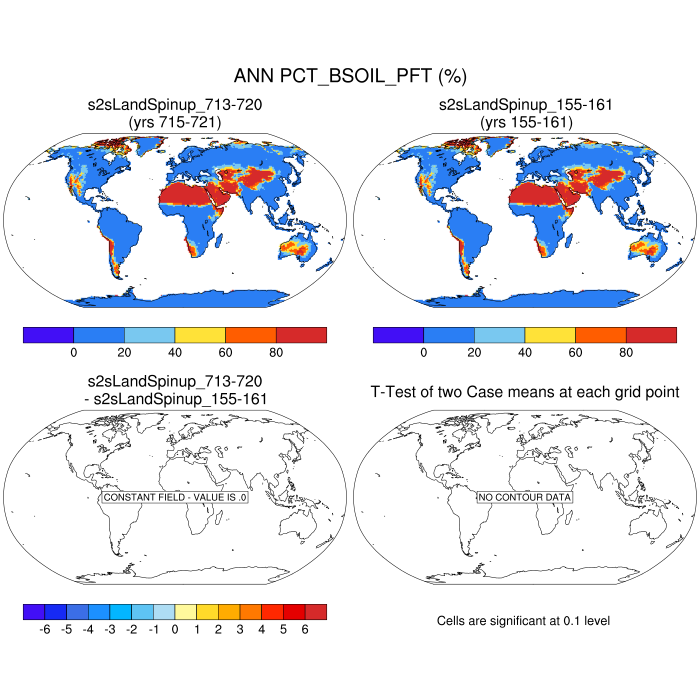
| PCT_BSOIL_PFT | Percent Bare Soil on Natural Veg Landunit | plot | plot | plot | plot | plot |
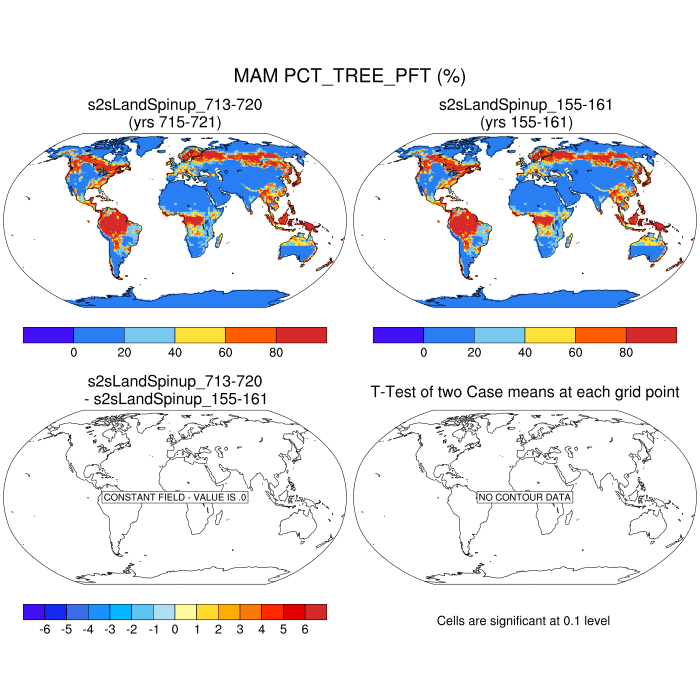
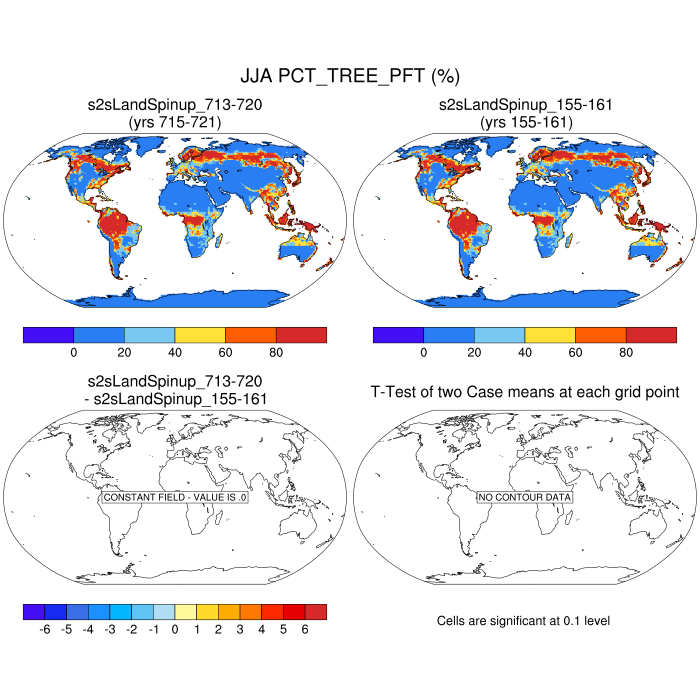
| PCT_TREE_PFT | Percent Tree on Natural Veg Landunit | plot | plot | plot | plot | plot |
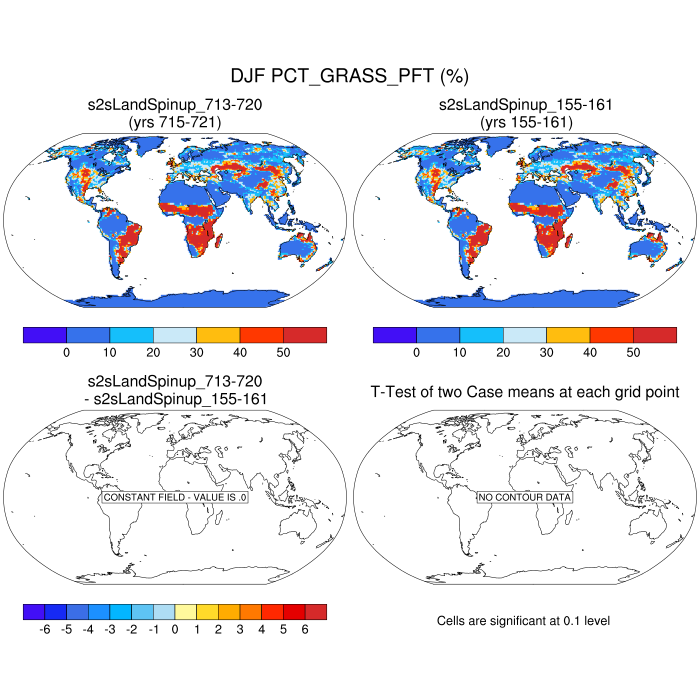
| PCT_GRASS_PFT | Percent Grass on Natural Veg Landunit | plot | plot | plot | plot | plot |
| PCT_SHRUB_PFT | Percent Shrub on Natural Veg Landunit | plot | plot | plot | plot | plot |
| PCT_CROP_PFT | Percent Crop on Natural Veg Landunit or Gridcell (CropModel) | plot | plot | plot | plot | plot |
| ZETA | dimensionless stability parameter | --- | --- | --- | --- | --- |
| NEE | net ecosys exchange of C;incl fire flx;pos for source | plot | plot | plot | plot | plot |
| NEP | net ecosystem production;excl fire flx;pos for sink | plot | plot | plot | plot | plot |
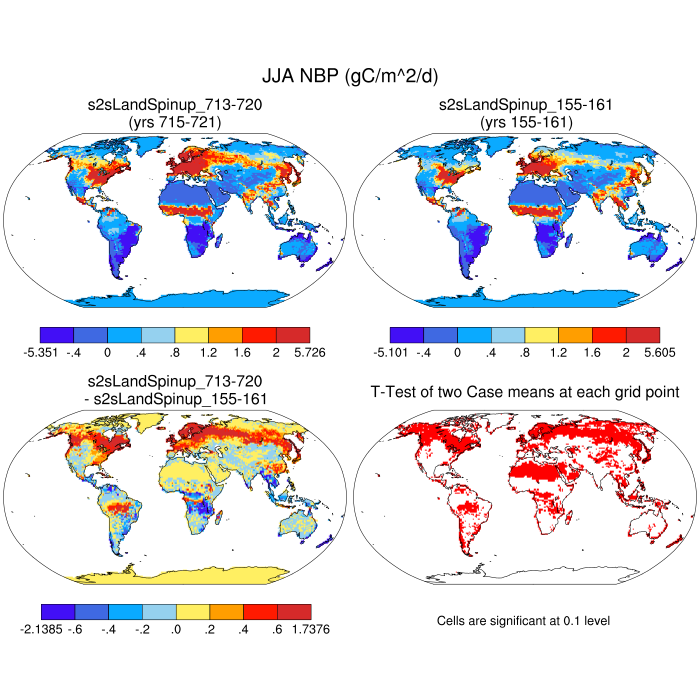
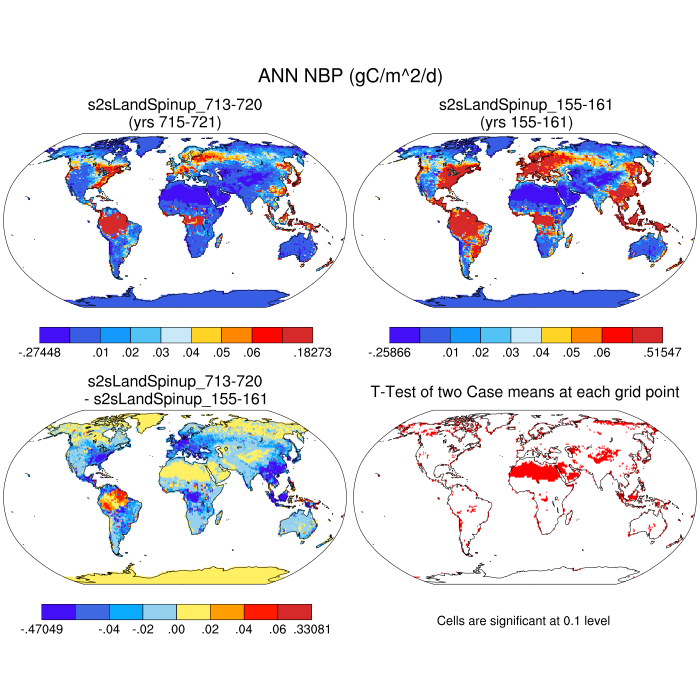
| NBP | net biome production, includes fire, landuse and harvest flux | plot | plot | plot | plot | plot |
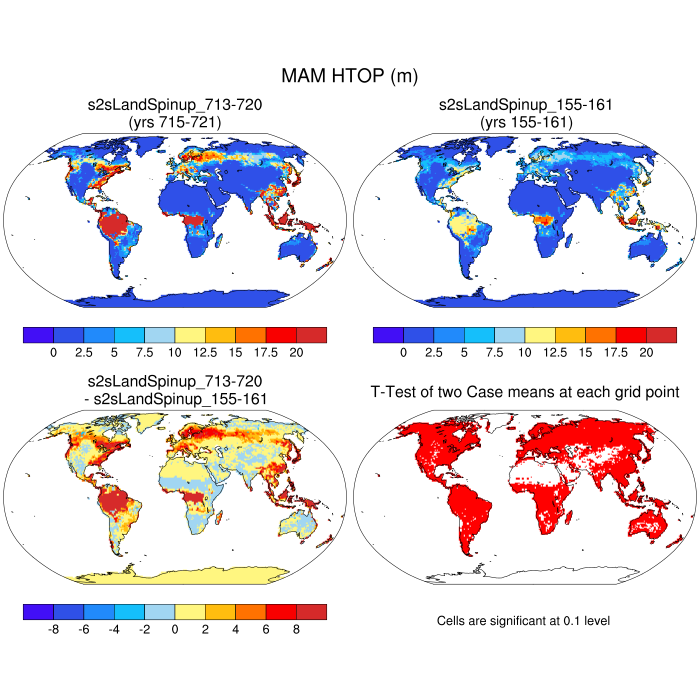
| HTOP | canopy top height | plot | plot | plot | plot | plot |
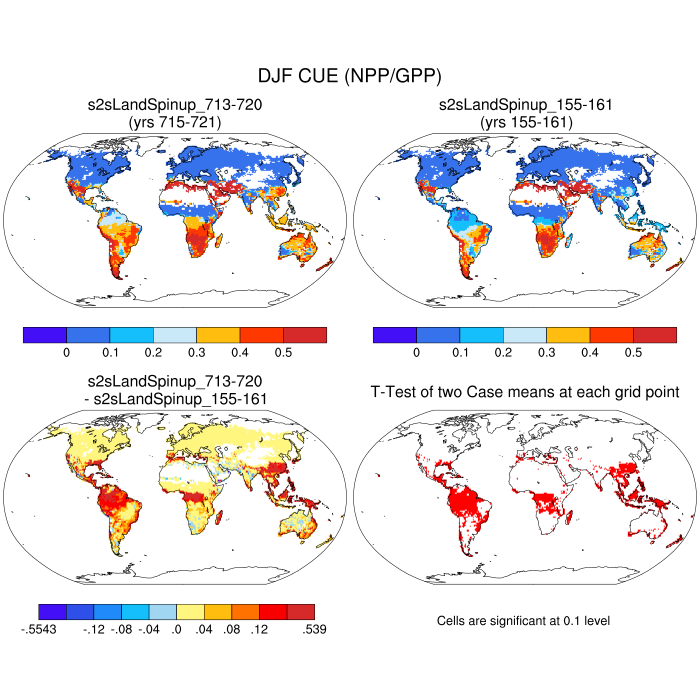
| CUE | carbon use efficiency | plot | plot | plot | plot | plot |
| BTRAN2 | root zone soil moisture factor | --- | --- | --- | --- | --- |
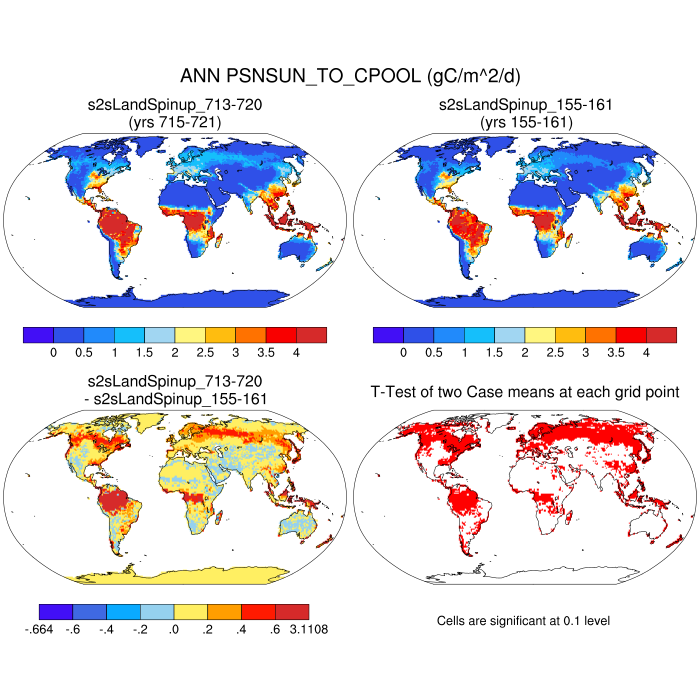
| PSNSUN_TO_CPOOL | GPP from Sunlit Canopy | plot | plot | plot | plot | plot |
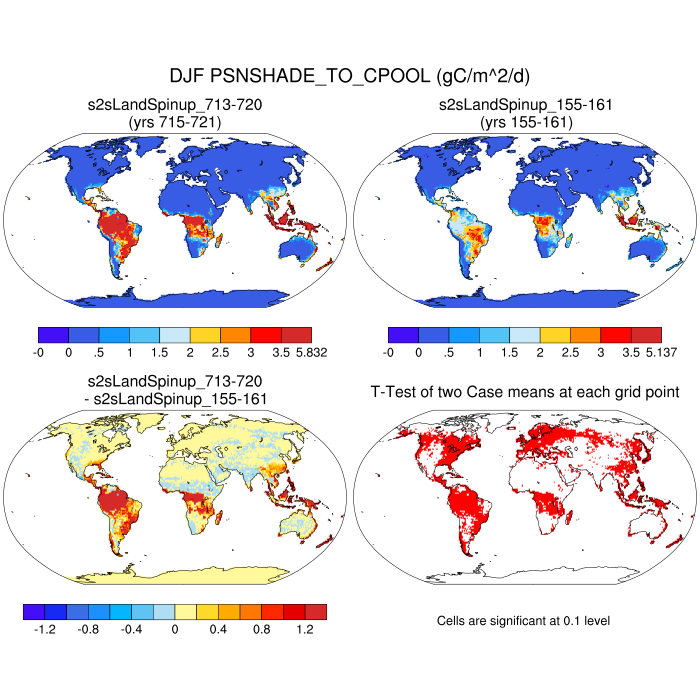
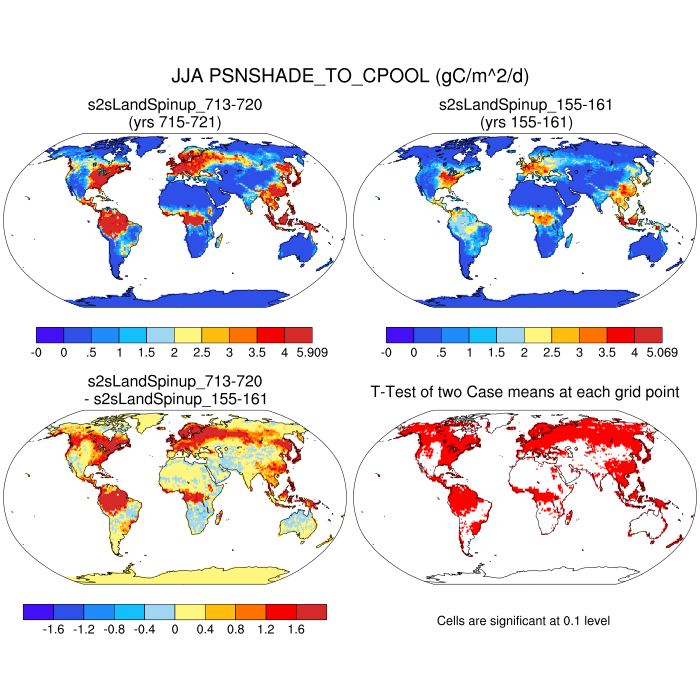
| PSNSHADE_TO_CPOOL | GPP from Shaded Canopy | plot | plot | plot | plot | plot |
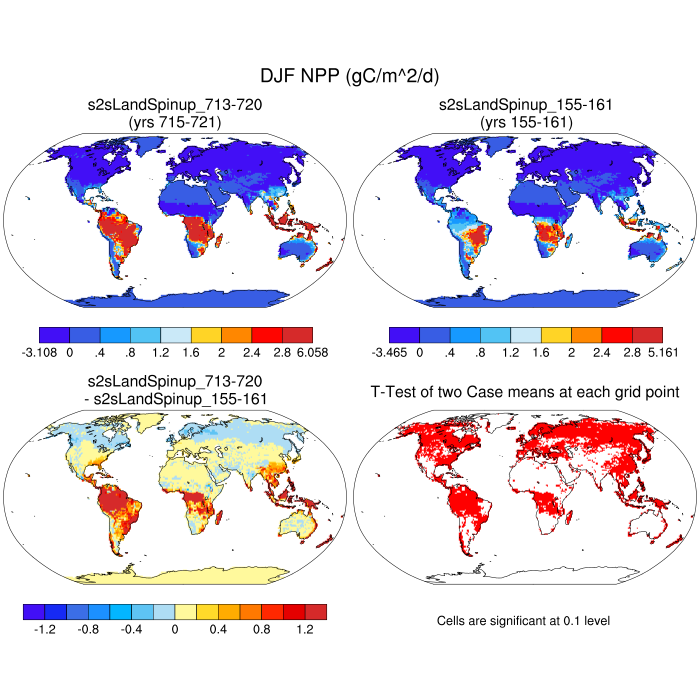
| NPP | net primary production | plot | plot | plot | plot | plot |
| AGNPP | above ground net primary production | plot | plot | plot | plot | plot |
| BGNPP | below ground net primary production | plot | plot | plot | plot | plot |
| MR | maintenance respiration | plot | plot | plot | plot | plot |
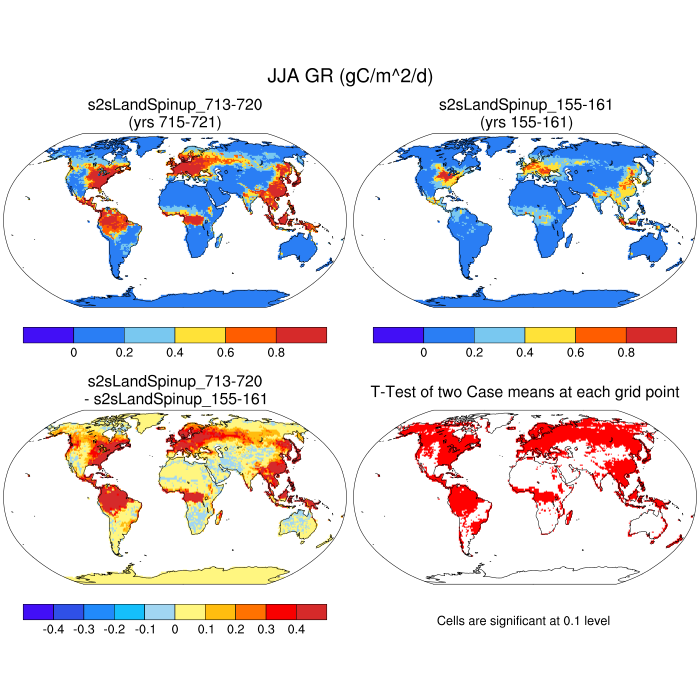
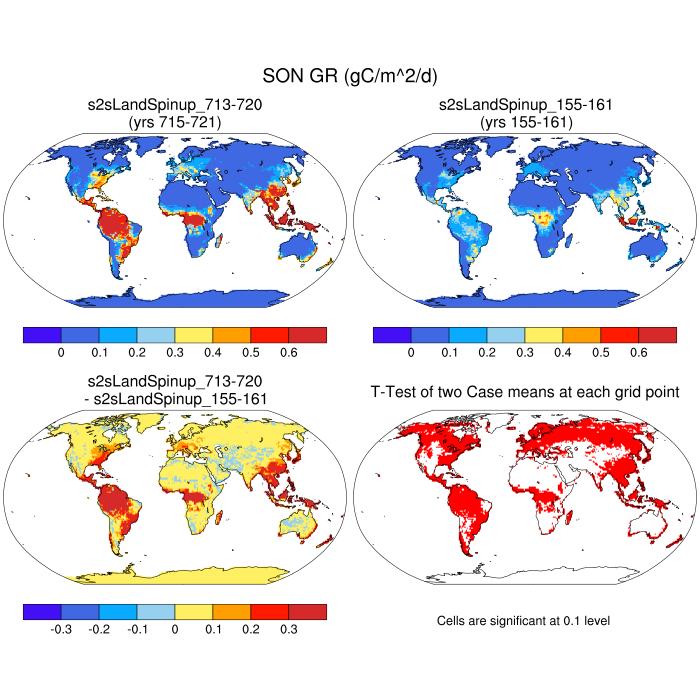
| GR | total growth respiration | plot | plot | plot | plot | plot |
| GRAINC | grain C (does not equal yield) | --- | --- | --- | --- | --- |
| GRAINC_TO_FOOD | grain C to food | --- | --- | --- | --- | --- |
| GRAINC_TO_SEED | grain C to seed | --- | --- | --- | --- | --- |
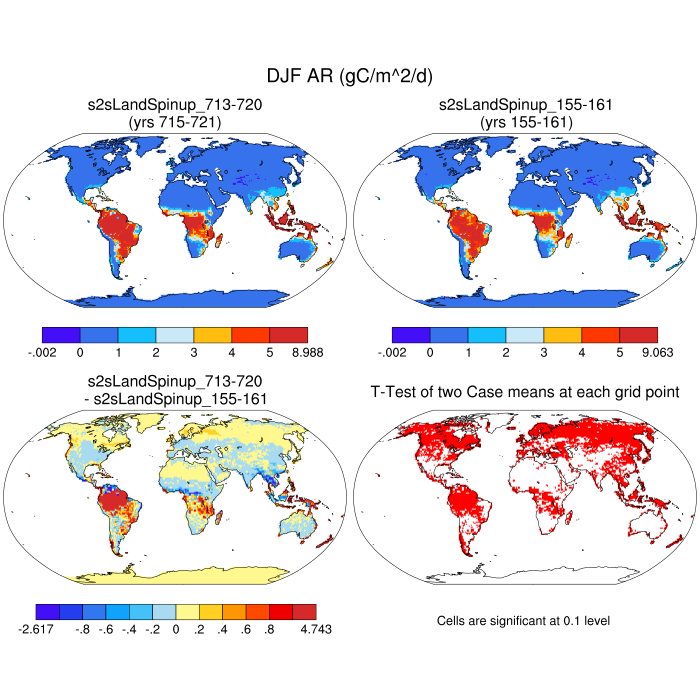
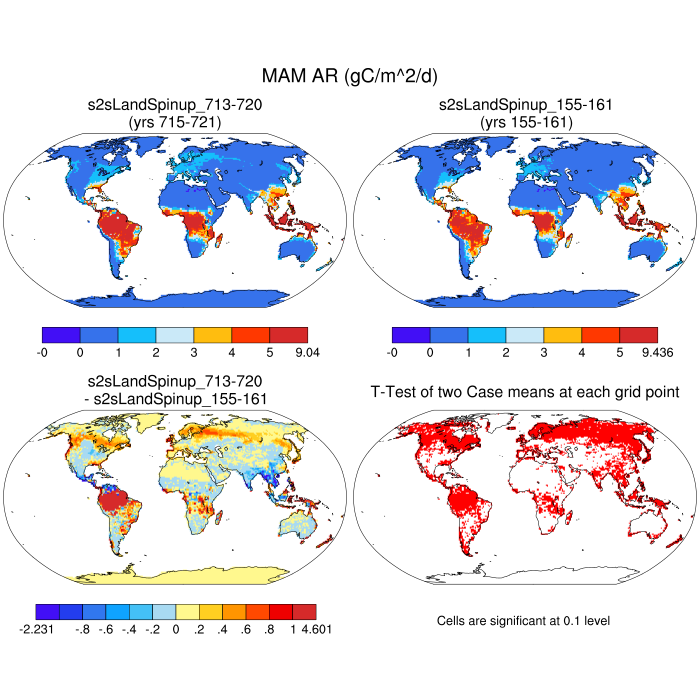
| AR | autotrophic respiration (MR + GR) | plot | plot | plot | plot | plot |
| LITHR | litter hetereotrophic respiration | plot | plot | plot | plot | plot |
| SOMHR | SOM hetereotrophic respiration | plot | plot | plot | plot | plot |
| HR | total hetereotrophic respiration | plot | plot | plot | plot | plot |
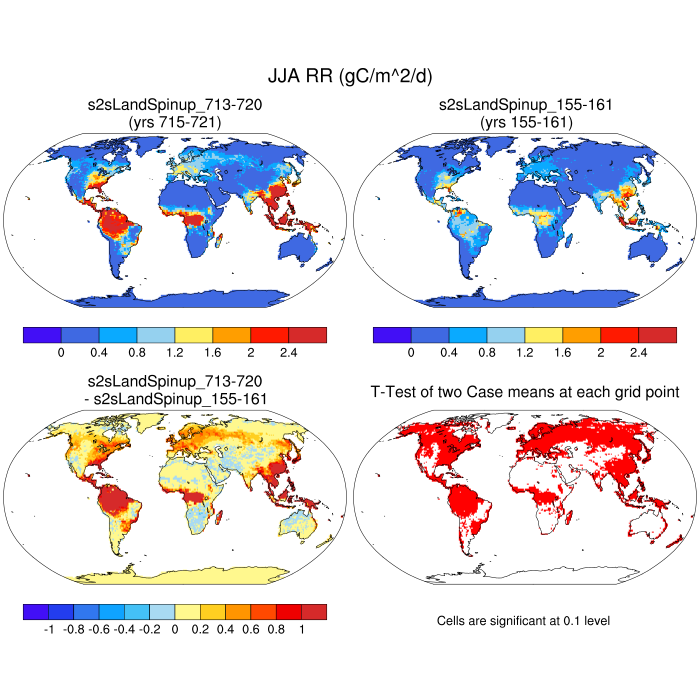
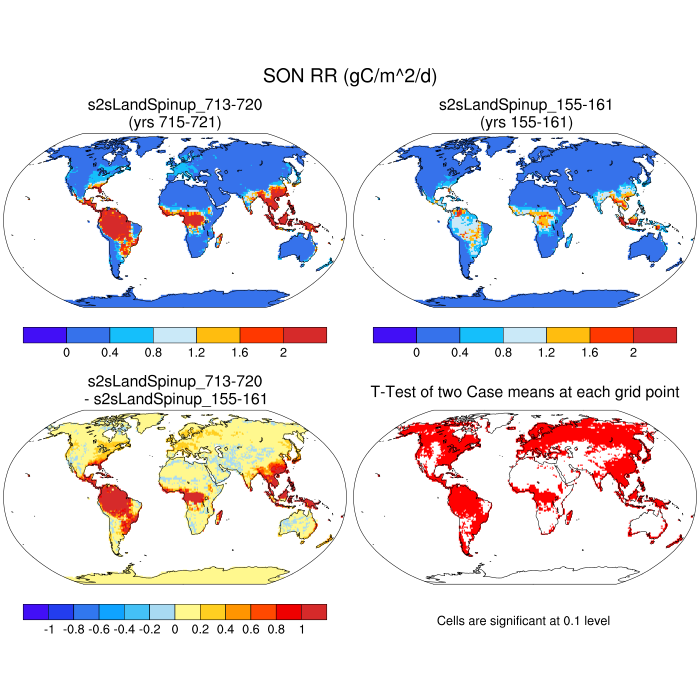
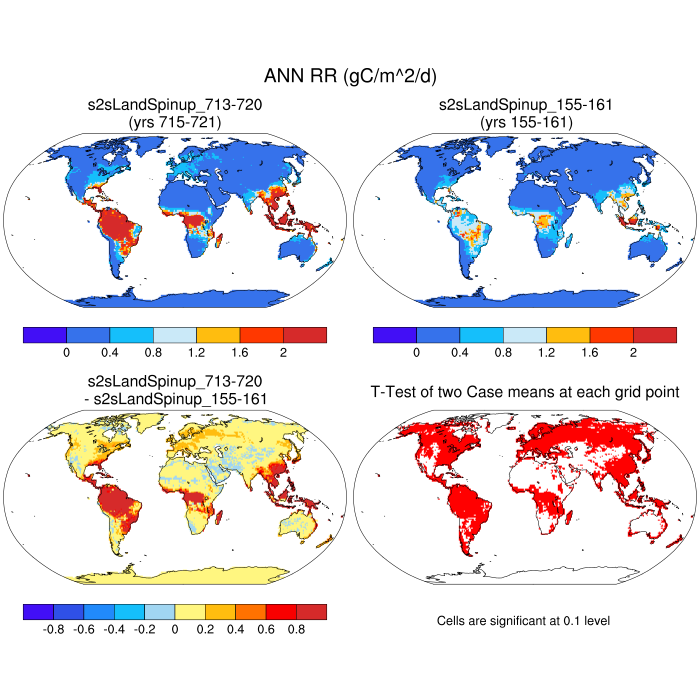
| RR | root respiration (fine root MR + total root GR) | plot | plot | plot | plot | plot |
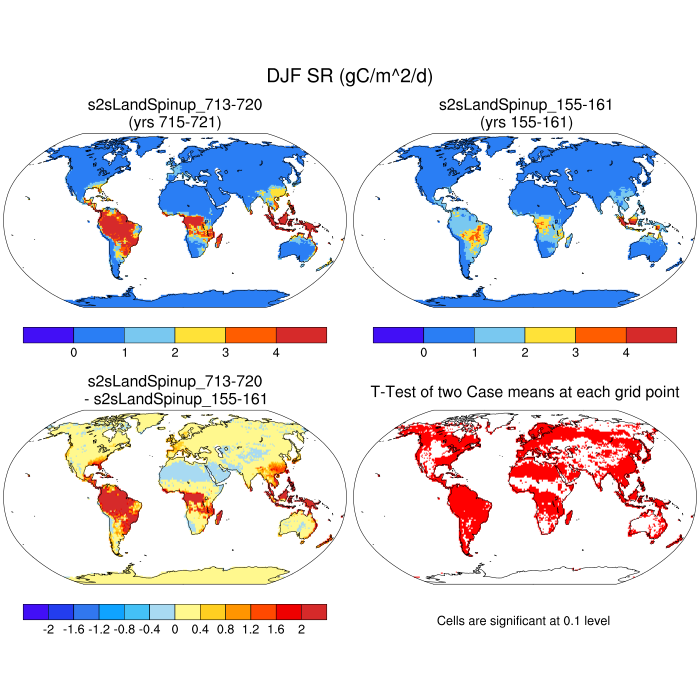
| SR | total soil respiration (HR + root resp) | plot | plot | plot | plot | plot |
| ER | total ecosystem respiration (AR + HR) | plot | plot | plot | plot | plot |
| FINUNDATED | Fractional inundated of veg col | plot | plot | plot | plot | plot |
| FCH4 | Gridcell surface CH4 flux | plot | plot | plot | plot | plot |
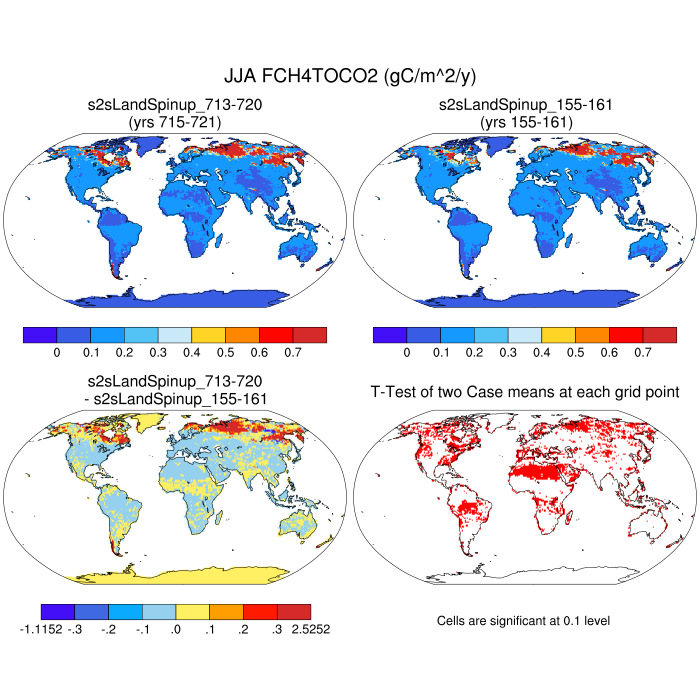
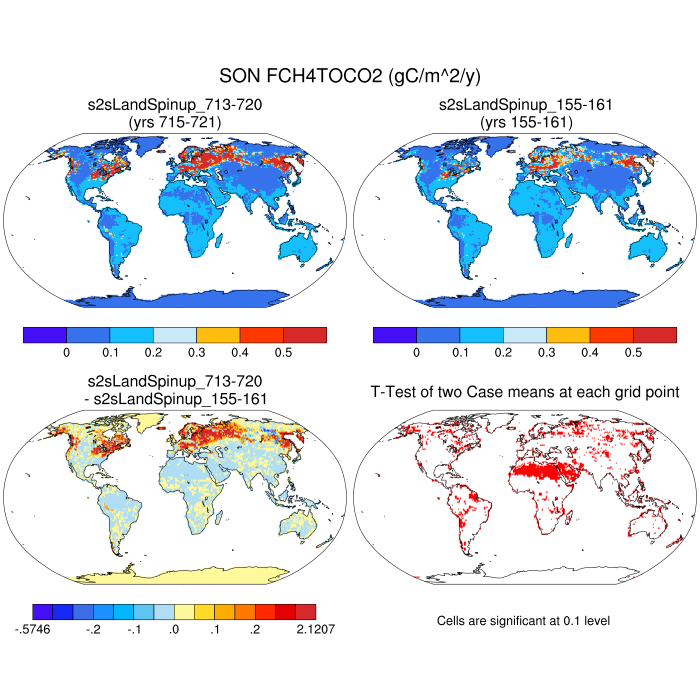
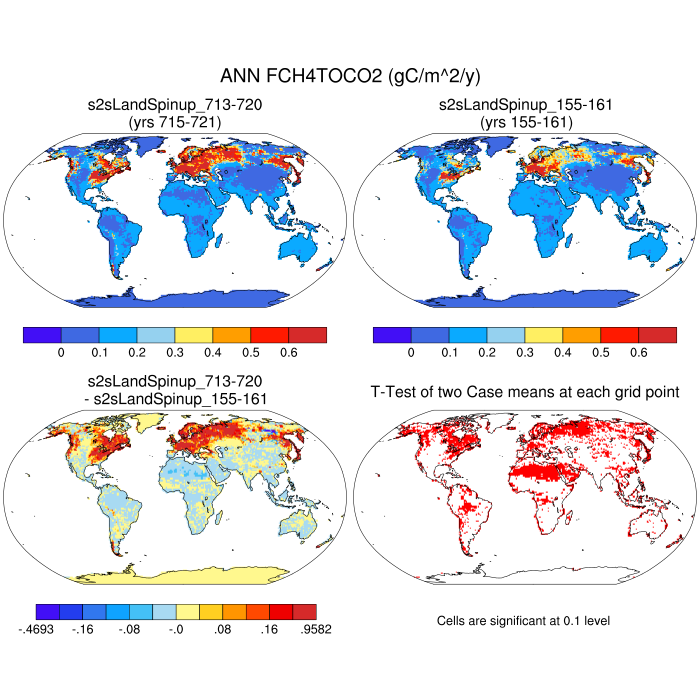
| FCH4TOCO2 | Gridcell oxidation of CH4 to CO2 | plot | plot | plot | plot | plot |
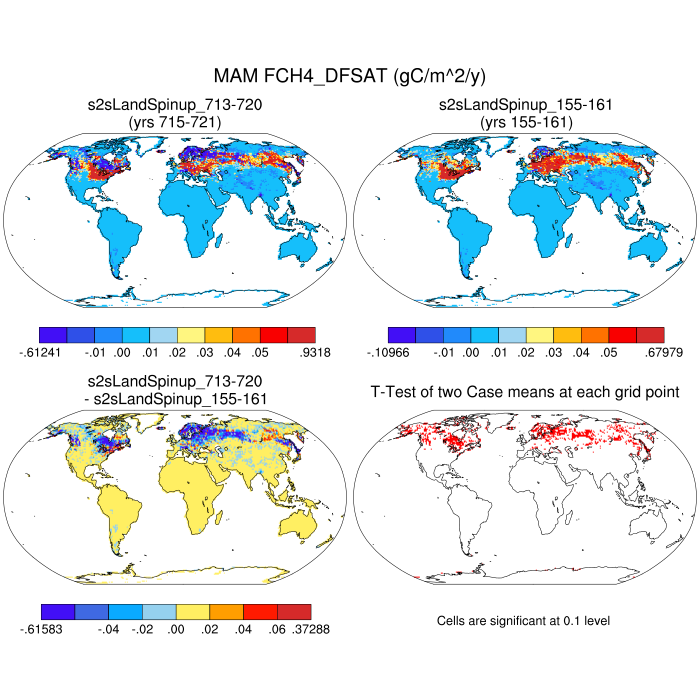
| FCH4_DFSAT | CH4 additional flux | plot | plot | plot | plot | plot |
| CH4PROD | Gridcell total CH4 production | plot | plot | plot | plot | plot |
| CH4_SURF_AERE_SAT | aerenchyma sfc CH4 flx-inundated area | plot | plot | plot | plot | plot |
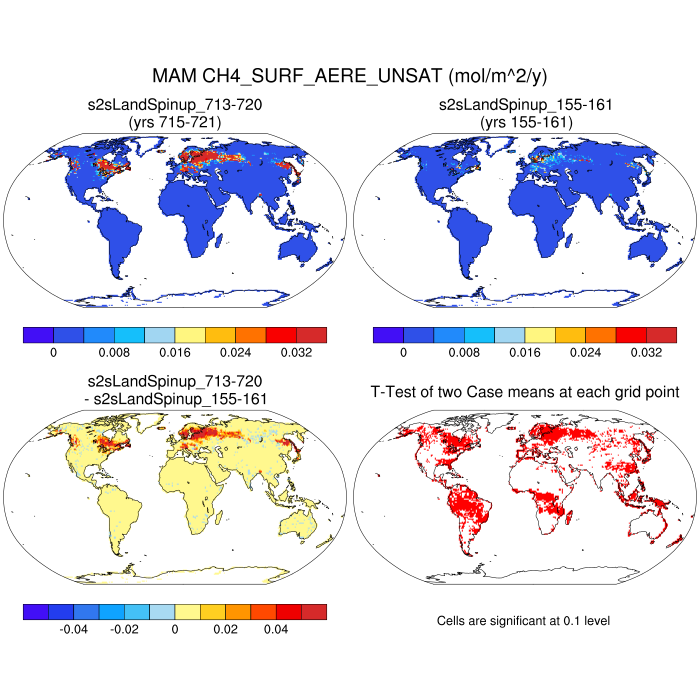
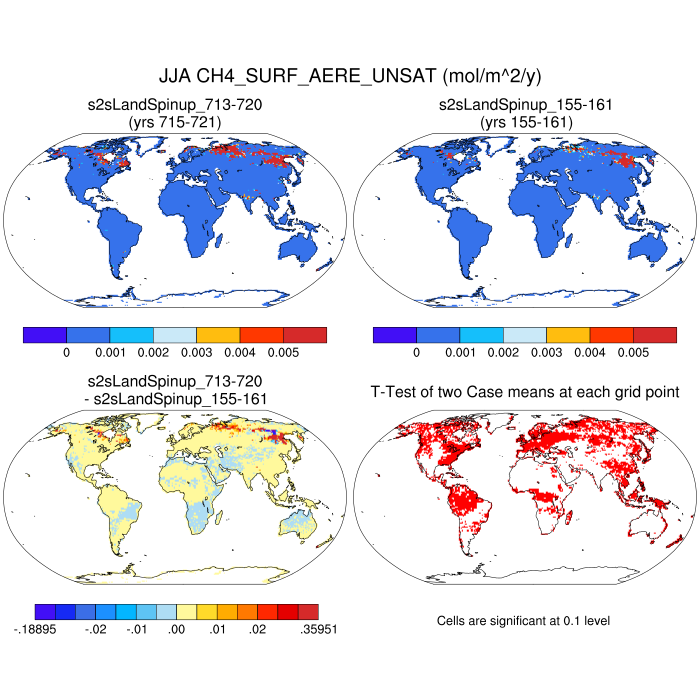
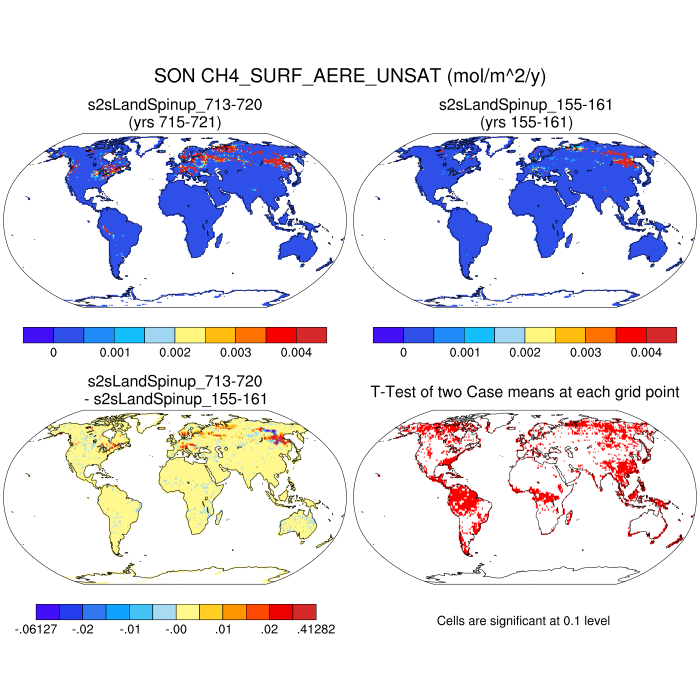
| CH4_SURF_AERE_UNSAT | aerenchyma sfc CH4 flx-non-inundated area | plot | plot | plot | plot | plot |
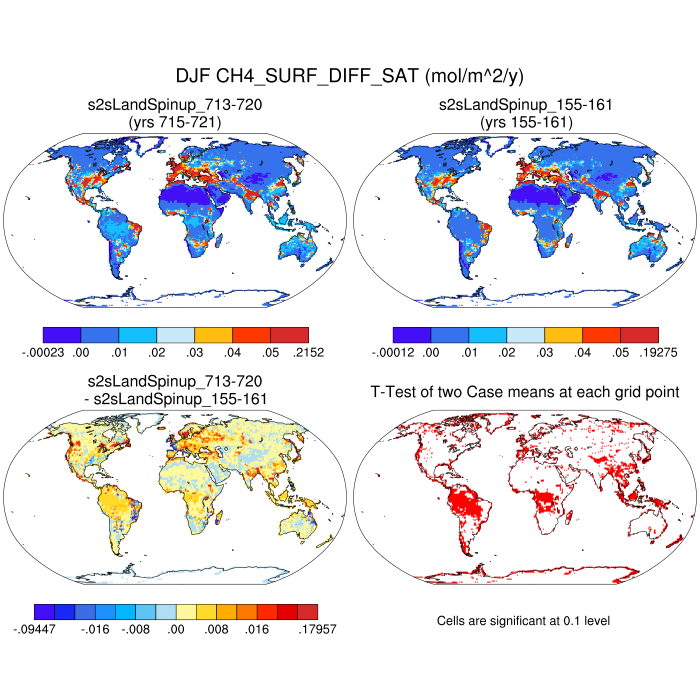
| CH4_SURF_DIFF_SAT | diffusive sfc CH4 flx-inundated/lake area | plot | plot | plot | plot | plot |
| CH4_SURF_DIFF_UNSAT | diffusive sfc CH4 flx-non-inundated area | plot | plot | plot | plot | plot |
| CH4_SURF_EBUL_SAT | ebullition sfc CH4 flx-inundated/lake area | plot | plot | plot | plot | plot |
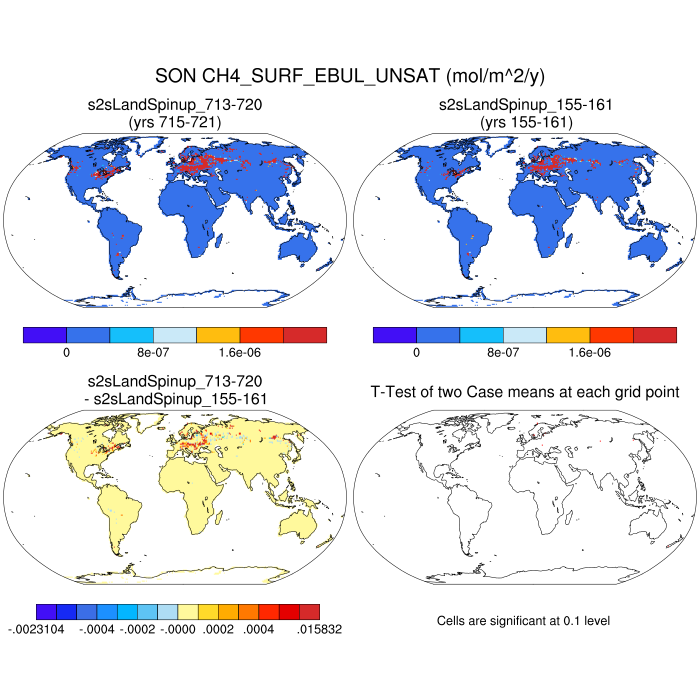
| CH4_SURF_EBUL_UNSAT | ebullition sfc CH4 flx-non-inundated area | plot | plot | plot | plot | plot |
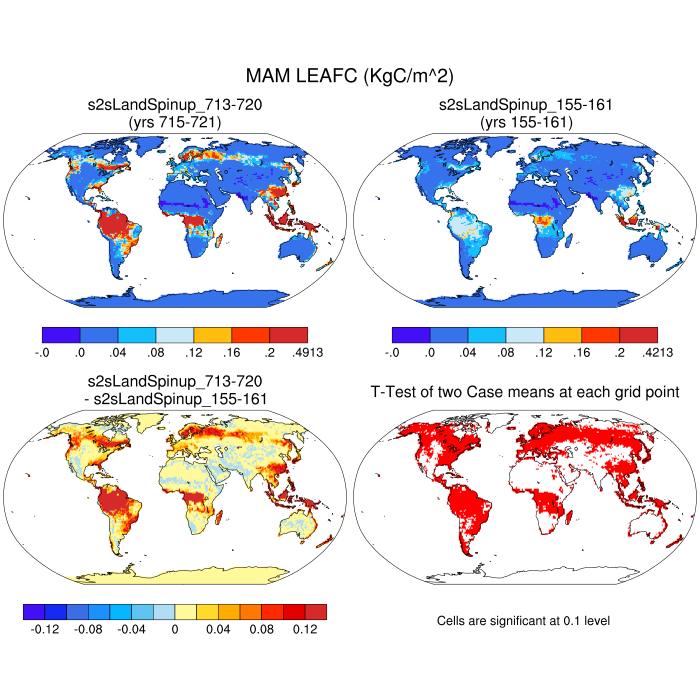
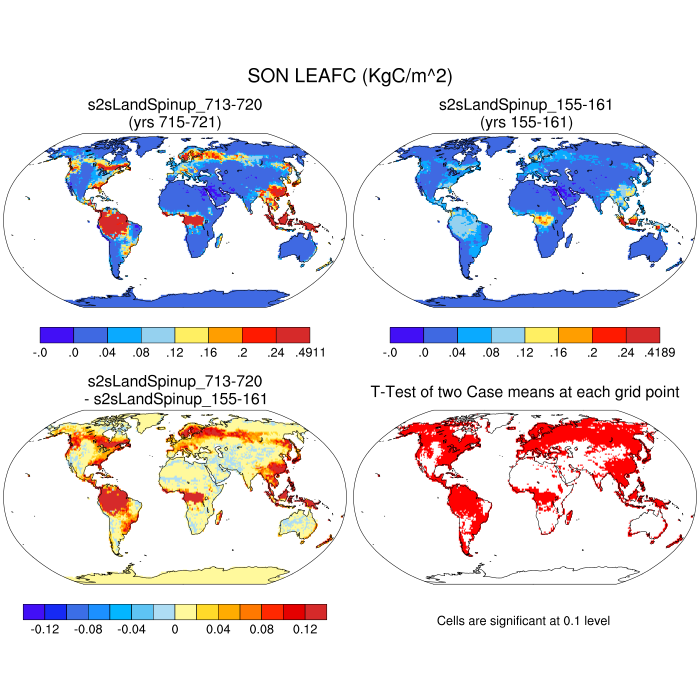
| LEAFC | leaf carbon | plot | plot | plot | plot | plot |
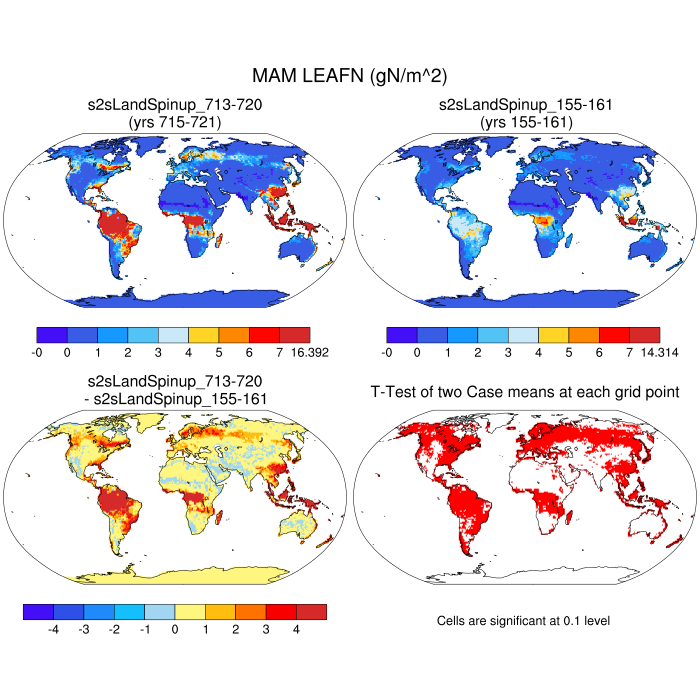
| LEAFN | leaf nitrogen | plot | plot | plot | plot | plot |
| LEAFCN | leaf carbon/nitrogen | plot | plot | plot | plot | plot |
| FROOTC | fine root carbon | plot | plot | plot | plot | plot |
| LIVESTEMC | live stem C | plot | plot | plot | plot | plot |
| DEADSTEMC | dead stem carbon | plot | plot | plot | plot | plot |
| LIVECROOTC | live coarse root carbon | plot | plot | plot | plot | plot |
| DEADCROOTC | dead coarse root carbon | plot | plot | plot | plot | plot |
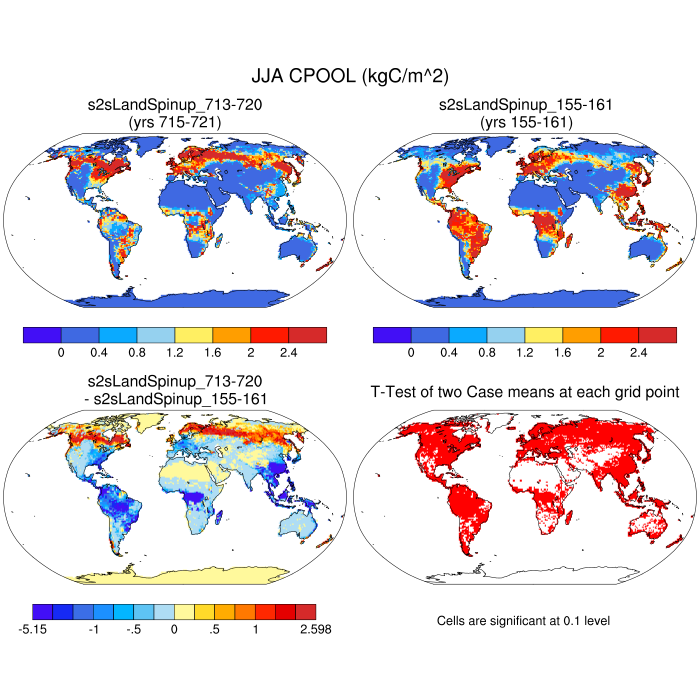
| CPOOL | temporary photosynthate C pool | plot | plot | plot | plot | plot |
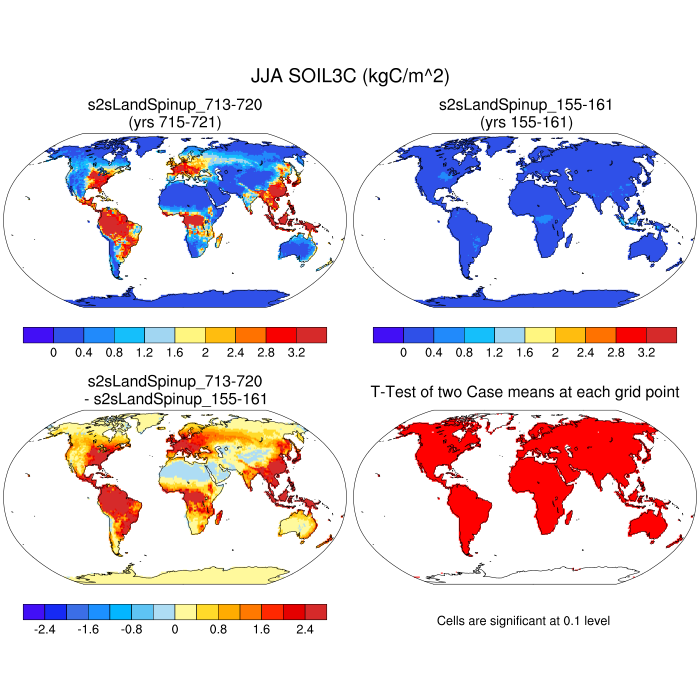
| SOIL3C | Soil organic matter C (slow pool) | plot | plot | plot | plot | plot |
| SOIL4C | Soil organic matter C (slowest pool) | --- | --- | --- | --- | --- |
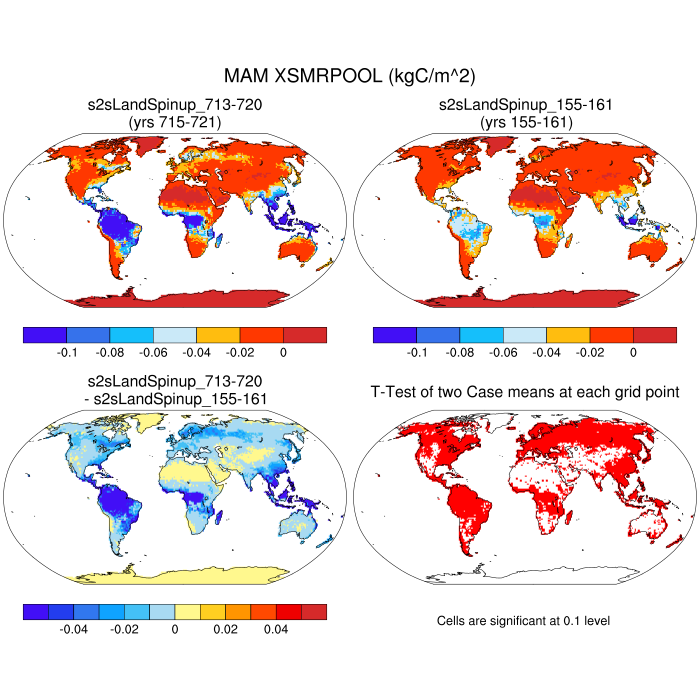
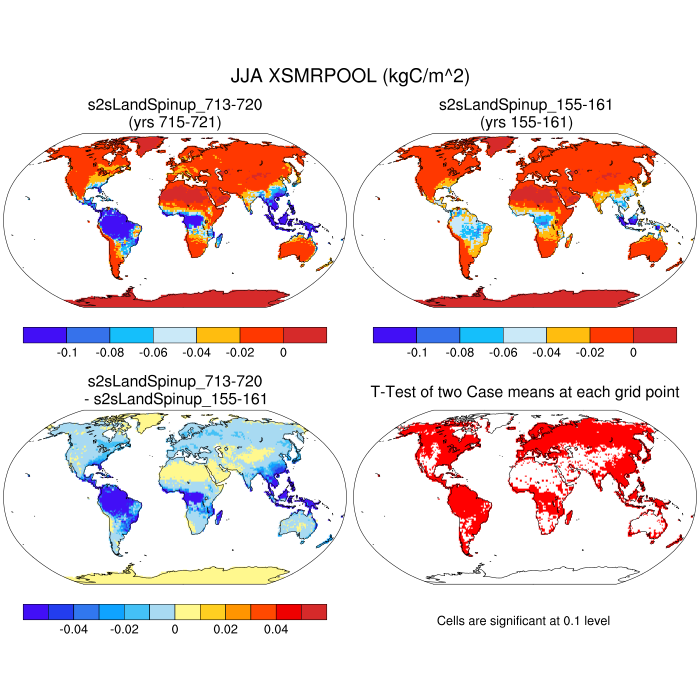
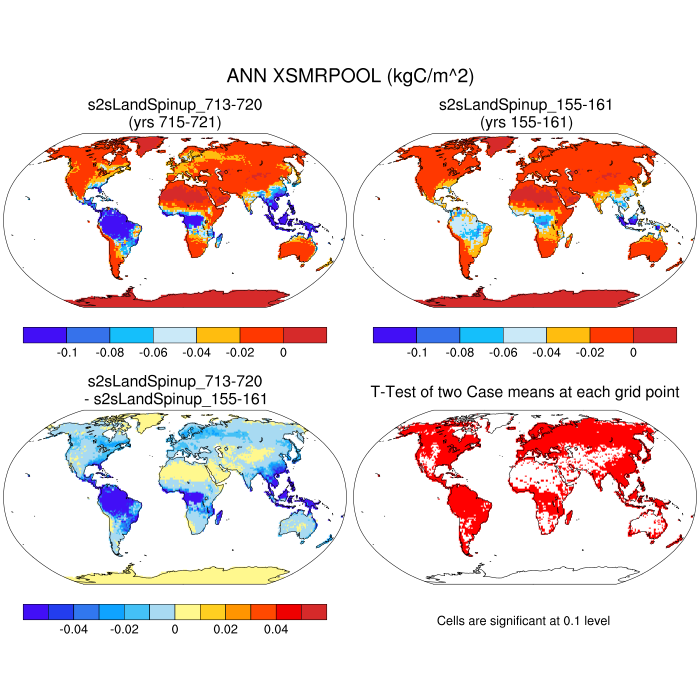
| XSMRPOOL | Temporary Photosynthate C Pool | plot | plot | plot | plot | plot |
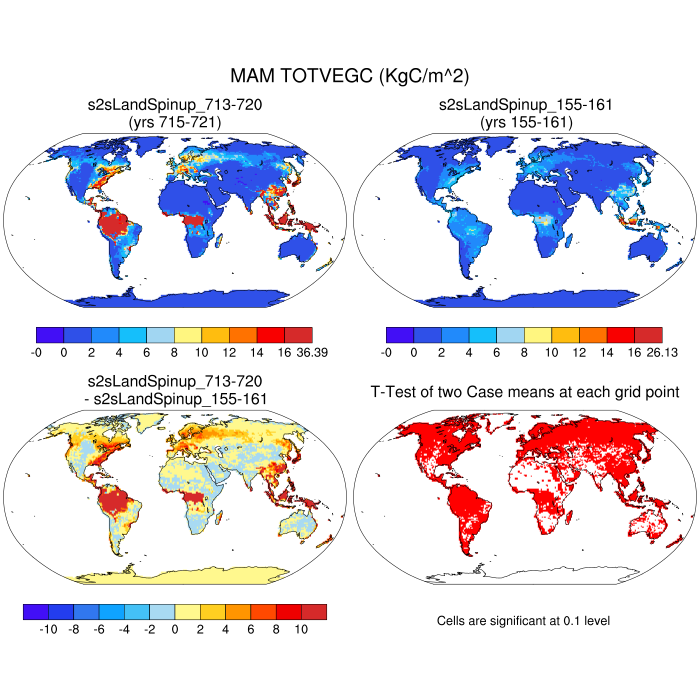
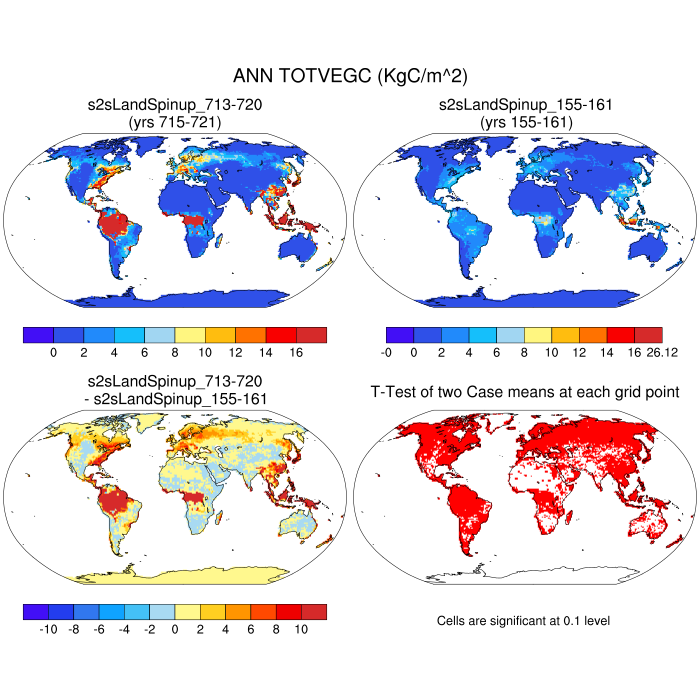
| TOTVEGC | total vegetation C, excluding cpool | plot | plot | plot | plot | plot |
| TOTVEGN | total vegetation N | plot | plot | plot | plot | plot |
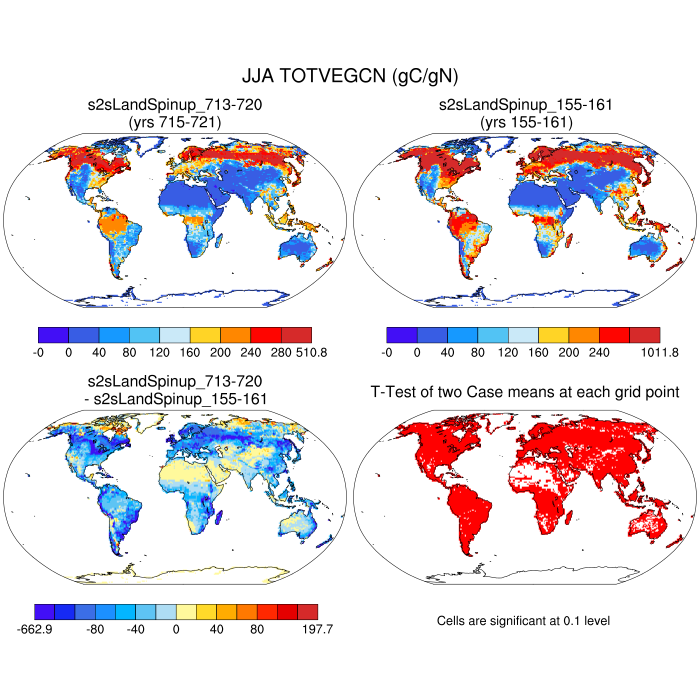
| TOTVEGCN | total vegetation C/N | plot | plot | plot | plot | plot |
| CWDC | coarse woody debris carbon | plot | plot | plot | plot | plot |
| TOTLITC | total litter carbon | plot | plot | plot | plot | plot |
| TOTLITC_1m | total litter carbon to 1m depth | plot | plot | plot | plot | plot |
| TOTSOMC | total SOM carbon | plot | plot | plot | plot | plot |
| TOTSOMC_1m | total SOM carbon to 1 meter depth | plot | plot | plot | plot | plot |
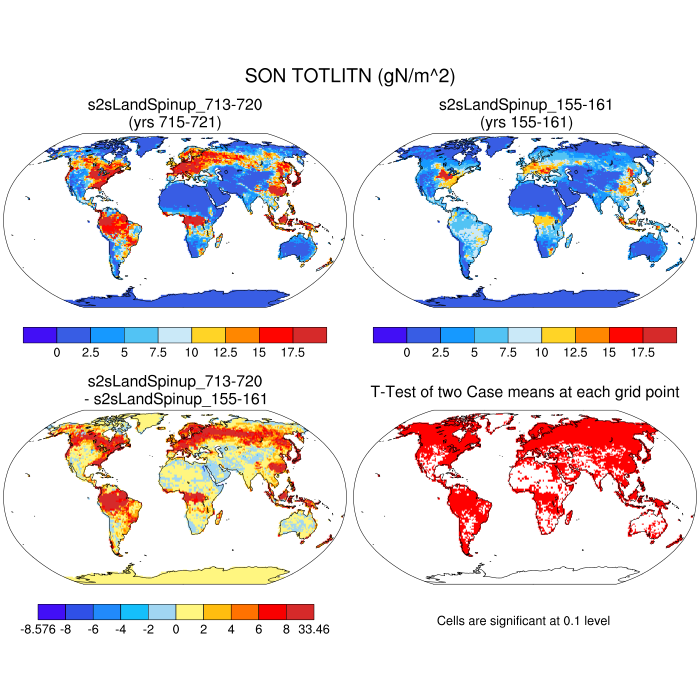
| TOTLITN | total litter N | plot | plot | plot | plot | plot |
| TOTLITN_1m | total litter N to 1m depth | --- | --- | --- | --- | --- |
| TOTSOMN | total soil organic matter N | plot | plot | plot | plot | plot |
| TOTSOMN_1m | total soil organic matter N to 1m depth | --- | --- | --- | --- | --- |
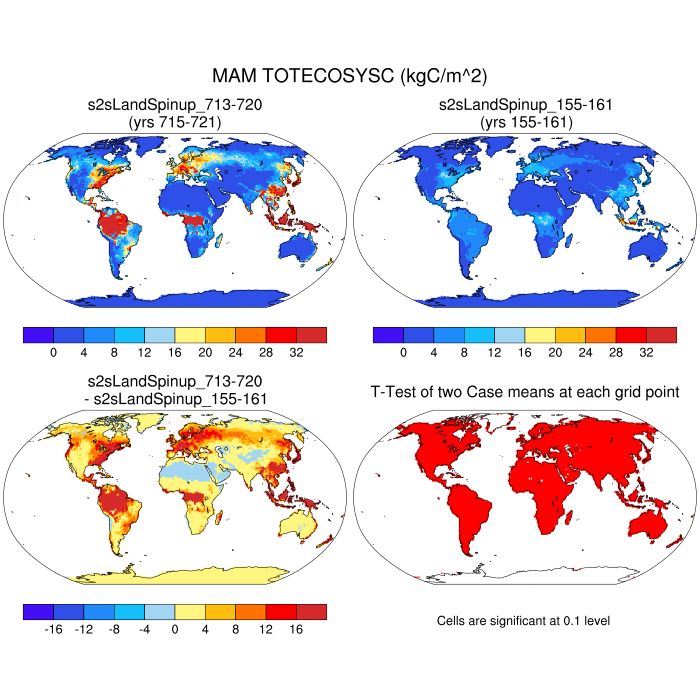
| TOTECOSYSC | total ecosystem C, incl veg but excl cpool | plot | plot | plot | plot | plot |
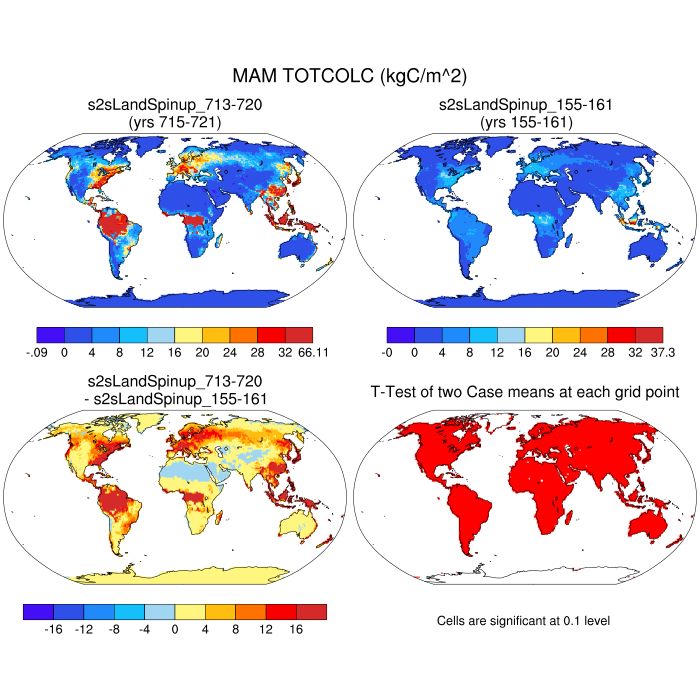
| TOTCOLC | total ecosystem C, incl veg and cpool | plot | plot | plot | plot | plot |
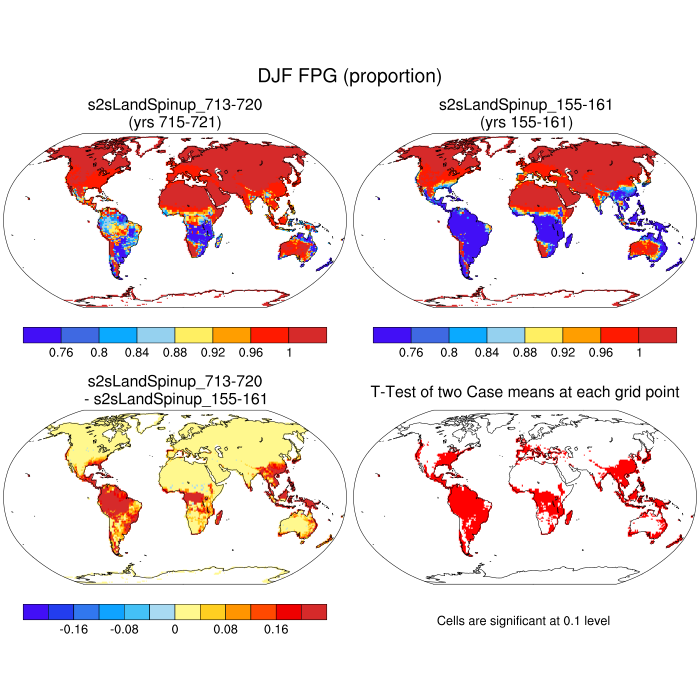
| FPG | fraction of potential GPP | plot | plot | plot | plot | plot |
| FPI | fraction of potential immobilization | plot | plot | plot | plot | plot |
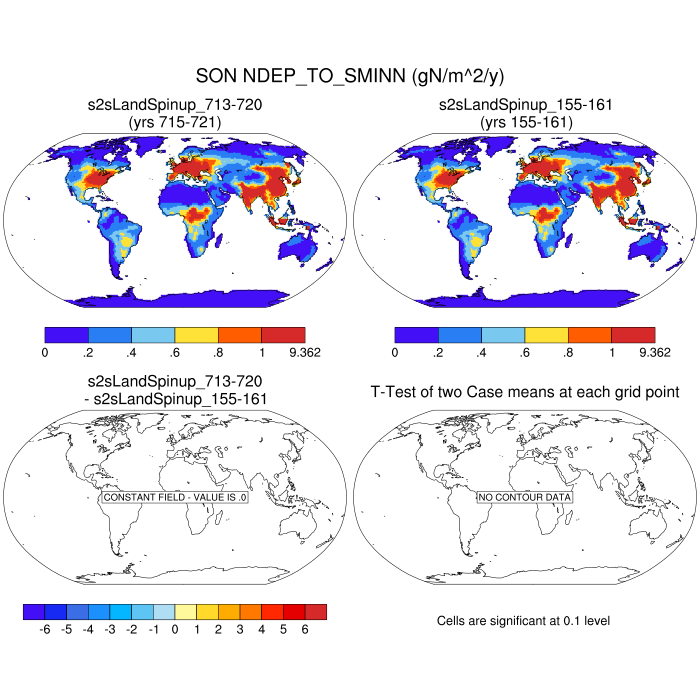
| NDEP_TO_SMINN | nitrogen deposition | plot | plot | plot | plot | plot |
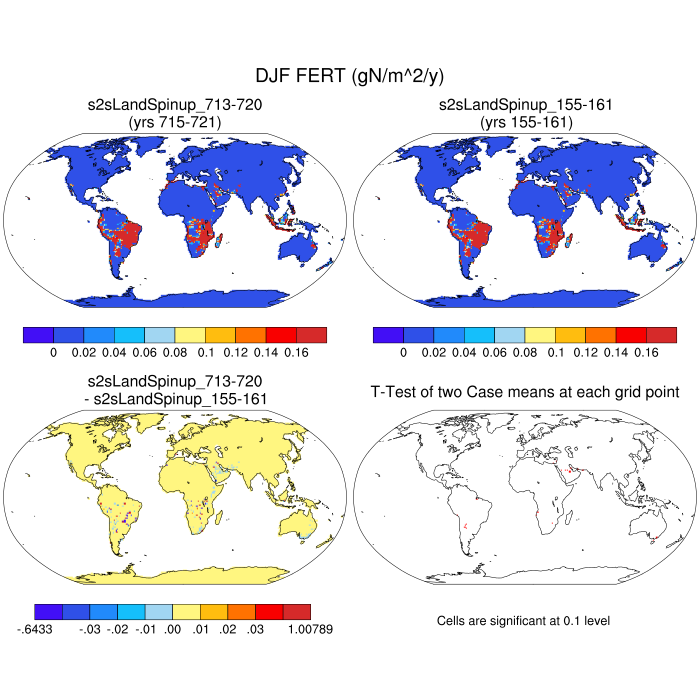
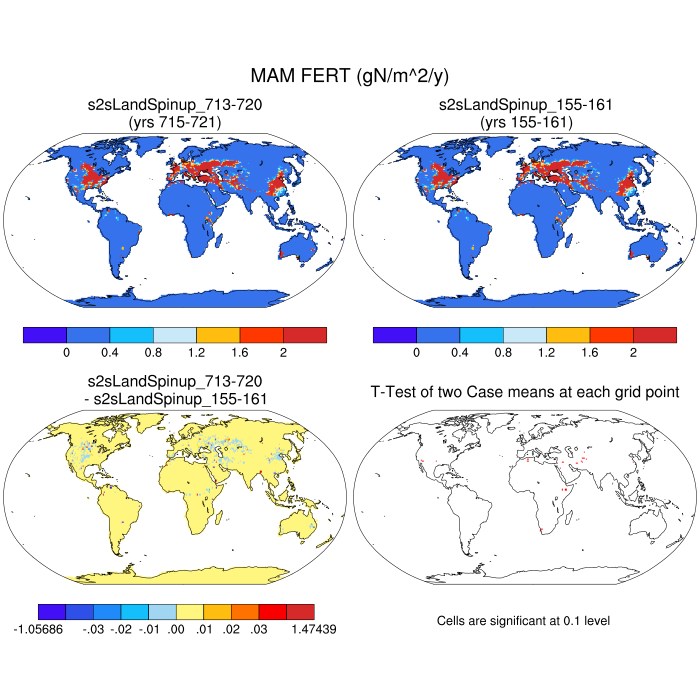
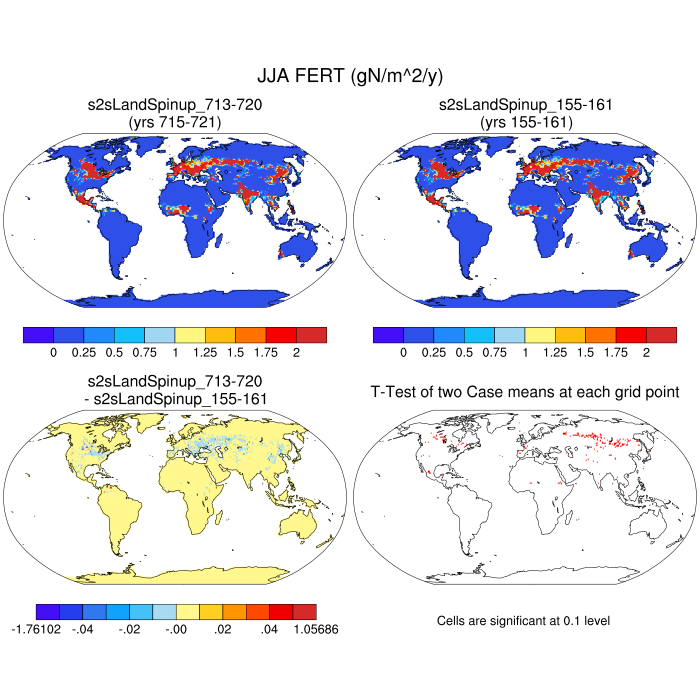
| FERT | fertilizer added | plot | plot | plot | plot | plot |
| FERT_TO_SMINN | fertilizer to soil mineral N | plot | plot | plot | plot | plot |
| NFERTILIZATION | fertilizer added | --- | --- | --- | --- | --- |
| POTENTIAL_IMMOB | Potential Immobilization | plot | plot | plot | plot | plot |
| ACTUAL_IMMOB | Actual Immobilization | plot | plot | plot | plot | plot |
| GROSS_NMIN | Gross N Mineralization | plot | plot | plot | plot | plot |
| NET_NMIN | Net N Mineralization | plot | plot | plot | plot | plot |
| NDEPLOY | Total N Deployed in New Growth | plot | plot | plot | plot | plot |
| RETRANSN_TO_NPOOL | Retranslocated N to NPool | plot | plot | plot | plot | plot |
| SMINN_TO_NPOOL | Mineral N to NPool | plot | plot | plot | plot | plot |
| DENIT | Total Denitrification | plot | plot | plot | plot | plot |
| SOIL3N | soil organic matter N (slow pool) | plot | plot | plot | plot | plot |
| SOIL4N | Soil organic matter N (slowest pool) | --- | --- | --- | --- | --- |
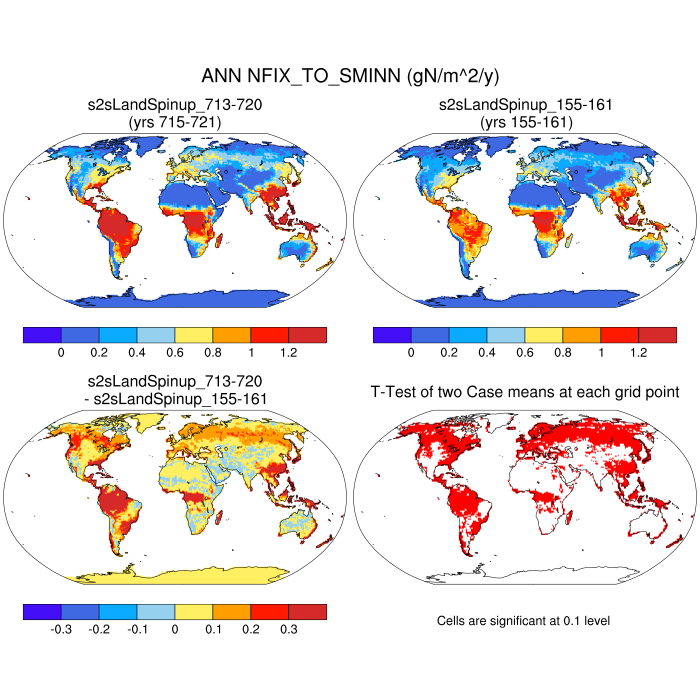
| NFIX_TO_SMINN | nitrogen fixation | plot | plot | plot | plot | plot |
| NAM | AM-associated N uptake flux | --- | --- | --- | --- | --- |
| NECM | ECM-associated N uptake flux | --- | --- | --- | --- | --- |
| NFIX | Symbiotic BNF uptake flux | --- | --- | --- | --- | --- |
| NRETRANS | Retranslocated N uptake flux | --- | --- | --- | --- | --- |
| NPP_NUPTAKE | total carbon used by N uptake in FUN | --- | --- | --- | --- | --- |
| NUPTAKE_FRACTION | NPP_NUPTAKE/(NPP_NUPTAKE+NPP) | --- | --- | --- | --- | --- |
| FFIX_TO_SMINN | free living N fixation to soil mineral N | --- | --- | --- | --- | --- |
| NPP_NFIX | Symbiotic BNF uptake used C | --- | --- | --- | --- | --- |
| NPP_NACTIVE | Mycorrhizal N uptake used C | --- | --- | --- | --- | --- |
| NPP_NRETRANS | retranslocated N uptake flux | --- | --- | --- | --- | --- |
| SUPPLEMENT_TO_SMINN | supplement to mineral nitrogen | plot | plot | plot | plot | plot |
| SMINN_LEACHED | Nitrogen Leached | --- | --- | --- | --- | --- |
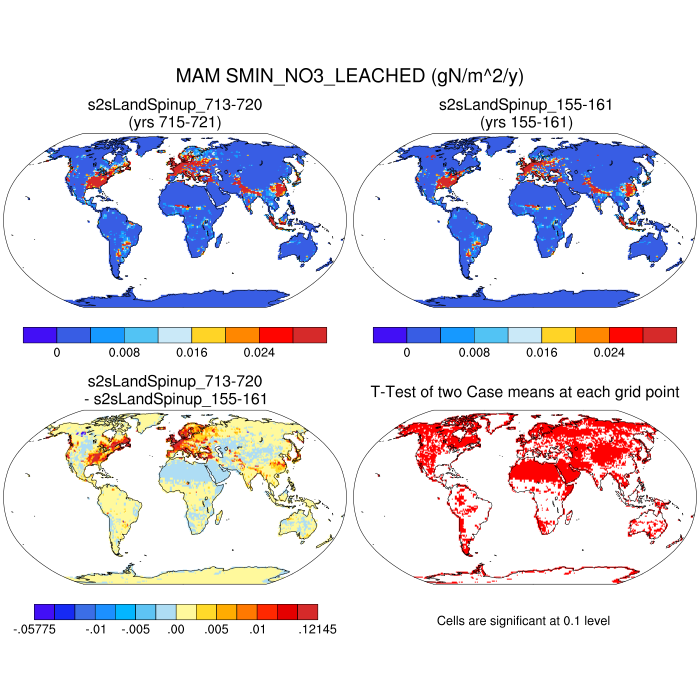
| SMIN_NO3_LEACHED | Soil NO3 pool loss to leaching | plot | plot | plot | plot | plot |
| SMIN_NO3_RUNOFF | Soil NO3 pool loss to runoff | plot | plot | plot | plot | plot |
| SMINN | soil mineral N | plot | plot | plot | plot | plot |
| RETRANSN | plant pool of retranslocated N | plot | plot | plot | plot | plot |
| COL_FIRE_CLOSS | total column-level fire C loss | --- | --- | --- | --- | --- |
| PFT_FIRE_CLOSS | total pft-level fire C loss | plot | plot | plot | plot | plot |
| COL_FIRE_NLOSS | total column-level fire N loss | --- | --- | --- | --- | --- |
| PFT_FIRE_NLOSS | total pft-level fire N loss | plot | plot | plot | plot | plot |
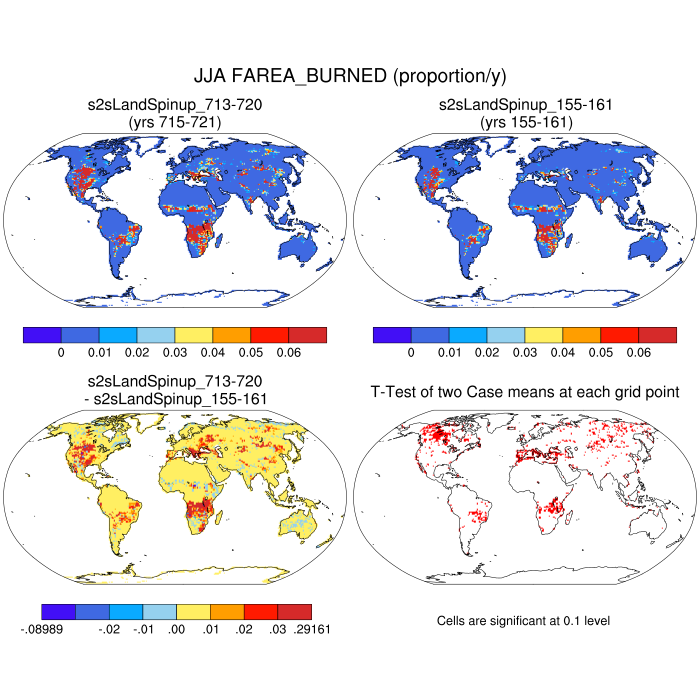
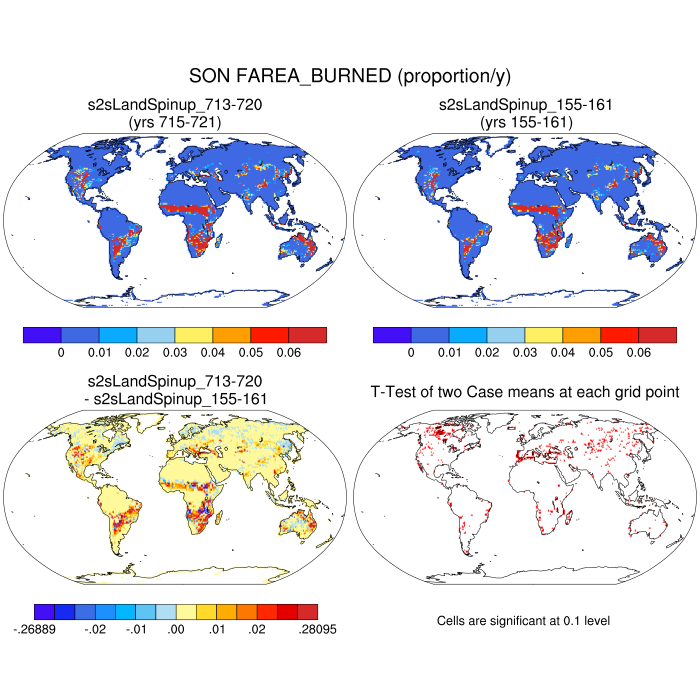
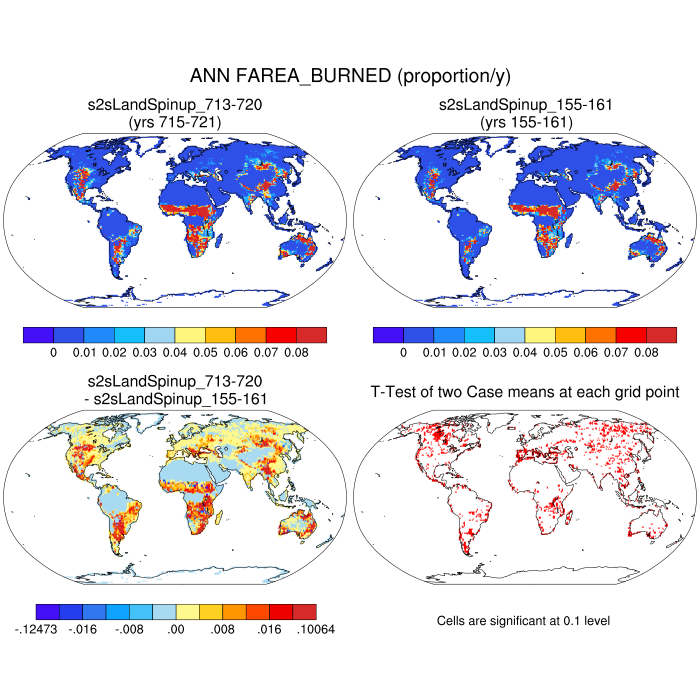
| FAREA_BURNED | fractional area burned | plot | plot | plot | plot | plot |
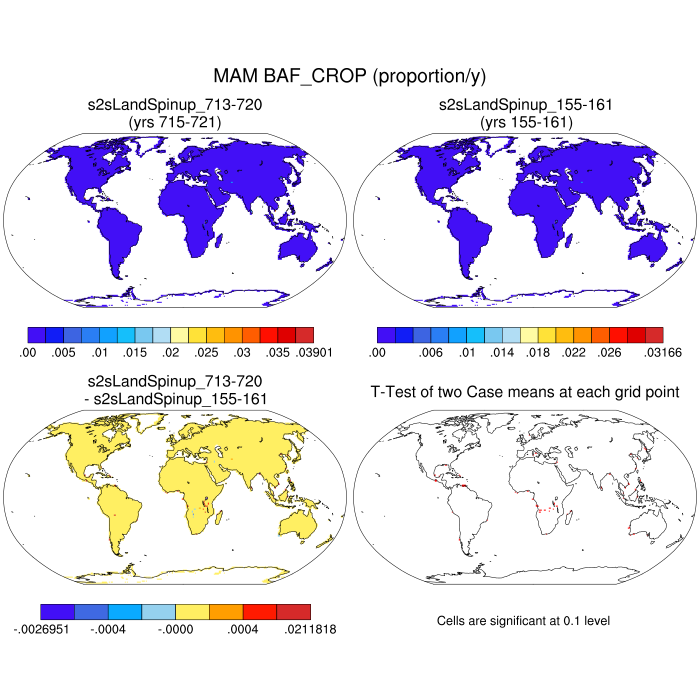
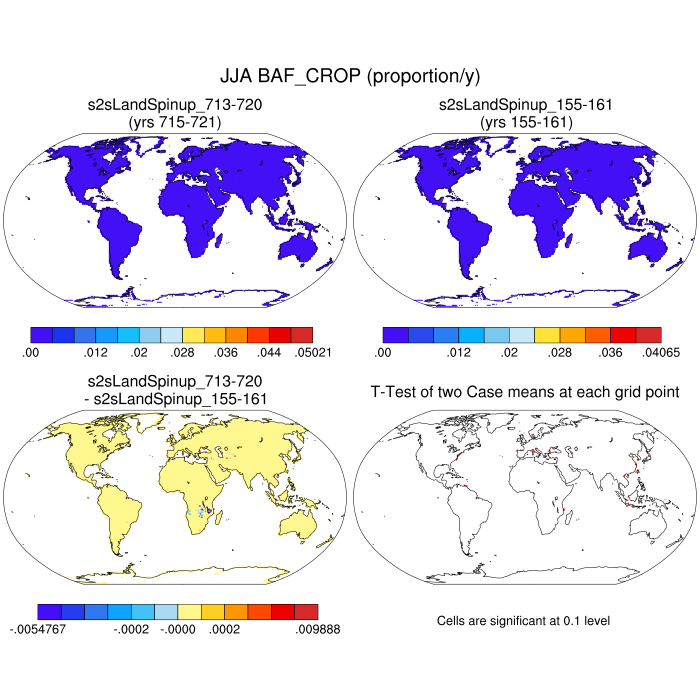
| BAF_CROP | fractional area burned - crop | plot | plot | plot | plot | plot |
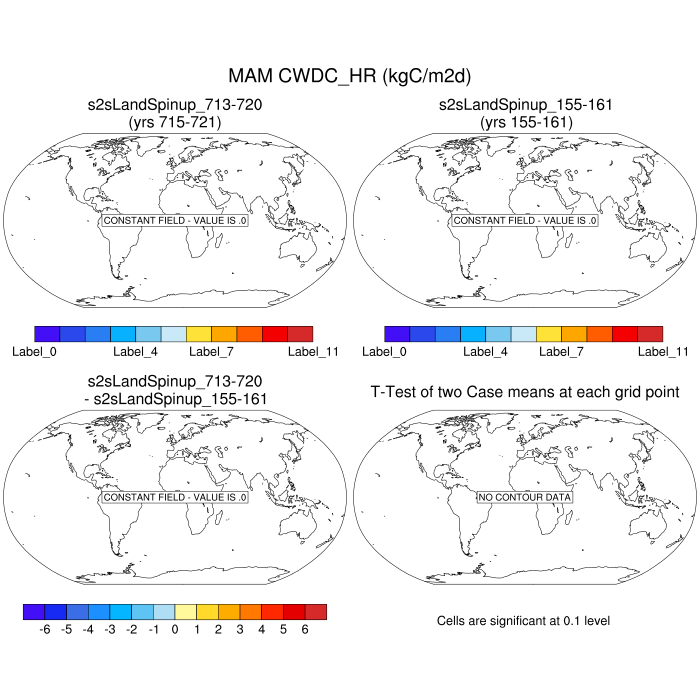
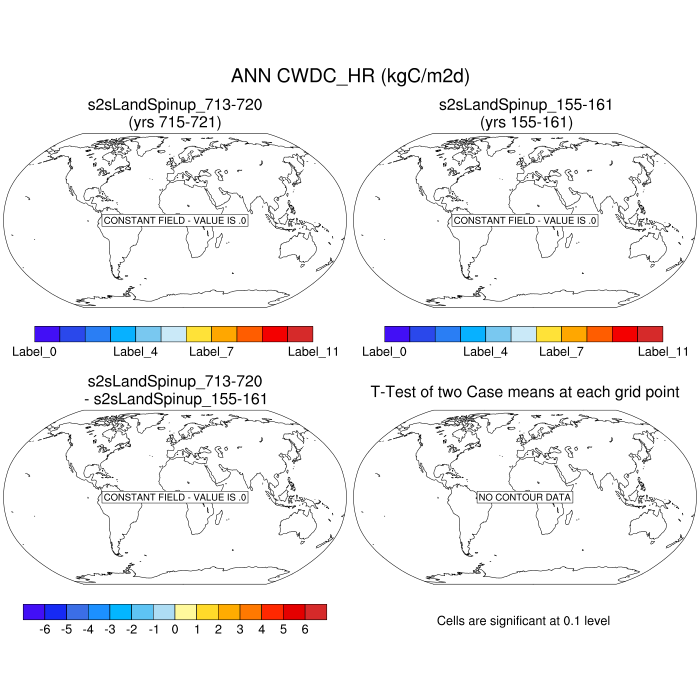
| CWDC_HR | Coarse Woody Debris C Hetereotrophic respiration | plot | plot | plot | plot | plot |
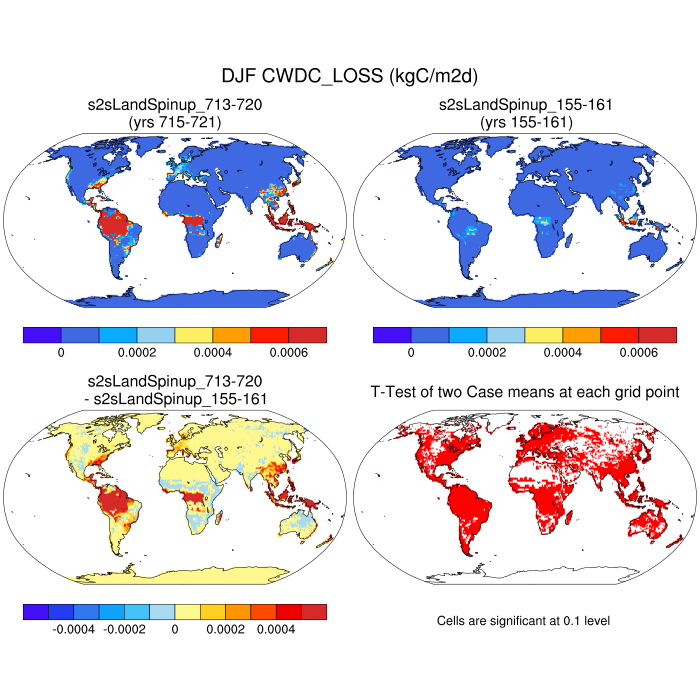
| CWDC_LOSS | Coarse Woody Debris C Loss | plot | plot | plot | plot | plot |
| FROOTC_ALLOC | Fine root C allocation | plot | plot | plot | plot | plot |
| FROOTC_LOSS | Fine root C Loss | plot | plot | plot | plot | plot |
| LEAFC_ALLOC | Leaf C Allocation | plot | plot | plot | plot | plot |
| LEAFC_LOSS | Leaf C Loss | plot | plot | plot | plot | plot |
| LITTERC | Total Litter C | plot | plot | plot | plot | plot |
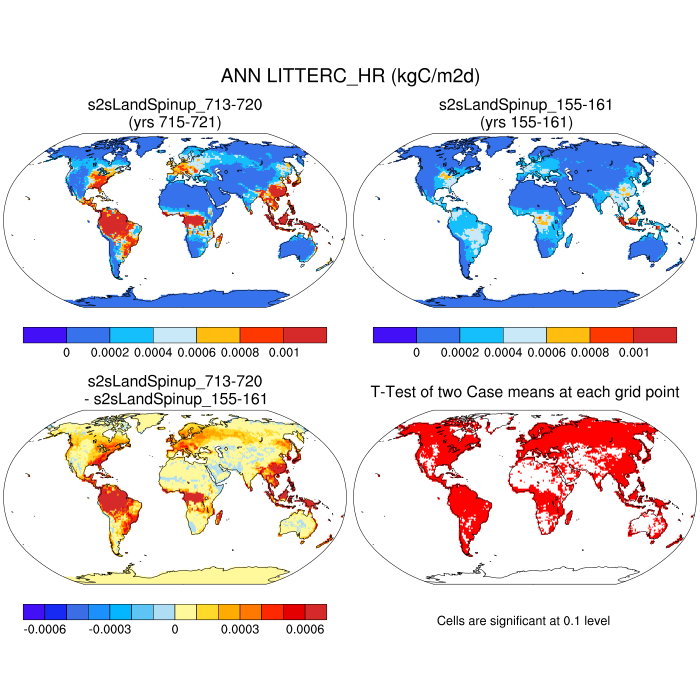
| LITTERC_HR | Litter Hetereotrophic Respiration | plot | plot | plot | plot | plot |
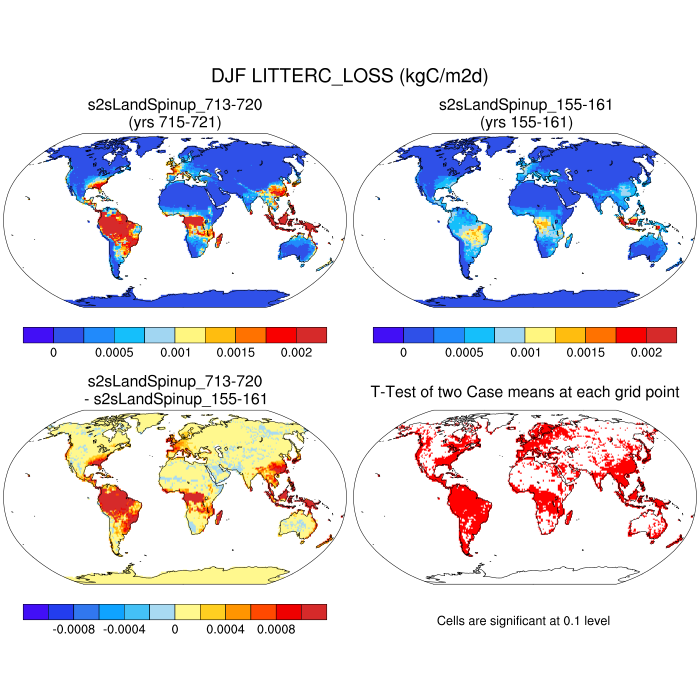
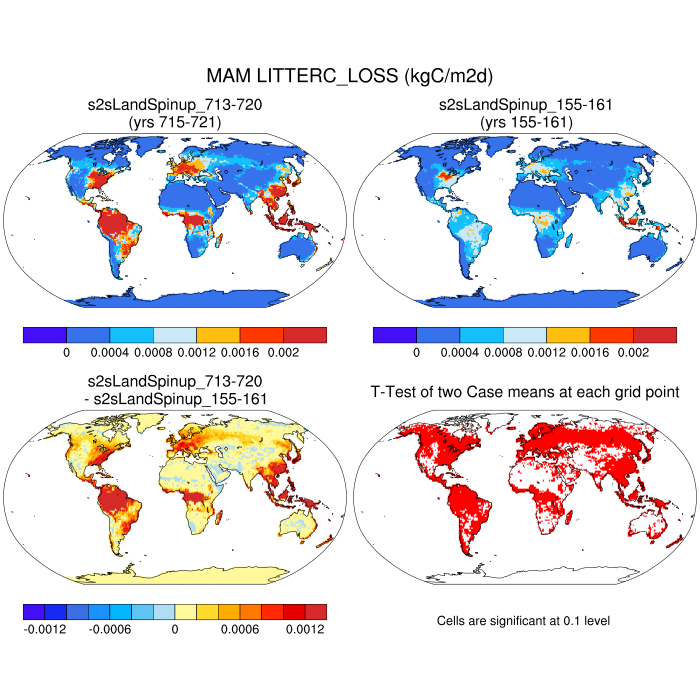
| LITTERC_LOSS | Litter C Loss | plot | plot | plot | plot | plot |
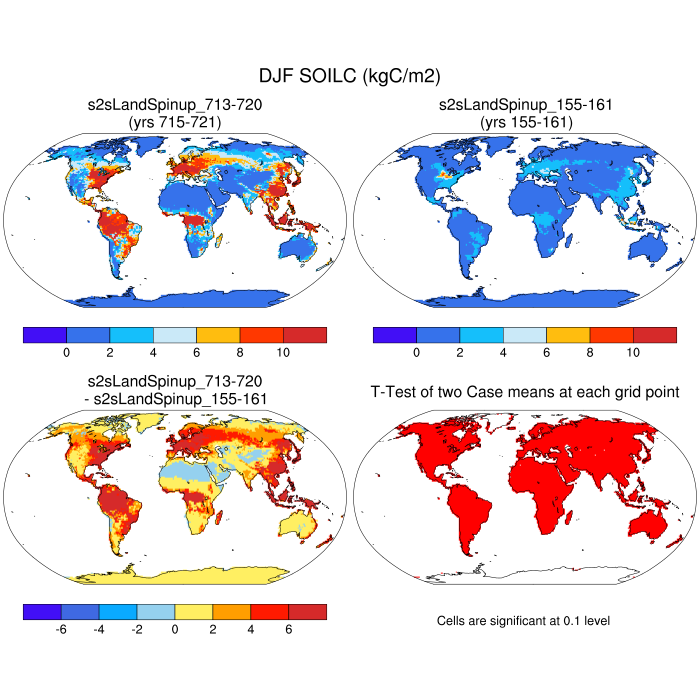
| SOILC | soil organic matter C (fast pool) | plot | plot | plot | plot | plot |
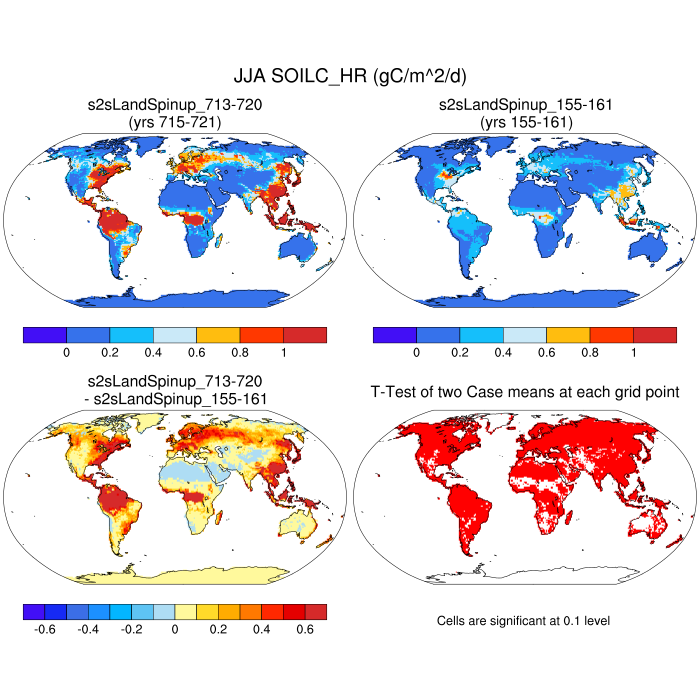
| SOILC_HR | Soil C hetereotrophic respiration | plot | plot | plot | plot | plot |
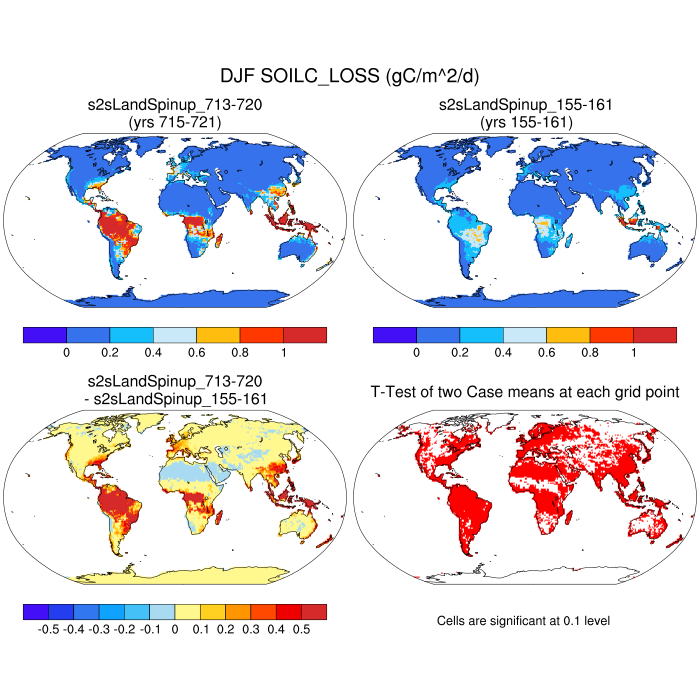
| SOILC_LOSS | Soil C Loss | plot | plot | plot | plot | plot |
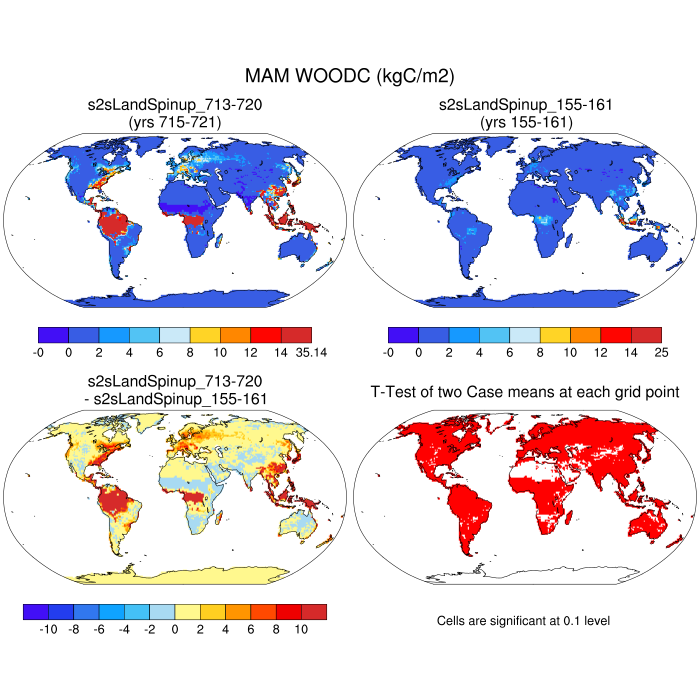
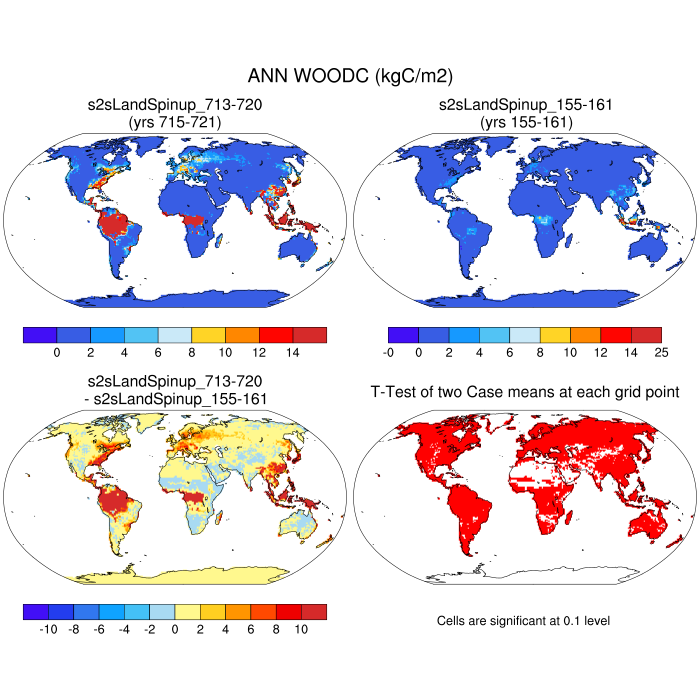
| WOODC | Wood C | plot | plot | plot | plot | plot |
| WOODC_ALLOC | Wood C Allocation | plot | plot | plot | plot | plot |
| WOODC_LOSS | Wood C Loss | plot | plot | plot | plot | plot |
| ALTMAX | maximum annual active layer thickness | plot | plot | plot | plot | plot |