Mean State
Download Data |
Period Mean (original grids) [Pg yr-1] |
Model Period Mean (intersection) [Pg yr-1] |
Model Period Mean (complement) [Pg yr-1] |
Benchmark Period Mean (intersection) [Pg yr-1] |
Benchmark Period Mean (complement) [Pg yr-1] |
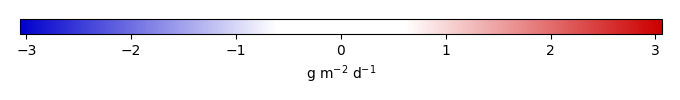
Bias [g m-2 d-1] |
RMSE [g m-2 d-1] |
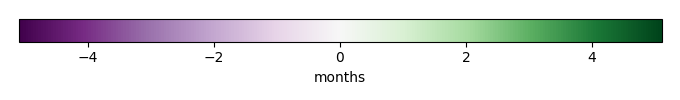
Phase Shift [months] |
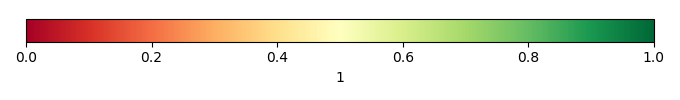
Bias Score [1] |
RMSE Score [1] |
Seasonal Cycle Score [1] |
Spatial Distribution Score [1] |
Overall Score [1] |
|||
|---|---|---|---|---|---|---|---|---|---|---|---|---|---|---|---|---|
| Benchmark | [-] | 8.18 | ||||||||||||||
| Calib | [-] | 9.78 | 8.85 | 1.05 | 8.18 | 0.417 | 1.46 | 2.31 | 0.404 | 0.339 | 0.572 | 0.982 | 0.527 | |||
| Control | [-] | 7.96 | 7.22 | 0.832 | 8.18 | -0.603 | 1.67 | 2.73 | 0.320 | 0.288 | 0.566 | 0.961 | 0.485 |
Download Data |
Period Mean (original grids) [Pg yr-1] |
Model Period Mean (intersection) [Pg yr-1] |
Model Period Mean (complement) [Pg yr-1] |
Benchmark Period Mean (intersection) [Pg yr-1] |
Benchmark Period Mean (complement) [Pg yr-1] |
Bias [g m-2 d-1] |
RMSE [g m-2 d-1] |
Phase Shift [months] |
Bias Score [1] |
RMSE Score [1] |
Seasonal Cycle Score [1] |
Spatial Distribution Score [1] |
Overall Score [1] |
|||
|---|---|---|---|---|---|---|---|---|---|---|---|---|---|---|---|---|
| Benchmark | [-] | 5.64 | ||||||||||||||
| Calib | [-] | 9.15 | 9.06 | 0.238 | 5.64 | 1.38 | 2.09 | 0.779 | 0.446 | 0.438 | 0.876 | 0.903 | 0.620 | |||
| Control | [-] | 6.86 | 6.89 | 0.221 | 5.64 | 0.503 | 1.74 | 0.855 | 0.625 | 0.413 | 0.873 | 0.960 | 0.657 |
Download Data |
Period Mean (original grids) [Pg yr-1] |
Model Period Mean (intersection) [Pg yr-1] |
Model Period Mean (complement) [Pg yr-1] |
Benchmark Period Mean (intersection) [Pg yr-1] |
Benchmark Period Mean (complement) [Pg yr-1] |
Bias [g m-2 d-1] |
RMSE [g m-2 d-1] |
Phase Shift [months] |
Bias Score [1] |
RMSE Score [1] |
Seasonal Cycle Score [1] |
Spatial Distribution Score [1] |
Overall Score [1] |
|||
|---|---|---|---|---|---|---|---|---|---|---|---|---|---|---|---|---|
| Benchmark | [-] | 9.87 | ||||||||||||||
| Calib | [-] | 15.4 | 13.2 | 1.53 | 9.82 | 0.0491 | 1.03 | 1.73 | 1.02 | 0.499 | 0.503 | 0.853 | 0.924 | 0.656 | ||
| Control | [-] | 11.6 | 9.92 | 1.15 | 9.82 | 0.0491 | 0.0301 | 1.58 | 1.10 | 0.600 | 0.432 | 0.842 | 0.963 | 0.654 |
Download Data |
Period Mean (original grids) [Pg yr-1] |
Model Period Mean (intersection) [Pg yr-1] |
Model Period Mean (complement) [Pg yr-1] |
Benchmark Period Mean (intersection) [Pg yr-1] |
Benchmark Period Mean (complement) [Pg yr-1] |
Bias [g m-2 d-1] |
RMSE [g m-2 d-1] |
Phase Shift [months] |
Bias Score [1] |
RMSE Score [1] |
Seasonal Cycle Score [1] |
Spatial Distribution Score [1] |
Overall Score [1] |
|||
|---|---|---|---|---|---|---|---|---|---|---|---|---|---|---|---|---|
| Benchmark | [-] | 1.00 | ||||||||||||||
| Calib | [-] | 1.30 | 1.23 | 0.183 | 0.994 | 0.0158 | 0.205 | 0.852 | 0.0892 | 0.831 | 0.591 | 0.995 | 0.930 | 0.788 | ||
| Control | [-] | 1.28 | 1.19 | 0.182 | 0.994 | 0.0158 | 0.175 | 0.881 | 0.190 | 0.836 | 0.574 | 0.987 | 0.915 | 0.777 |
Download Data |
Period Mean (original grids) [Pg yr-1] |
Model Period Mean (intersection) [Pg yr-1] |
Model Period Mean (complement) [Pg yr-1] |
Benchmark Period Mean (intersection) [Pg yr-1] |
Benchmark Period Mean (complement) [Pg yr-1] |
Bias [g m-2 d-1] |
RMSE [g m-2 d-1] |
Phase Shift [months] |
Bias Score [1] |
RMSE Score [1] |
Seasonal Cycle Score [1] |
Spatial Distribution Score [1] |
Overall Score [1] |
|||
|---|---|---|---|---|---|---|---|---|---|---|---|---|---|---|---|---|
| Benchmark | [-] | 7.13 | ||||||||||||||
| Calib | [-] | 16.2 | 8.63 | 5.91 | 6.80 | 0.329 | 1.80 | 2.26 | 2.48 | 0.186 | 0.300 | 0.621 | 0.351 | 0.352 | ||
| Control | [-] | 14.8 | 7.88 | 5.34 | 6.80 | 0.329 | 1.06 | 2.08 | 2.35 | 0.253 | 0.286 | 0.640 | 0.395 | 0.372 |
Download Data |
Period Mean (original grids) [Pg yr-1] |
Model Period Mean (intersection) [Pg yr-1] |
Model Period Mean (complement) [Pg yr-1] |
Benchmark Period Mean (intersection) [Pg yr-1] |
Benchmark Period Mean (complement) [Pg yr-1] |
Bias [g m-2 d-1] |
RMSE [g m-2 d-1] |
Phase Shift [months] |
Bias Score [1] |
RMSE Score [1] |
Seasonal Cycle Score [1] |
Spatial Distribution Score [1] |
Overall Score [1] |
|||
|---|---|---|---|---|---|---|---|---|---|---|---|---|---|---|---|---|
| Benchmark | [-] | 6.75 | ||||||||||||||
| Calib | [-] | 7.17 | 7.01 | 0.149 | 6.69 | 0.0589 | 0.0976 | 1.10 | 0.569 | 0.868 | 0.692 | 0.961 | 0.938 | 0.830 | ||
| Control | [-] | 6.47 | 6.29 | 0.149 | 6.69 | 0.0589 | -0.125 | 1.25 | 0.654 | 0.857 | 0.653 | 0.952 | 0.977 | 0.818 |
Download Data |
Period Mean (original grids) [Pg yr-1] |
Model Period Mean (intersection) [Pg yr-1] |
Model Period Mean (complement) [Pg yr-1] |
Benchmark Period Mean (intersection) [Pg yr-1] |
Benchmark Period Mean (complement) [Pg yr-1] |
Bias [g m-2 d-1] |
RMSE [g m-2 d-1] |
Phase Shift [months] |
Bias Score [1] |
RMSE Score [1] |
Seasonal Cycle Score [1] |
Spatial Distribution Score [1] |
Overall Score [1] |
|||
|---|---|---|---|---|---|---|---|---|---|---|---|---|---|---|---|---|
| Benchmark | [-] | 9.93 | ||||||||||||||
| Calib | [-] | 10.8 | 9.38 | 1.07 | 9.59 | 0.338 | -0.0332 | 0.812 | 0.875 | 0.733 | 0.676 | 0.958 | 0.956 | 0.800 | ||
| Control | [-] | 9.91 | 8.57 | 1.01 | 9.59 | 0.338 | -0.160 | 0.844 | 0.844 | 0.715 | 0.661 | 0.960 | 0.945 | 0.788 |
Download Data |
Period Mean (original grids) [Pg yr-1] |
Model Period Mean (intersection) [Pg yr-1] |
Model Period Mean (complement) [Pg yr-1] |
Benchmark Period Mean (intersection) [Pg yr-1] |
Benchmark Period Mean (complement) [Pg yr-1] |
Bias [g m-2 d-1] |
RMSE [g m-2 d-1] |
Phase Shift [months] |
Bias Score [1] |
RMSE Score [1] |
Seasonal Cycle Score [1] |
Spatial Distribution Score [1] |
Overall Score [1] |
|||
|---|---|---|---|---|---|---|---|---|---|---|---|---|---|---|---|---|
| Benchmark | [-] | 8.36 | ||||||||||||||
| Calib | [-] | 13.6 | 10.5 | 2.79 | 8.34 | 0.0179 | 0.850 | 1.75 | 1.45 | 0.502 | 0.516 | 0.812 | 0.945 | 0.658 | ||
| Control | [-] | 12.1 | 9.36 | 2.52 | 8.34 | 0.0179 | 0.402 | 1.66 | 1.40 | 0.505 | 0.503 | 0.818 | 0.953 | 0.656 |
Download Data |
Period Mean (original grids) [Pg yr-1] |
Model Period Mean (intersection) [Pg yr-1] |
Model Period Mean (complement) [Pg yr-1] |
Benchmark Period Mean (intersection) [Pg yr-1] |
Benchmark Period Mean (complement) [Pg yr-1] |
Bias [g m-2 d-1] |
RMSE [g m-2 d-1] |
Phase Shift [months] |
Bias Score [1] |
RMSE Score [1] |
Seasonal Cycle Score [1] |
Spatial Distribution Score [1] |
Overall Score [1] |
|||
|---|---|---|---|---|---|---|---|---|---|---|---|---|---|---|---|---|
| Benchmark | [-] | 1.27 | ||||||||||||||
| Calib | [-] | 1.31 | 1.45 | 0.0846 | 1.27 | 0.00249 | 0.138 | 0.851 | 0.130 | 0.841 | 0.619 | 0.994 | 0.975 | 0.809 | ||
| Control | [-] | 1.32 | 1.44 | 0.0855 | 1.27 | 0.00249 | 0.135 | 0.873 | 0.178 | 0.849 | 0.610 | 0.991 | 0.974 | 0.807 |
Download Data |
Period Mean (original grids) [Pg yr-1] |
Model Period Mean (intersection) [Pg yr-1] |
Model Period Mean (complement) [Pg yr-1] |
Benchmark Period Mean (intersection) [Pg yr-1] |
Benchmark Period Mean (complement) [Pg yr-1] |
Bias [g m-2 d-1] |
RMSE [g m-2 d-1] |
Phase Shift [months] |
Bias Score [1] |
RMSE Score [1] |
Seasonal Cycle Score [1] |
Spatial Distribution Score [1] |
Overall Score [1] |
|||
|---|---|---|---|---|---|---|---|---|---|---|---|---|---|---|---|---|
| Benchmark | [-] | 3.55 | ||||||||||||||
| Calib | [-] | 7.99 | 5.30 | 1.70 | 3.42 | 0.134 | 0.641 | 0.989 | 1.18 | 0.440 | 0.419 | 0.893 | 0.789 | 0.592 | ||
| Control | [-] | 6.61 | 4.25 | 1.49 | 3.42 | 0.134 | 0.281 | 0.873 | 1.26 | 0.491 | 0.401 | 0.875 | 0.849 | 0.603 |
Download Data |
Period Mean (original grids) [Pg yr-1] |
Model Period Mean (intersection) [Pg yr-1] |
Model Period Mean (complement) [Pg yr-1] |
Benchmark Period Mean (intersection) [Pg yr-1] |
Benchmark Period Mean (complement) [Pg yr-1] |
Bias [g m-2 d-1] |
RMSE [g m-2 d-1] |
Phase Shift [months] |
Bias Score [1] |
RMSE Score [1] |
Seasonal Cycle Score [1] |
Spatial Distribution Score [1] |
Overall Score [1] |
|||
|---|---|---|---|---|---|---|---|---|---|---|---|---|---|---|---|---|
| Benchmark | [-] | 5.27 | ||||||||||||||
| Calib | [-] | 5.47 | 5.11 | 0.948 | 5.19 | 0.0810 | -0.0402 | 1.25 | 0.336 | 0.761 | 0.689 | 0.977 | 0.647 | 0.753 | ||
| Control | [-] | 5.09 | 4.75 | 0.859 | 5.19 | 0.0810 | -0.224 | 1.36 | 0.375 | 0.725 | 0.660 | 0.974 | 0.639 | 0.732 |
Download Data |
Period Mean (original grids) [Pg yr-1] |
Model Period Mean (intersection) [Pg yr-1] |
Model Period Mean (complement) [Pg yr-1] |
Benchmark Period Mean (intersection) [Pg yr-1] |
Benchmark Period Mean (complement) [Pg yr-1] |
Bias [g m-2 d-1] |
RMSE [g m-2 d-1] |
Phase Shift [months] |
Bias Score [1] |
RMSE Score [1] |
Seasonal Cycle Score [1] |
Spatial Distribution Score [1] |
Overall Score [1] |
|||
|---|---|---|---|---|---|---|---|---|---|---|---|---|---|---|---|---|
| Benchmark | [-] | 118. | ||||||||||||||
| Calib | [-] | 198. | 135. | 63.3 | 117. | 1.44 | 0.393 | 1.26 | 1.10 | 0.490 | 0.481 | 0.796 | 0.960 | 0.642 | ||
| Control | [-] | 171. | 116. | 55.0 | 117. | 1.44 | -0.0229 | 1.26 | 1.15 | 0.489 | 0.450 | 0.793 | 0.958 | 0.628 |
Download Data |
Period Mean (original grids) [Pg yr-1] |
Model Period Mean (intersection) [Pg yr-1] |
Model Period Mean (complement) [Pg yr-1] |
Benchmark Period Mean (intersection) [Pg yr-1] |
Benchmark Period Mean (complement) [Pg yr-1] |
Bias [g m-2 d-1] |
RMSE [g m-2 d-1] |
Phase Shift [months] |
Bias Score [1] |
RMSE Score [1] |
Seasonal Cycle Score [1] |
Spatial Distribution Score [1] |
Overall Score [1] |
|||
|---|---|---|---|---|---|---|---|---|---|---|---|---|---|---|---|---|
| Benchmark | [-] | 0.850 | ||||||||||||||
| Calib | [-] | 1.68 | 1.14 | 0.330 | 0.792 | 0.0578 | 0.116 | 0.364 | 2.24 | 0.511 | 0.424 | 0.895 | 0.876 | 0.626 | ||
| Control | [-] | 1.44 | 1.00 | 0.262 | 0.792 | 0.0578 | 0.0687 | 0.340 | 2.21 | 0.509 | 0.421 | 0.895 | 0.861 | 0.621 |
Download Data |
Period Mean (original grids) [Pg yr-1] |
Model Period Mean (intersection) [Pg yr-1] |
Model Period Mean (complement) [Pg yr-1] |
Benchmark Period Mean (intersection) [Pg yr-1] |
Benchmark Period Mean (complement) [Pg yr-1] |
Bias [g m-2 d-1] |
RMSE [g m-2 d-1] |
Phase Shift [months] |
Bias Score [1] |
RMSE Score [1] |
Seasonal Cycle Score [1] |
Spatial Distribution Score [1] |
Overall Score [1] |
|||
|---|---|---|---|---|---|---|---|---|---|---|---|---|---|---|---|---|
| Benchmark | [-] | 1.52 | ||||||||||||||
| Calib | [-] | 1.96 | 1.76 | 0.272 | 1.51 | 0.00556 | 0.102 | 0.588 | 0.295 | 0.802 | 0.575 | 0.988 | 0.952 | 0.778 | ||
| Control | [-] | 1.88 | 1.69 | 0.264 | 1.51 | 0.00556 | 0.0726 | 0.583 | 0.375 | 0.811 | 0.570 | 0.980 | 0.961 | 0.779 |
Download Data |
Period Mean (original grids) [Pg yr-1] |
Model Period Mean (intersection) [Pg yr-1] |
Model Period Mean (complement) [Pg yr-1] |
Benchmark Period Mean (intersection) [Pg yr-1] |
Benchmark Period Mean (complement) [Pg yr-1] |
Bias [g m-2 d-1] |
RMSE [g m-2 d-1] |
Phase Shift [months] |
Bias Score [1] |
RMSE Score [1] |
Seasonal Cycle Score [1] |
Spatial Distribution Score [1] |
Overall Score [1] |
|||
|---|---|---|---|---|---|---|---|---|---|---|---|---|---|---|---|---|
| Benchmark | [-] | 3.61 | ||||||||||||||
| Calib | [-] | 7.74 | 4.44 | 2.36 | 3.51 | 0.0973 | 0.903 | 1.95 | 1.20 | 0.385 | 0.406 | 0.845 | 0.943 | 0.597 | ||
| Control | [-] | 6.23 | 3.61 | 1.87 | 3.51 | 0.0973 | 0.0920 | 1.85 | 1.32 | 0.369 | 0.376 | 0.795 | 0.944 | 0.572 |
Download Data |
Period Mean (original grids) [Pg yr-1] |
Model Period Mean (intersection) [Pg yr-1] |
Model Period Mean (complement) [Pg yr-1] |
Benchmark Period Mean (intersection) [Pg yr-1] |
Benchmark Period Mean (complement) [Pg yr-1] |
Bias [g m-2 d-1] |
RMSE [g m-2 d-1] |
Phase Shift [months] |
Bias Score [1] |
RMSE Score [1] |
Seasonal Cycle Score [1] |
Spatial Distribution Score [1] |
Overall Score [1] |
|||
|---|---|---|---|---|---|---|---|---|---|---|---|---|---|---|---|---|
| Benchmark | [-] | 5.02 | ||||||||||||||
| Calib | [-] | 6.38 | 5.14 | 0.756 | 5.02 | 0.0767 | 1.30 | 0.566 | 0.817 | 0.702 | 0.958 | 0.982 | 0.832 | |||
| Control | [-] | 5.81 | 4.71 | 0.677 | 5.02 | -0.214 | 1.41 | 0.608 | 0.795 | 0.675 | 0.957 | 0.978 | 0.816 |
Download Data |
Period Mean (original grids) [Pg yr-1] |
Model Period Mean (intersection) [Pg yr-1] |
Model Period Mean (complement) [Pg yr-1] |
Benchmark Period Mean (intersection) [Pg yr-1] |
Benchmark Period Mean (complement) [Pg yr-1] |
Bias [g m-2 d-1] |
RMSE [g m-2 d-1] |
Phase Shift [months] |
Bias Score [1] |
RMSE Score [1] |
Seasonal Cycle Score [1] |
Spatial Distribution Score [1] |
Overall Score [1] |
|||
|---|---|---|---|---|---|---|---|---|---|---|---|---|---|---|---|---|
| Benchmark | [-] | 3.25 | ||||||||||||||
| Calib | [-] | 4.24 | 3.85 | 0.277 | 3.24 | 0.0150 | 0.320 | 1.06 | 0.222 | 0.771 | 0.634 | 0.984 | 0.945 | 0.794 | ||
| Control | [-] | 3.88 | 3.52 | 0.271 | 3.24 | 0.0150 | 0.148 | 1.07 | 0.429 | 0.794 | 0.616 | 0.972 | 0.936 | 0.787 |
Download Data |
Period Mean (original grids) [Pg yr-1] |
Model Period Mean (intersection) [Pg yr-1] |
Model Period Mean (complement) [Pg yr-1] |
Benchmark Period Mean (intersection) [Pg yr-1] |
Benchmark Period Mean (complement) [Pg yr-1] |
Bias [g m-2 d-1] |
RMSE [g m-2 d-1] |
Phase Shift [months] |
Bias Score [1] |
RMSE Score [1] |
Seasonal Cycle Score [1] |
Spatial Distribution Score [1] |
Overall Score [1] |
|||
|---|---|---|---|---|---|---|---|---|---|---|---|---|---|---|---|---|
| Benchmark | [-] | 1.71 | ||||||||||||||
| Calib | [-] | 1.62 | 1.79 | 0.131 | 1.71 | 0.0547 | 0.858 | 0.818 | 0.594 | 0.535 | 0.925 | 0.932 | 0.704 | |||
| Control | [-] | 1.35 | 1.51 | 0.114 | 1.71 | -0.141 | 0.838 | 0.925 | 0.602 | 0.522 | 0.916 | 0.909 | 0.694 |
Download Data |
Period Mean (original grids) [Pg yr-1] |
Model Period Mean (intersection) [Pg yr-1] |
Model Period Mean (complement) [Pg yr-1] |
Benchmark Period Mean (intersection) [Pg yr-1] |
Benchmark Period Mean (complement) [Pg yr-1] |
Bias [g m-2 d-1] |
RMSE [g m-2 d-1] |
Phase Shift [months] |
Bias Score [1] |
RMSE Score [1] |
Seasonal Cycle Score [1] |
Spatial Distribution Score [1] |
Overall Score [1] |
|||
|---|---|---|---|---|---|---|---|---|---|---|---|---|---|---|---|---|
| Benchmark | [-] | 23.1 | ||||||||||||||
| Calib | [-] | 23.7 | 22.3 | 1.10 | 23.1 | 0.0273 | -0.258 | 1.75 | 2.71 | 0.202 | 0.296 | 0.549 | 0.920 | 0.452 | ||
| Control | [-] | 20.8 | 19.7 | 0.912 | 23.1 | 0.0273 | -1.11 | 2.12 | 2.77 | 0.120 | 0.260 | 0.542 | 0.959 | 0.428 |
Download Data |
Period Mean (original grids) [Pg yr-1] |
Model Period Mean (intersection) [Pg yr-1] |
Model Period Mean (complement) [Pg yr-1] |
Benchmark Period Mean (intersection) [Pg yr-1] |
Benchmark Period Mean (complement) [Pg yr-1] |
Bias [g m-2 d-1] |
RMSE [g m-2 d-1] |
Phase Shift [months] |
Bias Score [1] |
RMSE Score [1] |
Seasonal Cycle Score [1] |
Spatial Distribution Score [1] |
Overall Score [1] |
|||
|---|---|---|---|---|---|---|---|---|---|---|---|---|---|---|---|---|
| Benchmark | [-] | 10.4 | ||||||||||||||
| Calib | [-] | 14.4 | 12.2 | 1.19 | 10.4 | 0.000205 | 0.761 | 2.06 | 0.934 | 0.494 | 0.539 | 0.892 | 0.806 | 0.654 | ||
| Control | [-] | 11.9 | 10.0 | 0.971 | 10.4 | 0.000205 | -0.151 | 2.03 | 0.803 | 0.518 | 0.494 | 0.904 | 0.830 | 0.648 |
Download Data |
Period Mean (original grids) [Pg yr-1] |
Model Period Mean (intersection) [Pg yr-1] |
Model Period Mean (complement) [Pg yr-1] |
Benchmark Period Mean (intersection) [Pg yr-1] |
Benchmark Period Mean (complement) [Pg yr-1] |
Bias [g m-2 d-1] |
RMSE [g m-2 d-1] |
Phase Shift [months] |
Bias Score [1] |
RMSE Score [1] |
Seasonal Cycle Score [1] |
Spatial Distribution Score [1] |
Overall Score [1] |
|||
|---|---|---|---|---|---|---|---|---|---|---|---|---|---|---|---|---|
| Benchmark | [-] | 1.16 | ||||||||||||||
| Calib | [-] | 2.50 | 1.51 | 0.321 | 1.15 | 0.00409 | 0.322 | 1.20 | 1.54 | 0.334 | 0.435 | 0.868 | 0.838 | 0.582 | ||
| Control | [-] | 2.14 | 1.31 | 0.275 | 1.15 | 0.00409 | 0.145 | 1.11 | 1.41 | 0.333 | 0.440 | 0.908 | 0.829 | 0.590 |
Temporally integrated period mean