Mean State
Download Data |
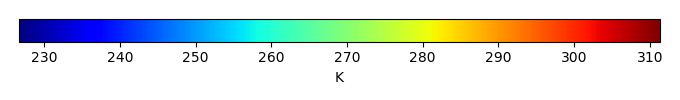
Period Mean (original grids) [K] |
Model Period Mean (intersection) [K] |
Model Period Mean (complement) [K] |
Benchmark Period Mean (intersection) [K] |
Benchmark Period Mean (complement) [K] |
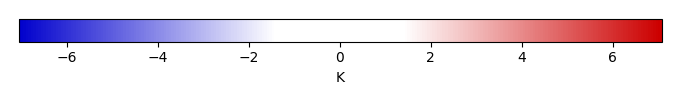
Bias [K] |
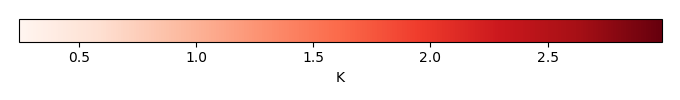
RMSE [K] |
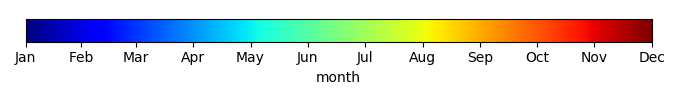
Phase Shift [months] |
Bias Score [1] |
RMSE Score [1] |
Seasonal Cycle Score [1] |
Spatial Distribution Score [1] |
Interannual Variability Score [1] |
Overall Score [1] |
|||
|---|---|---|---|---|---|---|---|---|---|---|---|---|---|---|---|---|---|
| Benchmark | [-] | 304. | |||||||||||||||
| Calib | [-] | 305. | 305. | 305. | 304. | 1.12 | 2.00 | 0.528 | 0.344 | 0.583 | 0.950 | 0.990 | 0.757 | 0.701 | |||
| Control | [-] | 305. | 306. | 305. | 304. | 1.27 | 2.09 | 0.473 | 0.327 | 0.581 | 0.954 | 0.990 | 0.754 | 0.698 |
Download Data |
Period Mean (original grids) [K] |
Model Period Mean (intersection) [K] |
Model Period Mean (complement) [K] |
Benchmark Period Mean (intersection) [K] |
Benchmark Period Mean (complement) [K] |
Bias [K] |
RMSE [K] |
Phase Shift [months] |
Bias Score [1] |
RMSE Score [1] |
Seasonal Cycle Score [1] |
Spatial Distribution Score [1] |
Interannual Variability Score [1] |
Overall Score [1] |
|||
|---|---|---|---|---|---|---|---|---|---|---|---|---|---|---|---|---|---|
| Benchmark | [-] | 307. | |||||||||||||||
| Calib | [-] | 309. | 309. | 305. | 307. | 307. | 1.97 | 2.74 | 0.436 | 0.456 | 0.684 | 0.966 | 1.00 | 0.859 | 0.775 | ||
| Control | [-] | 309. | 309. | 305. | 307. | 307. | 2.09 | 2.83 | 0.423 | 0.441 | 0.683 | 0.967 | 1.00 | 0.856 | 0.771 |
Download Data |
Period Mean (original grids) [K] |
Model Period Mean (intersection) [K] |
Model Period Mean (complement) [K] |
Benchmark Period Mean (intersection) [K] |
Benchmark Period Mean (complement) [K] |
Bias [K] |
RMSE [K] |
Phase Shift [months] |
Bias Score [1] |
RMSE Score [1] |
Seasonal Cycle Score [1] |
Spatial Distribution Score [1] |
Interannual Variability Score [1] |
Overall Score [1] |
|||
|---|---|---|---|---|---|---|---|---|---|---|---|---|---|---|---|---|---|
| Benchmark | [-] | 302. | |||||||||||||||
| Calib | [-] | 303. | 303. | 301. | 302. | 304. | 1.44 | 2.33 | 0.744 | 0.450 | 0.659 | 0.908 | 0.998 | 0.822 | 0.749 | ||
| Control | [-] | 303. | 303. | 301. | 302. | 304. | 1.57 | 2.41 | 0.727 | 0.437 | 0.656 | 0.912 | 0.998 | 0.821 | 0.747 |
Download Data |
Period Mean (original grids) [K] |
Model Period Mean (intersection) [K] |
Model Period Mean (complement) [K] |
Benchmark Period Mean (intersection) [K] |
Benchmark Period Mean (complement) [K] |
Bias [K] |
RMSE [K] |
Phase Shift [months] |
Bias Score [1] |
RMSE Score [1] |
Seasonal Cycle Score [1] |
Spatial Distribution Score [1] |
Interannual Variability Score [1] |
Overall Score [1] |
|||
|---|---|---|---|---|---|---|---|---|---|---|---|---|---|---|---|---|---|
| Benchmark | [-] | 266. | |||||||||||||||
| Calib | [-] | 267. | 267. | 271. | 266. | 271. | 0.528 | 2.75 | 0.0773 | 0.900 | 0.886 | 0.995 | 0.991 | 0.895 | 0.925 | ||
| Control | [-] | 267. | 267. | 271. | 266. | 271. | 0.537 | 2.76 | 0.0740 | 0.900 | 0.886 | 0.995 | 0.991 | 0.895 | 0.925 |
Download Data |
Period Mean (original grids) [K] |
Model Period Mean (intersection) [K] |
Model Period Mean (complement) [K] |
Benchmark Period Mean (intersection) [K] |
Benchmark Period Mean (complement) [K] |
Bias [K] |
RMSE [K] |
Phase Shift [months] |
Bias Score [1] |
RMSE Score [1] |
Seasonal Cycle Score [1] |
Spatial Distribution Score [1] |
Interannual Variability Score [1] |
Overall Score [1] |
|||
|---|---|---|---|---|---|---|---|---|---|---|---|---|---|---|---|---|---|
| Benchmark | [-] | 304. | |||||||||||||||
| Calib | [-] | 304. | 304. | 304. | 304. | 304. | 0.0746 | 1.67 | 0.634 | 0.196 | 0.481 | 0.901 | 0.811 | 0.760 | 0.605 | ||
| Control | [-] | 304. | 304. | 304. | 304. | 304. | 0.193 | 1.71 | 0.689 | 0.189 | 0.478 | 0.892 | 0.807 | 0.761 | 0.601 |
Download Data |
Period Mean (original grids) [K] |
Model Period Mean (intersection) [K] |
Model Period Mean (complement) [K] |
Benchmark Period Mean (intersection) [K] |
Benchmark Period Mean (complement) [K] |
Bias [K] |
RMSE [K] |
Phase Shift [months] |
Bias Score [1] |
RMSE Score [1] |
Seasonal Cycle Score [1] |
Spatial Distribution Score [1] |
Interannual Variability Score [1] |
Overall Score [1] |
|||
|---|---|---|---|---|---|---|---|---|---|---|---|---|---|---|---|---|---|
| Benchmark | [-] | 277. | |||||||||||||||
| Calib | [-] | 276. | 277. | 278. | 277. | 279. | 0.275 | 1.59 | 0.102 | 0.931 | 0.932 | 0.993 | 1.00 | 0.944 | 0.955 | ||
| Control | [-] | 276. | 277. | 278. | 277. | 279. | 0.305 | 1.61 | 0.0979 | 0.930 | 0.931 | 0.993 | 1.00 | 0.943 | 0.955 |
Download Data |
Period Mean (original grids) [K] |
Model Period Mean (intersection) [K] |
Model Period Mean (complement) [K] |
Benchmark Period Mean (intersection) [K] |
Benchmark Period Mean (complement) [K] |
Bias [K] |
RMSE [K] |
Phase Shift [months] |
Bias Score [1] |
RMSE Score [1] |
Seasonal Cycle Score [1] |
Spatial Distribution Score [1] |
Interannual Variability Score [1] |
Overall Score [1] |
|||
|---|---|---|---|---|---|---|---|---|---|---|---|---|---|---|---|---|---|
| Benchmark | [-] | 287. | |||||||||||||||
| Calib | [-] | 287. | 287. | 292. | 286. | 290. | 0.841 | 2.67 | 0.124 | 0.813 | 0.889 | 0.991 | 1.00 | 0.903 | 0.914 | ||
| Control | [-] | 287. | 287. | 292. | 286. | 290. | 0.896 | 2.69 | 0.124 | 0.812 | 0.889 | 0.991 | 1.00 | 0.902 | 0.914 |
Download Data |
Period Mean (original grids) [K] |
Model Period Mean (intersection) [K] |
Model Period Mean (complement) [K] |
Benchmark Period Mean (intersection) [K] |
Benchmark Period Mean (complement) [K] |
Bias [K] |
RMSE [K] |
Phase Shift [months] |
Bias Score [1] |
RMSE Score [1] |
Seasonal Cycle Score [1] |
Spatial Distribution Score [1] |
Interannual Variability Score [1] |
Overall Score [1] |
|||
|---|---|---|---|---|---|---|---|---|---|---|---|---|---|---|---|---|---|
| Benchmark | [-] | 303. | |||||||||||||||
| Calib | [-] | 305. | 304. | 304. | 303. | 303. | 0.983 | 2.89 | 0.325 | 0.529 | 0.713 | 0.962 | 0.999 | 0.854 | 0.795 | ||
| Control | [-] | 305. | 304. | 304. | 303. | 303. | 1.08 | 2.95 | 0.325 | 0.519 | 0.713 | 0.962 | 0.999 | 0.854 | 0.793 |
Download Data |
Period Mean (original grids) [K] |
Model Period Mean (intersection) [K] |
Model Period Mean (complement) [K] |
Benchmark Period Mean (intersection) [K] |
Benchmark Period Mean (complement) [K] |
Bias [K] |
RMSE [K] |
Phase Shift [months] |
Bias Score [1] |
RMSE Score [1] |
Seasonal Cycle Score [1] |
Spatial Distribution Score [1] |
Interannual Variability Score [1] |
Overall Score [1] |
|||
|---|---|---|---|---|---|---|---|---|---|---|---|---|---|---|---|---|---|
| Benchmark | [-] | 268. | |||||||||||||||
| Calib | [-] | 268. | 268. | 270. | 268. | 270. | 0.155 | 2.22 | 0.161 | 0.925 | 0.902 | 0.987 | 1.00 | 0.924 | 0.940 | ||
| Control | [-] | 268. | 268. | 270. | 268. | 270. | 0.172 | 2.22 | 0.161 | 0.925 | 0.902 | 0.987 | 1.00 | 0.924 | 0.940 |
Download Data |
Period Mean (original grids) [K] |
Model Period Mean (intersection) [K] |
Model Period Mean (complement) [K] |
Benchmark Period Mean (intersection) [K] |
Benchmark Period Mean (complement) [K] |
Bias [K] |
RMSE [K] |
Phase Shift [months] |
Bias Score [1] |
RMSE Score [1] |
Seasonal Cycle Score [1] |
Spatial Distribution Score [1] |
Interannual Variability Score [1] |
Overall Score [1] |
|||
|---|---|---|---|---|---|---|---|---|---|---|---|---|---|---|---|---|---|
| Benchmark | [-] | 301. | |||||||||||||||
| Calib | [-] | 302. | 303. | 296. | 301. | 300. | 1.54 | 2.40 | 0.279 | 0.637 | 0.815 | 0.975 | 0.996 | 0.848 | 0.848 | ||
| Control | [-] | 302. | 303. | 296. | 301. | 300. | 1.60 | 2.43 | 0.227 | 0.631 | 0.816 | 0.981 | 0.996 | 0.848 | 0.848 |
Download Data |
Period Mean (original grids) [K] |
Model Period Mean (intersection) [K] |
Model Period Mean (complement) [K] |
Benchmark Period Mean (intersection) [K] |
Benchmark Period Mean (complement) [K] |
Bias [K] |
RMSE [K] |
Phase Shift [months] |
Bias Score [1] |
RMSE Score [1] |
Seasonal Cycle Score [1] |
Spatial Distribution Score [1] |
Interannual Variability Score [1] |
Overall Score [1] |
|||
|---|---|---|---|---|---|---|---|---|---|---|---|---|---|---|---|---|---|
| Benchmark | [-] | 287. | |||||||||||||||
| Calib | [-] | 287. | 287. | 288. | 287. | 293. | 0.286 | 1.98 | 0.100 | 0.837 | 0.863 | 0.993 | 0.998 | 0.903 | 0.909 | ||
| Control | [-] | 287. | 287. | 288. | 287. | 293. | 0.321 | 1.99 | 0.100 | 0.836 | 0.862 | 0.993 | 0.997 | 0.903 | 0.909 |
Download Data |
Period Mean (original grids) [K] |
Model Period Mean (intersection) [K] |
Model Period Mean (complement) [K] |
Benchmark Period Mean (intersection) [K] |
Benchmark Period Mean (complement) [K] |
Bias [K] |
RMSE [K] |
Phase Shift [months] |
Bias Score [1] |
RMSE Score [1] |
Seasonal Cycle Score [1] |
Spatial Distribution Score [1] |
Interannual Variability Score [1] |
Overall Score [1] |
|||
|---|---|---|---|---|---|---|---|---|---|---|---|---|---|---|---|---|---|
| Benchmark | [-] | 293. | |||||||||||||||
| Calib | [-] | 290. | 294. | 280. | 293. | 296. | 1.00 | 2.47 | 0.340 | 0.654 | 0.789 | 0.964 | 0.998 | 0.872 | 0.844 | ||
| Control | [-] | 290. | 294. | 280. | 293. | 296. | 1.07 | 2.50 | 0.333 | 0.648 | 0.788 | 0.965 | 0.998 | 0.871 | 0.843 |
Download Data |
Period Mean (original grids) [K] |
Model Period Mean (intersection) [K] |
Model Period Mean (complement) [K] |
Benchmark Period Mean (intersection) [K] |
Benchmark Period Mean (complement) [K] |
Bias [K] |
RMSE [K] |
Phase Shift [months] |
Bias Score [1] |
RMSE Score [1] |
Seasonal Cycle Score [1] |
Spatial Distribution Score [1] |
Interannual Variability Score [1] |
Overall Score [1] |
|||
|---|---|---|---|---|---|---|---|---|---|---|---|---|---|---|---|---|---|
| Benchmark | [-] | 303. | |||||||||||||||
| Calib | [-] | 304. | 305. | 301. | 303. | 297. | 1.56 | 2.75 | 0.348 | 0.706 | 0.847 | 0.973 | 0.998 | 0.878 | 0.875 | ||
| Control | [-] | 304. | 305. | 301. | 303. | 297. | 1.59 | 2.76 | 0.348 | 0.704 | 0.847 | 0.973 | 0.998 | 0.879 | 0.875 |
Download Data |
Period Mean (original grids) [K] |
Model Period Mean (intersection) [K] |
Model Period Mean (complement) [K] |
Benchmark Period Mean (intersection) [K] |
Benchmark Period Mean (complement) [K] |
Bias [K] |
RMSE [K] |
Phase Shift [months] |
Bias Score [1] |
RMSE Score [1] |
Seasonal Cycle Score [1] |
Spatial Distribution Score [1] |
Interannual Variability Score [1] |
Overall Score [1] |
|||
|---|---|---|---|---|---|---|---|---|---|---|---|---|---|---|---|---|---|
| Benchmark | [-] | 269. | |||||||||||||||
| Calib | [-] | 270. | 270. | 270. | 269. | 268. | 0.914 | 2.65 | 0.0972 | 0.880 | 0.863 | 0.993 | 0.999 | 0.890 | 0.915 | ||
| Control | [-] | 270. | 270. | 270. | 269. | 268. | 0.942 | 2.67 | 0.0972 | 0.879 | 0.862 | 0.993 | 0.999 | 0.890 | 0.914 |
Download Data |
Period Mean (original grids) [K] |
Model Period Mean (intersection) [K] |
Model Period Mean (complement) [K] |
Benchmark Period Mean (intersection) [K] |
Benchmark Period Mean (complement) [K] |
Bias [K] |
RMSE [K] |
Phase Shift [months] |
Bias Score [1] |
RMSE Score [1] |
Seasonal Cycle Score [1] |
Spatial Distribution Score [1] |
Interannual Variability Score [1] |
Overall Score [1] |
|||
|---|---|---|---|---|---|---|---|---|---|---|---|---|---|---|---|---|---|
| Benchmark | [-] | 303. | |||||||||||||||
| Calib | [-] | 304. | 304. | 303. | 302. | 304. | 1.46 | 3.09 | 0.711 | 0.454 | 0.652 | 0.908 | 0.934 | 0.794 | 0.733 | ||
| Control | [-] | 304. | 304. | 303. | 302. | 304. | 1.58 | 3.14 | 0.713 | 0.448 | 0.651 | 0.909 | 0.941 | 0.798 | 0.733 |
Download Data |
Period Mean (original grids) [K] |
Model Period Mean (intersection) [K] |
Model Period Mean (complement) [K] |
Benchmark Period Mean (intersection) [K] |
Benchmark Period Mean (complement) [K] |
Bias [K] |
RMSE [K] |
Phase Shift [months] |
Bias Score [1] |
RMSE Score [1] |
Seasonal Cycle Score [1] |
Spatial Distribution Score [1] |
Interannual Variability Score [1] |
Overall Score [1] |
|||
|---|---|---|---|---|---|---|---|---|---|---|---|---|---|---|---|---|---|
| Benchmark | [-] | 292. | |||||||||||||||
| Calib | [-] | 293. | 293. | 298. | 292. | 0.668 | 1.64 | 0.208 | 0.865 | 0.902 | 0.986 | 0.996 | 0.924 | 0.929 | |||
| Control | [-] | 293. | 293. | 298. | 292. | 0.741 | 1.66 | 0.208 | 0.863 | 0.903 | 0.986 | 0.996 | 0.923 | 0.929 |
Download Data |
Period Mean (original grids) [K] |
Model Period Mean (intersection) [K] |
Model Period Mean (complement) [K] |
Benchmark Period Mean (intersection) [K] |
Benchmark Period Mean (complement) [K] |
Bias [K] |
RMSE [K] |
Phase Shift [months] |
Bias Score [1] |
RMSE Score [1] |
Seasonal Cycle Score [1] |
Spatial Distribution Score [1] |
Interannual Variability Score [1] |
Overall Score [1] |
|||
|---|---|---|---|---|---|---|---|---|---|---|---|---|---|---|---|---|---|
| Benchmark | [-] | 280. | |||||||||||||||
| Calib | [-] | 281. | 280. | 282. | 280. | 284. | 0.624 | 1.91 | 0.119 | 0.881 | 0.899 | 0.992 | 0.988 | 0.932 | 0.932 | ||
| Control | [-] | 281. | 281. | 282. | 280. | 284. | 0.680 | 1.94 | 0.119 | 0.879 | 0.898 | 0.992 | 0.988 | 0.934 | 0.932 |
Download Data |
Period Mean (original grids) [K] |
Model Period Mean (intersection) [K] |
Model Period Mean (complement) [K] |
Benchmark Period Mean (intersection) [K] |
Benchmark Period Mean (complement) [K] |
Bias [K] |
RMSE [K] |
Phase Shift [months] |
Bias Score [1] |
RMSE Score [1] |
Seasonal Cycle Score [1] |
Spatial Distribution Score [1] |
Interannual Variability Score [1] |
Overall Score [1] |
|||
|---|---|---|---|---|---|---|---|---|---|---|---|---|---|---|---|---|---|
| Benchmark | [-] | 291. | |||||||||||||||
| Calib | [-] | 293. | 292. | 290. | 291. | 1.04 | 2.60 | 0.104 | 0.796 | 0.875 | 0.991 | 0.997 | 0.896 | 0.905 | |||
| Control | [-] | 293. | 292. | 290. | 291. | 1.16 | 2.63 | 0.104 | 0.793 | 0.877 | 0.991 | 0.997 | 0.894 | 0.905 |
Download Data |
Period Mean (original grids) [K] |
Model Period Mean (intersection) [K] |
Model Period Mean (complement) [K] |
Benchmark Period Mean (intersection) [K] |
Benchmark Period Mean (complement) [K] |
Bias [K] |
RMSE [K] |
Phase Shift [months] |
Bias Score [1] |
RMSE Score [1] |
Seasonal Cycle Score [1] |
Spatial Distribution Score [1] |
Interannual Variability Score [1] |
Overall Score [1] |
|||
|---|---|---|---|---|---|---|---|---|---|---|---|---|---|---|---|---|---|
| Benchmark | [-] | 304. | |||||||||||||||
| Calib | [-] | 306. | 306. | 304. | 304. | 304. | 1.44 | 2.13 | 0.814 | 0.257 | 0.617 | 0.894 | 0.999 | 0.853 | 0.706 | ||
| Control | [-] | 306. | 306. | 304. | 304. | 304. | 1.57 | 2.24 | 0.794 | 0.238 | 0.616 | 0.898 | 0.998 | 0.854 | 0.703 |
Download Data |
Period Mean (original grids) [K] |
Model Period Mean (intersection) [K] |
Model Period Mean (complement) [K] |
Benchmark Period Mean (intersection) [K] |
Benchmark Period Mean (complement) [K] |
Bias [K] |
RMSE [K] |
Phase Shift [months] |
Bias Score [1] |
RMSE Score [1] |
Seasonal Cycle Score [1] |
Spatial Distribution Score [1] |
Interannual Variability Score [1] |
Overall Score [1] |
|||
|---|---|---|---|---|---|---|---|---|---|---|---|---|---|---|---|---|---|
| Benchmark | [-] | 302. | |||||||||||||||
| Calib | [-] | 303. | 303. | 300. | 302. | 294. | 1.51 | 2.16 | 0.617 | 0.474 | 0.708 | 0.915 | 0.997 | 0.857 | 0.776 | ||
| Control | [-] | 303. | 303. | 300. | 302. | 294. | 1.62 | 2.24 | 0.603 | 0.457 | 0.707 | 0.916 | 0.996 | 0.856 | 0.773 |
Download Data |
Period Mean (original grids) [K] |
Model Period Mean (intersection) [K] |
Model Period Mean (complement) [K] |
Benchmark Period Mean (intersection) [K] |
Benchmark Period Mean (complement) [K] |
Bias [K] |
RMSE [K] |
Phase Shift [months] |
Bias Score [1] |
RMSE Score [1] |
Seasonal Cycle Score [1] |
Spatial Distribution Score [1] |
Interannual Variability Score [1] |
Overall Score [1] |
|||
|---|---|---|---|---|---|---|---|---|---|---|---|---|---|---|---|---|---|
| Benchmark | [-] | 290. | |||||||||||||||
| Calib | [-] | 293. | 292. | 293. | 290. | 284. | 1.90 | 4.44 | 0.644 | 0.449 | 0.681 | 0.932 | 0.967 | 0.843 | 0.759 | ||
| Control | [-] | 293. | 292. | 293. | 290. | 284. | 1.95 | 4.46 | 0.644 | 0.447 | 0.682 | 0.932 | 0.966 | 0.843 | 0.759 |
Temporally integrated period mean