Mean State
Download Data |
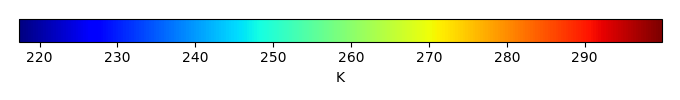
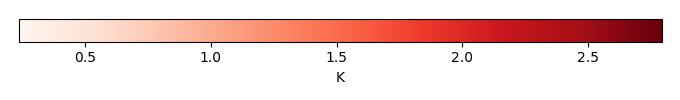
Period Mean (original grids) [K] |
Model Period Mean (intersection) [K] |
Model Period Mean (complement) [K] |
Benchmark Period Mean (intersection) [K] |
Benchmark Period Mean (complement) [K] |
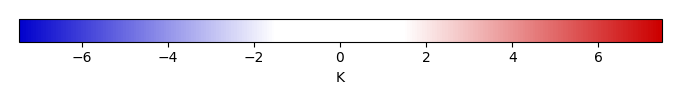
Bias [K] |
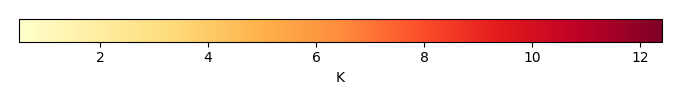
RMSE [K] |
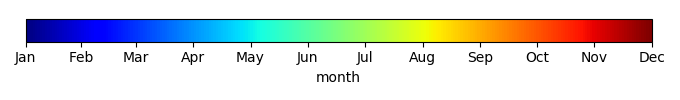
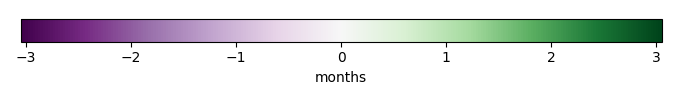
Phase Shift [months] |
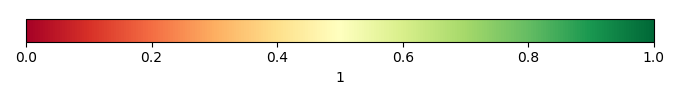
Bias Score [1] |
RMSE Score [1] |
Seasonal Cycle Score [1] |
Spatial Distribution Score [1] |
Interannual Variability Score [1] |
Overall Score [1] |
|||
|---|---|---|---|---|---|---|---|---|---|---|---|---|---|---|---|---|---|
| Benchmark | [-] | 293. | |||||||||||||||
| Calib | [-] | 294. | 294. | 296. | 293. | 0.623 | 1.74 | 0.804 | 0.343 | 0.489 | 0.905 | 0.980 | 0.760 | 0.661 | |||
| Control | [-] | 294. | 294. | 296. | 293. | 0.666 | 1.75 | 0.805 | 0.338 | 0.495 | 0.904 | 0.979 | 0.765 | 0.663 |
Download Data |
Period Mean (original grids) [K] |
Model Period Mean (intersection) [K] |
Model Period Mean (complement) [K] |
Benchmark Period Mean (intersection) [K] |
Benchmark Period Mean (complement) [K] |
Bias [K] |
RMSE [K] |
Phase Shift [months] |
Bias Score [1] |
RMSE Score [1] |
Seasonal Cycle Score [1] |
Spatial Distribution Score [1] |
Interannual Variability Score [1] |
Overall Score [1] |
|||
|---|---|---|---|---|---|---|---|---|---|---|---|---|---|---|---|---|---|
| Benchmark | [-] | 293. | |||||||||||||||
| Calib | [-] | 294. | 295. | 296. | 293. | 294. | 1.10 | 2.00 | 0.458 | 0.573 | 0.702 | 0.950 | 0.940 | 0.837 | 0.784 | ||
| Control | [-] | 294. | 295. | 296. | 293. | 294. | 1.10 | 2.00 | 0.467 | 0.572 | 0.702 | 0.949 | 0.936 | 0.834 | 0.783 |
Download Data |
Period Mean (original grids) [K] |
Model Period Mean (intersection) [K] |
Model Period Mean (complement) [K] |
Benchmark Period Mean (intersection) [K] |
Benchmark Period Mean (complement) [K] |
Bias [K] |
RMSE [K] |
Phase Shift [months] |
Bias Score [1] |
RMSE Score [1] |
Seasonal Cycle Score [1] |
Spatial Distribution Score [1] |
Interannual Variability Score [1] |
Overall Score [1] |
|||
|---|---|---|---|---|---|---|---|---|---|---|---|---|---|---|---|---|---|
| Benchmark | [-] | 289. | |||||||||||||||
| Calib | [-] | 290. | 290. | 293. | 289. | 295. | 1.08 | 2.02 | 0.902 | 0.585 | 0.755 | 0.886 | 1.00 | 0.808 | 0.798 | ||
| Control | [-] | 290. | 290. | 293. | 289. | 295. | 1.08 | 2.02 | 0.911 | 0.585 | 0.756 | 0.885 | 1.00 | 0.809 | 0.798 |
Download Data |
Period Mean (original grids) [K] |
Model Period Mean (intersection) [K] |
Model Period Mean (complement) [K] |
Benchmark Period Mean (intersection) [K] |
Benchmark Period Mean (complement) [K] |
Bias [K] |
RMSE [K] |
Phase Shift [months] |
Bias Score [1] |
RMSE Score [1] |
Seasonal Cycle Score [1] |
Spatial Distribution Score [1] |
Interannual Variability Score [1] |
Overall Score [1] |
|||
|---|---|---|---|---|---|---|---|---|---|---|---|---|---|---|---|---|---|
| Benchmark | [-] | 257. | |||||||||||||||
| Calib | [-] | 258. | 258. | 266. | 257. | 264. | 0.886 | 3.09 | 0.0650 | 0.859 | 0.896 | 0.996 | 0.971 | 0.897 | 0.919 | ||
| Control | [-] | 258. | 258. | 266. | 257. | 264. | 0.850 | 3.09 | 0.0618 | 0.859 | 0.895 | 0.996 | 0.971 | 0.897 | 0.919 |
Download Data |
Period Mean (original grids) [K] |
Model Period Mean (intersection) [K] |
Model Period Mean (complement) [K] |
Benchmark Period Mean (intersection) [K] |
Benchmark Period Mean (complement) [K] |
Bias [K] |
RMSE [K] |
Phase Shift [months] |
Bias Score [1] |
RMSE Score [1] |
Seasonal Cycle Score [1] |
Spatial Distribution Score [1] |
Interannual Variability Score [1] |
Overall Score [1] |
|||
|---|---|---|---|---|---|---|---|---|---|---|---|---|---|---|---|---|---|
| Benchmark | [-] | 295. | |||||||||||||||
| Calib | [-] | 296. | 296. | 297. | 295. | 295. | 1.79 | 2.78 | 1.67 | 0.132 | 0.435 | 0.732 | 0.989 | 0.748 | 0.579 | ||
| Control | [-] | 296. | 296. | 298. | 295. | 295. | 1.85 | 2.82 | 1.64 | 0.124 | 0.437 | 0.734 | 0.987 | 0.750 | 0.578 |
Download Data |
Period Mean (original grids) [K] |
Model Period Mean (intersection) [K] |
Model Period Mean (complement) [K] |
Benchmark Period Mean (intersection) [K] |
Benchmark Period Mean (complement) [K] |
Bias [K] |
RMSE [K] |
Phase Shift [months] |
Bias Score [1] |
RMSE Score [1] |
Seasonal Cycle Score [1] |
Spatial Distribution Score [1] |
Interannual Variability Score [1] |
Overall Score [1] |
|||
|---|---|---|---|---|---|---|---|---|---|---|---|---|---|---|---|---|---|
| Benchmark | [-] | 266. | |||||||||||||||
| Calib | [-] | 266. | 266. | 270. | 266. | 271. | -0.138 | 1.67 | 0.109 | 0.918 | 0.929 | 0.992 | 0.997 | 0.935 | 0.950 | ||
| Control | [-] | 266. | 266. | 270. | 266. | 271. | -0.215 | 1.67 | 0.109 | 0.917 | 0.930 | 0.992 | 0.998 | 0.936 | 0.950 |
Download Data |
Period Mean (original grids) [K] |
Model Period Mean (intersection) [K] |
Model Period Mean (complement) [K] |
Benchmark Period Mean (intersection) [K] |
Benchmark Period Mean (complement) [K] |
Bias [K] |
RMSE [K] |
Phase Shift [months] |
Bias Score [1] |
RMSE Score [1] |
Seasonal Cycle Score [1] |
Spatial Distribution Score [1] |
Interannual Variability Score [1] |
Overall Score [1] |
|||
|---|---|---|---|---|---|---|---|---|---|---|---|---|---|---|---|---|---|
| Benchmark | [-] | 275. | |||||||||||||||
| Calib | [-] | 276. | 276. | 287. | 275. | 281. | 0.986 | 2.75 | 0.0494 | 0.798 | 0.901 | 0.997 | 1.00 | 0.899 | 0.916 | ||
| Control | [-] | 276. | 276. | 287. | 275. | 281. | 0.951 | 2.74 | 0.0494 | 0.799 | 0.902 | 0.997 | 1.00 | 0.899 | 0.916 |
Download Data |
Period Mean (original grids) [K] |
Model Period Mean (intersection) [K] |
Model Period Mean (complement) [K] |
Benchmark Period Mean (intersection) [K] |
Benchmark Period Mean (complement) [K] |
Bias [K] |
RMSE [K] |
Phase Shift [months] |
Bias Score [1] |
RMSE Score [1] |
Seasonal Cycle Score [1] |
Spatial Distribution Score [1] |
Interannual Variability Score [1] |
Overall Score [1] |
|||
|---|---|---|---|---|---|---|---|---|---|---|---|---|---|---|---|---|---|
| Benchmark | [-] | 292. | |||||||||||||||
| Calib | [-] | 294. | 293. | 298. | 292. | 297. | 0.896 | 2.67 | 0.506 | 0.595 | 0.788 | 0.951 | 0.997 | 0.875 | 0.832 | ||
| Control | [-] | 294. | 293. | 298. | 292. | 297. | 0.988 | 2.72 | 0.500 | 0.586 | 0.789 | 0.952 | 0.996 | 0.874 | 0.831 |
Download Data |
Period Mean (original grids) [K] |
Model Period Mean (intersection) [K] |
Model Period Mean (complement) [K] |
Benchmark Period Mean (intersection) [K] |
Benchmark Period Mean (complement) [K] |
Bias [K] |
RMSE [K] |
Phase Shift [months] |
Bias Score [1] |
RMSE Score [1] |
Seasonal Cycle Score [1] |
Spatial Distribution Score [1] |
Interannual Variability Score [1] |
Overall Score [1] |
|||
|---|---|---|---|---|---|---|---|---|---|---|---|---|---|---|---|---|---|
| Benchmark | [-] | 260. | |||||||||||||||
| Calib | [-] | 260. | 260. | 266. | 260. | 263. | 0.380 | 2.18 | 0.211 | 0.913 | 0.912 | 0.981 | 0.997 | 0.918 | 0.939 | ||
| Control | [-] | 260. | 260. | 266. | 260. | 263. | 0.339 | 2.19 | 0.194 | 0.912 | 0.912 | 0.983 | 0.997 | 0.918 | 0.939 |
Download Data |
Period Mean (original grids) [K] |
Model Period Mean (intersection) [K] |
Model Period Mean (complement) [K] |
Benchmark Period Mean (intersection) [K] |
Benchmark Period Mean (complement) [K] |
Bias [K] |
RMSE [K] |
Phase Shift [months] |
Bias Score [1] |
RMSE Score [1] |
Seasonal Cycle Score [1] |
Spatial Distribution Score [1] |
Interannual Variability Score [1] |
Overall Score [1] |
|||
|---|---|---|---|---|---|---|---|---|---|---|---|---|---|---|---|---|---|
| Benchmark | [-] | 288. | |||||||||||||||
| Calib | [-] | 289. | 289. | 290. | 288. | 289. | 1.53 | 2.00 | 0.278 | 0.707 | 0.855 | 0.977 | 0.992 | 0.890 | 0.879 | ||
| Control | [-] | 289. | 289. | 290. | 288. | 289. | 1.52 | 1.99 | 0.289 | 0.708 | 0.855 | 0.976 | 0.993 | 0.889 | 0.880 |
Download Data |
Period Mean (original grids) [K] |
Model Period Mean (intersection) [K] |
Model Period Mean (complement) [K] |
Benchmark Period Mean (intersection) [K] |
Benchmark Period Mean (complement) [K] |
Bias [K] |
RMSE [K] |
Phase Shift [months] |
Bias Score [1] |
RMSE Score [1] |
Seasonal Cycle Score [1] |
Spatial Distribution Score [1] |
Interannual Variability Score [1] |
Overall Score [1] |
|||
|---|---|---|---|---|---|---|---|---|---|---|---|---|---|---|---|---|---|
| Benchmark | [-] | 278. | |||||||||||||||
| Calib | [-] | 278. | 279. | 282. | 278. | 285. | 0.545 | 2.16 | 0.0998 | 0.750 | 0.876 | 0.993 | 0.981 | 0.903 | 0.896 | ||
| Control | [-] | 278. | 279. | 282. | 278. | 285. | 0.526 | 2.16 | 0.0928 | 0.750 | 0.876 | 0.994 | 0.980 | 0.901 | 0.896 |
Download Data |
Period Mean (original grids) [K] |
Model Period Mean (intersection) [K] |
Model Period Mean (complement) [K] |
Benchmark Period Mean (intersection) [K] |
Benchmark Period Mean (complement) [K] |
Bias [K] |
RMSE [K] |
Phase Shift [months] |
Bias Score [1] |
RMSE Score [1] |
Seasonal Cycle Score [1] |
Spatial Distribution Score [1] |
Interannual Variability Score [1] |
Overall Score [1] |
|||
|---|---|---|---|---|---|---|---|---|---|---|---|---|---|---|---|---|---|
| Benchmark | [-] | 281. | |||||||||||||||
| Calib | [-] | 280. | 282. | 275. | 281. | 288. | 1.01 | 2.38 | 0.452 | 0.676 | 0.805 | 0.946 | 0.999 | 0.876 | 0.851 | ||
| Control | [-] | 280. | 282. | 275. | 281. | 288. | 1.00 | 2.38 | 0.454 | 0.675 | 0.806 | 0.946 | 0.999 | 0.876 | 0.851 |
Download Data |
Period Mean (original grids) [K] |
Model Period Mean (intersection) [K] |
Model Period Mean (complement) [K] |
Benchmark Period Mean (intersection) [K] |
Benchmark Period Mean (complement) [K] |
Bias [K] |
RMSE [K] |
Phase Shift [months] |
Bias Score [1] |
RMSE Score [1] |
Seasonal Cycle Score [1] |
Spatial Distribution Score [1] |
Interannual Variability Score [1] |
Overall Score [1] |
|||
|---|---|---|---|---|---|---|---|---|---|---|---|---|---|---|---|---|---|
| Benchmark | [-] | 289. | |||||||||||||||
| Calib | [-] | 290. | 290. | 293. | 289. | 286. | 0.923 | 2.09 | 0.429 | 0.780 | 0.865 | 0.966 | 0.992 | 0.905 | 0.896 | ||
| Control | [-] | 290. | 290. | 293. | 289. | 286. | 0.890 | 2.08 | 0.449 | 0.782 | 0.865 | 0.964 | 0.992 | 0.904 | 0.895 |
Download Data |
Period Mean (original grids) [K] |
Model Period Mean (intersection) [K] |
Model Period Mean (complement) [K] |
Benchmark Period Mean (intersection) [K] |
Benchmark Period Mean (complement) [K] |
Bias [K] |
RMSE [K] |
Phase Shift [months] |
Bias Score [1] |
RMSE Score [1] |
Seasonal Cycle Score [1] |
Spatial Distribution Score [1] |
Interannual Variability Score [1] |
Overall Score [1] |
|||
|---|---|---|---|---|---|---|---|---|---|---|---|---|---|---|---|---|---|
| Benchmark | [-] | 261. | |||||||||||||||
| Calib | [-] | 262. | 263. | 265. | 261. | 262. | 1.56 | 2.81 | 0.156 | 0.858 | 0.879 | 0.989 | 0.999 | 0.908 | 0.919 | ||
| Control | [-] | 262. | 263. | 265. | 261. | 262. | 1.53 | 2.79 | 0.156 | 0.859 | 0.879 | 0.989 | 0.999 | 0.908 | 0.919 |
Download Data |
Period Mean (original grids) [K] |
Model Period Mean (intersection) [K] |
Model Period Mean (complement) [K] |
Benchmark Period Mean (intersection) [K] |
Benchmark Period Mean (complement) [K] |
Bias [K] |
RMSE [K] |
Phase Shift [months] |
Bias Score [1] |
RMSE Score [1] |
Seasonal Cycle Score [1] |
Spatial Distribution Score [1] |
Interannual Variability Score [1] |
Overall Score [1] |
|||
|---|---|---|---|---|---|---|---|---|---|---|---|---|---|---|---|---|---|
| Benchmark | [-] | 289. | |||||||||||||||
| Calib | [-] | 293. | 292. | 296. | 289. | 294. | 2.78 | 3.86 | 0.733 | 0.400 | 0.722 | 0.920 | 0.995 | 0.832 | 0.765 | ||
| Control | [-] | 293. | 292. | 296. | 289. | 294. | 2.81 | 3.88 | 0.737 | 0.399 | 0.723 | 0.920 | 0.996 | 0.832 | 0.765 |
Download Data |
Period Mean (original grids) [K] |
Model Period Mean (intersection) [K] |
Model Period Mean (complement) [K] |
Benchmark Period Mean (intersection) [K] |
Benchmark Period Mean (complement) [K] |
Bias [K] |
RMSE [K] |
Phase Shift [months] |
Bias Score [1] |
RMSE Score [1] |
Seasonal Cycle Score [1] |
Spatial Distribution Score [1] |
Interannual Variability Score [1] |
Overall Score [1] |
|||
|---|---|---|---|---|---|---|---|---|---|---|---|---|---|---|---|---|---|
| Benchmark | [-] | 280. | |||||||||||||||
| Calib | [-] | 283. | 282. | 290. | 280. | 1.18 | 1.90 | 0.0943 | 0.830 | 0.908 | 0.993 | 0.986 | 0.928 | 0.926 | |||
| Control | [-] | 283. | 282. | 290. | 280. | 1.19 | 1.90 | 0.0849 | 0.830 | 0.909 | 0.994 | 0.987 | 0.927 | 0.926 |
Download Data |
Period Mean (original grids) [K] |
Model Period Mean (intersection) [K] |
Model Period Mean (complement) [K] |
Benchmark Period Mean (intersection) [K] |
Benchmark Period Mean (complement) [K] |
Bias [K] |
RMSE [K] |
Phase Shift [months] |
Bias Score [1] |
RMSE Score [1] |
Seasonal Cycle Score [1] |
Spatial Distribution Score [1] |
Interannual Variability Score [1] |
Overall Score [1] |
|||
|---|---|---|---|---|---|---|---|---|---|---|---|---|---|---|---|---|---|
| Benchmark | [-] | 269. | |||||||||||||||
| Calib | [-] | 270. | 270. | 276. | 269. | 277. | 0.949 | 2.14 | 0.135 | 0.851 | 0.887 | 0.991 | 0.975 | 0.926 | 0.919 | ||
| Control | [-] | 270. | 270. | 276. | 269. | 277. | 0.868 | 2.11 | 0.128 | 0.853 | 0.887 | 0.991 | 0.974 | 0.926 | 0.920 |
Download Data |
Period Mean (original grids) [K] |
Model Period Mean (intersection) [K] |
Model Period Mean (complement) [K] |
Benchmark Period Mean (intersection) [K] |
Benchmark Period Mean (complement) [K] |
Bias [K] |
RMSE [K] |
Phase Shift [months] |
Bias Score [1] |
RMSE Score [1] |
Seasonal Cycle Score [1] |
Spatial Distribution Score [1] |
Interannual Variability Score [1] |
Overall Score [1] |
|||
|---|---|---|---|---|---|---|---|---|---|---|---|---|---|---|---|---|---|
| Benchmark | [-] | 276. | |||||||||||||||
| Calib | [-] | 278. | 278. | 285. | 276. | 1.83 | 3.04 | 0.0861 | 0.703 | 0.865 | 0.994 | 1.00 | 0.899 | 0.888 | |||
| Control | [-] | 278. | 278. | 285. | 276. | 1.78 | 3.01 | 0.0833 | 0.705 | 0.866 | 0.994 | 1.00 | 0.900 | 0.888 |
Download Data |
Period Mean (original grids) [K] |
Model Period Mean (intersection) [K] |
Model Period Mean (complement) [K] |
Benchmark Period Mean (intersection) [K] |
Benchmark Period Mean (complement) [K] |
Bias [K] |
RMSE [K] |
Phase Shift [months] |
Bias Score [1] |
RMSE Score [1] |
Seasonal Cycle Score [1] |
Spatial Distribution Score [1] |
Interannual Variability Score [1] |
Overall Score [1] |
|||
|---|---|---|---|---|---|---|---|---|---|---|---|---|---|---|---|---|---|
| Benchmark | [-] | 294. | |||||||||||||||
| Calib | [-] | 296. | 295. | 297. | 294. | 296. | 0.937 | 1.92 | 1.75 | 0.314 | 0.546 | 0.728 | 1.00 | 0.824 | 0.660 | ||
| Control | [-] | 296. | 295. | 297. | 294. | 296. | 0.990 | 1.95 | 1.75 | 0.303 | 0.550 | 0.728 | 1.00 | 0.824 | 0.659 |
Download Data |
Period Mean (original grids) [K] |
Model Period Mean (intersection) [K] |
Model Period Mean (complement) [K] |
Benchmark Period Mean (intersection) [K] |
Benchmark Period Mean (complement) [K] |
Bias [K] |
RMSE [K] |
Phase Shift [months] |
Bias Score [1] |
RMSE Score [1] |
Seasonal Cycle Score [1] |
Spatial Distribution Score [1] |
Interannual Variability Score [1] |
Overall Score [1] |
|||
|---|---|---|---|---|---|---|---|---|---|---|---|---|---|---|---|---|---|
| Benchmark | [-] | 290. | |||||||||||||||
| Calib | [-] | 292. | 291. | 293. | 290. | 283. | 0.909 | 1.82 | 0.721 | 0.578 | 0.765 | 0.904 | 0.987 | 0.883 | 0.814 | ||
| Control | [-] | 292. | 291. | 293. | 290. | 283. | 0.935 | 1.83 | 0.721 | 0.575 | 0.766 | 0.904 | 0.987 | 0.882 | 0.813 |
Download Data |
Period Mean (original grids) [K] |
Model Period Mean (intersection) [K] |
Model Period Mean (complement) [K] |
Benchmark Period Mean (intersection) [K] |
Benchmark Period Mean (complement) [K] |
Bias [K] |
RMSE [K] |
Phase Shift [months] |
Bias Score [1] |
RMSE Score [1] |
Seasonal Cycle Score [1] |
Spatial Distribution Score [1] |
Interannual Variability Score [1] |
Overall Score [1] |
|||
|---|---|---|---|---|---|---|---|---|---|---|---|---|---|---|---|---|---|
| Benchmark | [-] | 278. | |||||||||||||||
| Calib | [-] | 281. | 280. | 284. | 278. | 276. | 2.57 | 5.03 | 0.383 | 0.389 | 0.742 | 0.967 | 0.989 | 0.842 | 0.778 | ||
| Control | [-] | 281. | 280. | 284. | 278. | 276. | 2.57 | 5.03 | 0.383 | 0.389 | 0.742 | 0.967 | 0.988 | 0.842 | 0.778 |
Temporally integrated period mean