Mean State
Download Data |
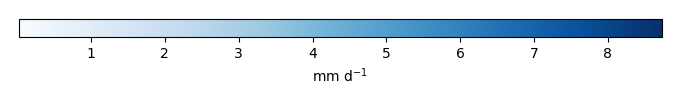
Period Mean (original grids) [mm d-1] |
Model Period Mean (intersection) [mm d-1] |
Model Period Mean (complement) [mm d-1] |
Benchmark Period Mean (intersection) [mm d-1] |
Benchmark Period Mean (complement) [mm d-1] |
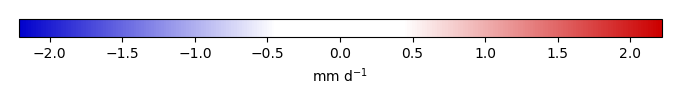
Bias [mm d-1] |
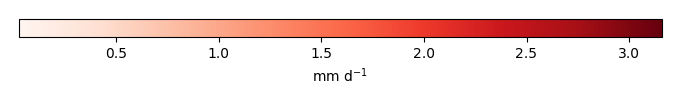
RMSE [mm d-1] |
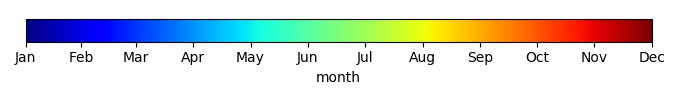
Phase Shift [months] |
Bias Score [1] |
RMSE Score [1] |
Seasonal Cycle Score [1] |
Spatial Distribution Score [1] |
Interannual Variability Score [1] |
Overall Score [1] |
|||
|---|---|---|---|---|---|---|---|---|---|---|---|---|---|---|---|---|---|
| Benchmark | [-] | 3.58 | |||||||||||||||
| Calib | [-] | 3.72 | 3.70 | 3.59 | 3.58 | 0.116 | 2.16 | 2.04 | 0.709 | 0.443 | 0.695 | 0.970 | 0.732 | 0.665 | |||
| Control | [-] | 3.72 | 3.70 | 3.59 | 3.58 | 0.116 | 2.16 | 2.04 | 0.709 | 0.443 | 0.695 | 0.970 | 0.732 | 0.665 |
Download Data |
Period Mean (original grids) [mm d-1] |
Model Period Mean (intersection) [mm d-1] |
Model Period Mean (complement) [mm d-1] |
Benchmark Period Mean (intersection) [mm d-1] |
Benchmark Period Mean (complement) [mm d-1] |
Bias [mm d-1] |
RMSE [mm d-1] |
Phase Shift [months] |
Bias Score [1] |
RMSE Score [1] |
Seasonal Cycle Score [1] |
Spatial Distribution Score [1] |
Interannual Variability Score [1] |
Overall Score [1] |
|||
|---|---|---|---|---|---|---|---|---|---|---|---|---|---|---|---|---|---|
| Benchmark | [-] | 2.15 | |||||||||||||||
| Calib | [-] | 2.19 | 2.31 | 3.88 | 2.15 | 2.24 | 0.159 | 1.50 | 0.389 | 0.802 | 0.575 | 0.954 | 0.943 | 0.722 | 0.762 | ||
| Control | [-] | 2.19 | 2.31 | 3.88 | 2.15 | 2.24 | 0.159 | 1.50 | 0.389 | 0.802 | 0.575 | 0.954 | 0.943 | 0.722 | 0.762 |
Download Data |
Period Mean (original grids) [mm d-1] |
Model Period Mean (intersection) [mm d-1] |
Model Period Mean (complement) [mm d-1] |
Benchmark Period Mean (intersection) [mm d-1] |
Benchmark Period Mean (complement) [mm d-1] |
Bias [mm d-1] |
RMSE [mm d-1] |
Phase Shift [months] |
Bias Score [1] |
RMSE Score [1] |
Seasonal Cycle Score [1] |
Spatial Distribution Score [1] |
Interannual Variability Score [1] |
Overall Score [1] |
|||
|---|---|---|---|---|---|---|---|---|---|---|---|---|---|---|---|---|---|
| Benchmark | [-] | 2.30 | |||||||||||||||
| Calib | [-] | 2.42 | 2.36 | 2.24 | 2.29 | 3.38 | 0.0682 | 1.53 | 1.27 | 0.839 | 0.545 | 0.812 | 0.986 | 0.764 | 0.748 | ||
| Control | [-] | 2.42 | 2.36 | 2.24 | 2.29 | 3.38 | 0.0682 | 1.53 | 1.27 | 0.839 | 0.545 | 0.812 | 0.986 | 0.764 | 0.748 |
Download Data |
Period Mean (original grids) [mm d-1] |
Model Period Mean (intersection) [mm d-1] |
Model Period Mean (complement) [mm d-1] |
Benchmark Period Mean (intersection) [mm d-1] |
Benchmark Period Mean (complement) [mm d-1] |
Bias [mm d-1] |
RMSE [mm d-1] |
Phase Shift [months] |
Bias Score [1] |
RMSE Score [1] |
Seasonal Cycle Score [1] |
Spatial Distribution Score [1] |
Interannual Variability Score [1] |
Overall Score [1] |
|||
|---|---|---|---|---|---|---|---|---|---|---|---|---|---|---|---|---|---|
| Benchmark | [-] | 0.957 | |||||||||||||||
| Calib | [-] | 1.13 | 1.16 | 1.42 | 0.952 | 1.38 | 0.212 | 0.663 | 1.19 | 0.679 | 0.412 | 0.805 | 0.872 | 0.662 | 0.640 | ||
| Control | [-] | 1.13 | 1.16 | 1.42 | 0.952 | 1.38 | 0.212 | 0.663 | 1.19 | 0.679 | 0.412 | 0.805 | 0.872 | 0.662 | 0.640 |
Download Data |
Period Mean (original grids) [mm d-1] |
Model Period Mean (intersection) [mm d-1] |
Model Period Mean (complement) [mm d-1] |
Benchmark Period Mean (intersection) [mm d-1] |
Benchmark Period Mean (complement) [mm d-1] |
Bias [mm d-1] |
RMSE [mm d-1] |
Phase Shift [months] |
Bias Score [1] |
RMSE Score [1] |
Seasonal Cycle Score [1] |
Spatial Distribution Score [1] |
Interannual Variability Score [1] |
Overall Score [1] |
|||
|---|---|---|---|---|---|---|---|---|---|---|---|---|---|---|---|---|---|
| Benchmark | [-] | 6.92 | |||||||||||||||
| Calib | [-] | 7.20 | 7.21 | 6.56 | 6.99 | 6.02 | 0.215 | 3.53 | 1.55 | 0.693 | 0.412 | 0.766 | 0.838 | 0.750 | 0.645 | ||
| Control | [-] | 7.20 | 7.21 | 6.56 | 6.99 | 6.02 | 0.215 | 3.53 | 1.55 | 0.693 | 0.412 | 0.766 | 0.838 | 0.750 | 0.645 |
Download Data |
Period Mean (original grids) [mm d-1] |
Model Period Mean (intersection) [mm d-1] |
Model Period Mean (complement) [mm d-1] |
Benchmark Period Mean (intersection) [mm d-1] |
Benchmark Period Mean (complement) [mm d-1] |
Bias [mm d-1] |
RMSE [mm d-1] |
Phase Shift [months] |
Bias Score [1] |
RMSE Score [1] |
Seasonal Cycle Score [1] |
Spatial Distribution Score [1] |
Interannual Variability Score [1] |
Overall Score [1] |
|||
|---|---|---|---|---|---|---|---|---|---|---|---|---|---|---|---|---|---|
| Benchmark | [-] | 1.36 | |||||||||||||||
| Calib | [-] | 1.50 | 1.47 | 1.96 | 1.35 | 1.99 | 0.126 | 0.543 | 0.442 | 0.814 | 0.567 | 0.955 | 0.957 | 0.782 | 0.774 | ||
| Control | [-] | 1.50 | 1.47 | 1.96 | 1.35 | 1.99 | 0.126 | 0.543 | 0.442 | 0.814 | 0.567 | 0.955 | 0.957 | 0.782 | 0.774 |
Download Data |
Period Mean (original grids) [mm d-1] |
Model Period Mean (intersection) [mm d-1] |
Model Period Mean (complement) [mm d-1] |
Benchmark Period Mean (intersection) [mm d-1] |
Benchmark Period Mean (complement) [mm d-1] |
Bias [mm d-1] |
RMSE [mm d-1] |
Phase Shift [months] |
Bias Score [1] |
RMSE Score [1] |
Seasonal Cycle Score [1] |
Spatial Distribution Score [1] |
Interannual Variability Score [1] |
Overall Score [1] |
|||
|---|---|---|---|---|---|---|---|---|---|---|---|---|---|---|---|---|---|
| Benchmark | [-] | 1.53 | |||||||||||||||
| Calib | [-] | 1.48 | 1.48 | 2.68 | 1.47 | 4.18 | 0.00379 | 0.853 | 0.946 | 0.771 | 0.534 | 0.878 | 0.976 | 0.754 | 0.741 | ||
| Control | [-] | 1.48 | 1.48 | 2.68 | 1.47 | 4.18 | 0.00379 | 0.853 | 0.946 | 0.771 | 0.534 | 0.878 | 0.976 | 0.754 | 0.741 |
Download Data |
Period Mean (original grids) [mm d-1] |
Model Period Mean (intersection) [mm d-1] |
Model Period Mean (complement) [mm d-1] |
Benchmark Period Mean (intersection) [mm d-1] |
Benchmark Period Mean (complement) [mm d-1] |
Bias [mm d-1] |
RMSE [mm d-1] |
Phase Shift [months] |
Bias Score [1] |
RMSE Score [1] |
Seasonal Cycle Score [1] |
Spatial Distribution Score [1] |
Interannual Variability Score [1] |
Overall Score [1] |
|||
|---|---|---|---|---|---|---|---|---|---|---|---|---|---|---|---|---|---|
| Benchmark | [-] | 3.47 | |||||||||||||||
| Calib | [-] | 3.91 | 3.75 | 4.99 | 3.47 | 5.52 | 0.282 | 2.98 | 0.835 | 0.718 | 0.483 | 0.897 | 0.889 | 0.721 | 0.699 | ||
| Control | [-] | 3.91 | 3.75 | 4.99 | 3.47 | 5.52 | 0.282 | 2.98 | 0.835 | 0.718 | 0.483 | 0.897 | 0.889 | 0.721 | 0.699 |
Download Data |
Period Mean (original grids) [mm d-1] |
Model Period Mean (intersection) [mm d-1] |
Model Period Mean (complement) [mm d-1] |
Benchmark Period Mean (intersection) [mm d-1] |
Benchmark Period Mean (complement) [mm d-1] |
Bias [mm d-1] |
RMSE [mm d-1] |
Phase Shift [months] |
Bias Score [1] |
RMSE Score [1] |
Seasonal Cycle Score [1] |
Spatial Distribution Score [1] |
Interannual Variability Score [1] |
Overall Score [1] |
|||
|---|---|---|---|---|---|---|---|---|---|---|---|---|---|---|---|---|---|
| Benchmark | [-] | 1.04 | |||||||||||||||
| Calib | [-] | 1.23 | 1.26 | 1.18 | 1.04 | 0.555 | 0.220 | 0.581 | 0.933 | 0.649 | 0.432 | 0.889 | 0.941 | 0.614 | 0.660 | ||
| Control | [-] | 1.23 | 1.26 | 1.18 | 1.04 | 0.555 | 0.220 | 0.581 | 0.933 | 0.649 | 0.432 | 0.889 | 0.941 | 0.614 | 0.660 |
Download Data |
Period Mean (original grids) [mm d-1] |
Model Period Mean (intersection) [mm d-1] |
Model Period Mean (complement) [mm d-1] |
Benchmark Period Mean (intersection) [mm d-1] |
Benchmark Period Mean (complement) [mm d-1] |
Bias [mm d-1] |
RMSE [mm d-1] |
Phase Shift [months] |
Bias Score [1] |
RMSE Score [1] |
Seasonal Cycle Score [1] |
Spatial Distribution Score [1] |
Interannual Variability Score [1] |
Overall Score [1] |
|||
|---|---|---|---|---|---|---|---|---|---|---|---|---|---|---|---|---|---|
| Benchmark | [-] | 1.59 | |||||||||||||||
| Calib | [-] | 1.76 | 1.59 | 2.49 | 1.55 | 3.30 | 0.0389 | 1.15 | 0.773 | 0.812 | 0.541 | 0.892 | 0.971 | 0.757 | 0.752 | ||
| Control | [-] | 1.76 | 1.59 | 2.49 | 1.55 | 3.30 | 0.0389 | 1.15 | 0.773 | 0.812 | 0.541 | 0.892 | 0.971 | 0.757 | 0.752 |
Download Data |
Period Mean (original grids) [mm d-1] |
Model Period Mean (intersection) [mm d-1] |
Model Period Mean (complement) [mm d-1] |
Benchmark Period Mean (intersection) [mm d-1] |
Benchmark Period Mean (complement) [mm d-1] |
Bias [mm d-1] |
RMSE [mm d-1] |
Phase Shift [months] |
Bias Score [1] |
RMSE Score [1] |
Seasonal Cycle Score [1] |
Spatial Distribution Score [1] |
Interannual Variability Score [1] |
Overall Score [1] |
|||
|---|---|---|---|---|---|---|---|---|---|---|---|---|---|---|---|---|---|
| Benchmark | [-] | 1.96 | |||||||||||||||
| Calib | [-] | 2.35 | 2.27 | 2.20 | 1.98 | 1.40 | 0.283 | 1.06 | 1.03 | 0.656 | 0.472 | 0.849 | 0.912 | 0.721 | 0.681 | ||
| Control | [-] | 2.35 | 2.27 | 2.20 | 1.98 | 1.40 | 0.283 | 1.06 | 1.03 | 0.656 | 0.472 | 0.849 | 0.912 | 0.721 | 0.681 |
Download Data |
Period Mean (original grids) [mm d-1] |
Model Period Mean (intersection) [mm d-1] |
Model Period Mean (complement) [mm d-1] |
Benchmark Period Mean (intersection) [mm d-1] |
Benchmark Period Mean (complement) [mm d-1] |
Bias [mm d-1] |
RMSE [mm d-1] |
Phase Shift [months] |
Bias Score [1] |
RMSE Score [1] |
Seasonal Cycle Score [1] |
Spatial Distribution Score [1] |
Interannual Variability Score [1] |
Overall Score [1] |
|||
|---|---|---|---|---|---|---|---|---|---|---|---|---|---|---|---|---|---|
| Benchmark | [-] | 2.22 | |||||||||||||||
| Calib | [-] | 2.35 | 2.30 | 2.49 | 2.15 | 4.01 | 0.148 | 1.31 | 1.04 | 0.738 | 0.498 | 0.852 | 0.964 | 0.739 | 0.715 | ||
| Control | [-] | 2.35 | 2.30 | 2.49 | 2.15 | 4.01 | 0.148 | 1.31 | 1.04 | 0.738 | 0.498 | 0.852 | 0.964 | 0.739 | 0.715 |
Download Data |
Period Mean (original grids) [mm d-1] |
Model Period Mean (intersection) [mm d-1] |
Model Period Mean (complement) [mm d-1] |
Benchmark Period Mean (intersection) [mm d-1] |
Benchmark Period Mean (complement) [mm d-1] |
Bias [mm d-1] |
RMSE [mm d-1] |
Phase Shift [months] |
Bias Score [1] |
RMSE Score [1] |
Seasonal Cycle Score [1] |
Spatial Distribution Score [1] |
Interannual Variability Score [1] |
Overall Score [1] |
|||
|---|---|---|---|---|---|---|---|---|---|---|---|---|---|---|---|---|---|
| Benchmark | [-] | 0.330 | |||||||||||||||
| Calib | [-] | 0.346 | 0.314 | 0.528 | 0.322 | 0.995 | -0.00752 | 0.410 | 1.41 | 0.698 | 0.454 | 0.845 | 0.933 | 0.699 | 0.681 | ||
| Control | [-] | 0.346 | 0.314 | 0.528 | 0.322 | 0.995 | -0.00752 | 0.410 | 1.41 | 0.698 | 0.454 | 0.845 | 0.933 | 0.699 | 0.681 |
Download Data |
Period Mean (original grids) [mm d-1] |
Model Period Mean (intersection) [mm d-1] |
Model Period Mean (complement) [mm d-1] |
Benchmark Period Mean (intersection) [mm d-1] |
Benchmark Period Mean (complement) [mm d-1] |
Bias [mm d-1] |
RMSE [mm d-1] |
Phase Shift [months] |
Bias Score [1] |
RMSE Score [1] |
Seasonal Cycle Score [1] |
Spatial Distribution Score [1] |
Interannual Variability Score [1] |
Overall Score [1] |
|||
|---|---|---|---|---|---|---|---|---|---|---|---|---|---|---|---|---|---|
| Benchmark | [-] | 1.09 | |||||||||||||||
| Calib | [-] | 1.18 | 1.21 | 1.40 | 1.09 | 0.805 | 0.114 | 0.739 | 0.840 | 0.678 | 0.434 | 0.894 | 0.958 | 0.718 | 0.686 | ||
| Control | [-] | 1.18 | 1.21 | 1.40 | 1.09 | 0.805 | 0.114 | 0.739 | 0.840 | 0.678 | 0.434 | 0.894 | 0.958 | 0.718 | 0.686 |
Download Data |
Period Mean (original grids) [mm d-1] |
Model Period Mean (intersection) [mm d-1] |
Model Period Mean (complement) [mm d-1] |
Benchmark Period Mean (intersection) [mm d-1] |
Benchmark Period Mean (complement) [mm d-1] |
Bias [mm d-1] |
RMSE [mm d-1] |
Phase Shift [months] |
Bias Score [1] |
RMSE Score [1] |
Seasonal Cycle Score [1] |
Spatial Distribution Score [1] |
Interannual Variability Score [1] |
Overall Score [1] |
|||
|---|---|---|---|---|---|---|---|---|---|---|---|---|---|---|---|---|---|
| Benchmark | [-] | 2.60 | |||||||||||||||
| Calib | [-] | 3.24 | 3.15 | 3.50 | 2.60 | 2.64 | 0.546 | 2.08 | 1.37 | 0.738 | 0.448 | 0.762 | 0.893 | 0.721 | 0.668 | ||
| Control | [-] | 3.24 | 3.15 | 3.50 | 2.60 | 2.64 | 0.546 | 2.08 | 1.37 | 0.738 | 0.448 | 0.762 | 0.893 | 0.721 | 0.668 |
Download Data |
Period Mean (original grids) [mm d-1] |
Model Period Mean (intersection) [mm d-1] |
Model Period Mean (complement) [mm d-1] |
Benchmark Period Mean (intersection) [mm d-1] |
Benchmark Period Mean (complement) [mm d-1] |
Bias [mm d-1] |
RMSE [mm d-1] |
Phase Shift [months] |
Bias Score [1] |
RMSE Score [1] |
Seasonal Cycle Score [1] |
Spatial Distribution Score [1] |
Interannual Variability Score [1] |
Overall Score [1] |
|||
|---|---|---|---|---|---|---|---|---|---|---|---|---|---|---|---|---|---|
| Benchmark | [-] | 2.69 | |||||||||||||||
| Calib | [-] | 3.31 | 3.15 | 3.51 | 2.69 | 0.464 | 1.22 | 1.08 | 0.726 | 0.482 | 0.825 | 0.973 | 0.751 | 0.707 | |||
| Control | [-] | 3.31 | 3.15 | 3.51 | 2.69 | 0.464 | 1.22 | 1.08 | 0.726 | 0.482 | 0.825 | 0.973 | 0.751 | 0.707 |
Download Data |
Period Mean (original grids) [mm d-1] |
Model Period Mean (intersection) [mm d-1] |
Model Period Mean (complement) [mm d-1] |
Benchmark Period Mean (intersection) [mm d-1] |
Benchmark Period Mean (complement) [mm d-1] |
Bias [mm d-1] |
RMSE [mm d-1] |
Phase Shift [months] |
Bias Score [1] |
RMSE Score [1] |
Seasonal Cycle Score [1] |
Spatial Distribution Score [1] |
Interannual Variability Score [1] |
Overall Score [1] |
|||
|---|---|---|---|---|---|---|---|---|---|---|---|---|---|---|---|---|---|
| Benchmark | [-] | 2.01 | |||||||||||||||
| Calib | [-] | 2.23 | 2.22 | 3.76 | 2.00 | 4.25 | 0.221 | 1.02 | 0.885 | 0.650 | 0.456 | 0.841 | 0.868 | 0.705 | 0.663 | ||
| Control | [-] | 2.23 | 2.22 | 3.76 | 2.00 | 4.25 | 0.221 | 1.02 | 0.885 | 0.650 | 0.456 | 0.841 | 0.868 | 0.705 | 0.663 |
Download Data |
Period Mean (original grids) [mm d-1] |
Model Period Mean (intersection) [mm d-1] |
Model Period Mean (complement) [mm d-1] |
Benchmark Period Mean (intersection) [mm d-1] |
Benchmark Period Mean (complement) [mm d-1] |
Bias [mm d-1] |
RMSE [mm d-1] |
Phase Shift [months] |
Bias Score [1] |
RMSE Score [1] |
Seasonal Cycle Score [1] |
Spatial Distribution Score [1] |
Interannual Variability Score [1] |
Overall Score [1] |
|||
|---|---|---|---|---|---|---|---|---|---|---|---|---|---|---|---|---|---|
| Benchmark | [-] | 0.943 | |||||||||||||||
| Calib | [-] | 1.19 | 1.22 | 2.19 | 0.943 | 0.278 | 0.844 | 0.998 | 0.647 | 0.456 | 0.877 | 0.932 | 0.646 | 0.669 | |||
| Control | [-] | 1.19 | 1.22 | 2.19 | 0.943 | 0.278 | 0.844 | 0.998 | 0.647 | 0.456 | 0.877 | 0.932 | 0.646 | 0.669 |
Download Data |
Period Mean (original grids) [mm d-1] |
Model Period Mean (intersection) [mm d-1] |
Model Period Mean (complement) [mm d-1] |
Benchmark Period Mean (intersection) [mm d-1] |
Benchmark Period Mean (complement) [mm d-1] |
Bias [mm d-1] |
RMSE [mm d-1] |
Phase Shift [months] |
Bias Score [1] |
RMSE Score [1] |
Seasonal Cycle Score [1] |
Spatial Distribution Score [1] |
Interannual Variability Score [1] |
Overall Score [1] |
|||
|---|---|---|---|---|---|---|---|---|---|---|---|---|---|---|---|---|---|
| Benchmark | [-] | 5.63 | |||||||||||||||
| Calib | [-] | 6.14 | 6.08 | 6.06 | 5.63 | 5.95 | 0.453 | 2.64 | 0.861 | 0.718 | 0.518 | 0.906 | 0.962 | 0.735 | 0.726 | ||
| Control | [-] | 6.14 | 6.08 | 6.06 | 5.63 | 5.95 | 0.453 | 2.64 | 0.861 | 0.718 | 0.518 | 0.906 | 0.962 | 0.735 | 0.726 |
Download Data |
Period Mean (original grids) [mm d-1] |
Model Period Mean (intersection) [mm d-1] |
Model Period Mean (complement) [mm d-1] |
Benchmark Period Mean (intersection) [mm d-1] |
Benchmark Period Mean (complement) [mm d-1] |
Bias [mm d-1] |
RMSE [mm d-1] |
Phase Shift [months] |
Bias Score [1] |
RMSE Score [1] |
Seasonal Cycle Score [1] |
Spatial Distribution Score [1] |
Interannual Variability Score [1] |
Overall Score [1] |
|||
|---|---|---|---|---|---|---|---|---|---|---|---|---|---|---|---|---|---|
| Benchmark | [-] | 3.41 | |||||||||||||||
| Calib | [-] | 3.34 | 3.26 | 3.59 | 3.41 | 3.40 | -0.151 | 1.47 | 1.05 | 0.843 | 0.586 | 0.833 | 0.984 | 0.822 | 0.775 | ||
| Control | [-] | 3.34 | 3.26 | 3.59 | 3.41 | 3.40 | -0.151 | 1.47 | 1.05 | 0.843 | 0.586 | 0.833 | 0.984 | 0.822 | 0.775 |
Download Data |
Period Mean (original grids) [mm d-1] |
Model Period Mean (intersection) [mm d-1] |
Model Period Mean (complement) [mm d-1] |
Benchmark Period Mean (intersection) [mm d-1] |
Benchmark Period Mean (complement) [mm d-1] |
Bias [mm d-1] |
RMSE [mm d-1] |
Phase Shift [months] |
Bias Score [1] |
RMSE Score [1] |
Seasonal Cycle Score [1] |
Spatial Distribution Score [1] |
Interannual Variability Score [1] |
Overall Score [1] |
|||
|---|---|---|---|---|---|---|---|---|---|---|---|---|---|---|---|---|---|
| Benchmark | [-] | 1.42 | |||||||||||||||
| Calib | [-] | 2.04 | 1.74 | 1.17 | 1.42 | 1.52 | 0.314 | 1.50 | 1.28 | 0.532 | 0.443 | 0.849 | 0.740 | 0.642 | 0.608 | ||
| Control | [-] | 2.04 | 1.74 | 1.17 | 1.42 | 1.52 | 0.314 | 1.50 | 1.28 | 0.532 | 0.443 | 0.849 | 0.740 | 0.642 | 0.608 |
Temporally integrated period mean