Mean State
Download Data |
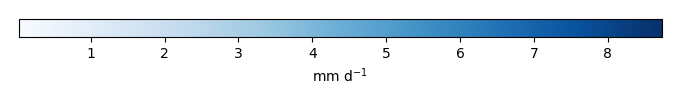
Period Mean (original grids) [mm d-1] |
Model Period Mean (intersection) [mm d-1] |
Model Period Mean (complement) [mm d-1] |
Benchmark Period Mean (intersection) [mm d-1] |
Benchmark Period Mean (complement) [mm d-1] |
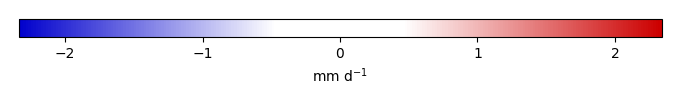
Bias [mm d-1] |
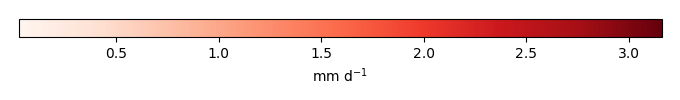
RMSE [mm d-1] |
Phase Shift [months] |
Bias Score [1] |
RMSE Score [1] |
Seasonal Cycle Score [1] |
Spatial Distribution Score [1] |
Interannual Variability Score [1] |
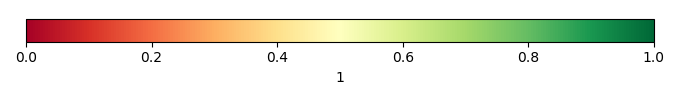
Overall Score [1] |
|||
|---|---|---|---|---|---|---|---|---|---|---|---|---|---|---|---|---|---|
| Benchmark | [-] | 3.68 | |||||||||||||||
| Calib | [-] | 3.72 | 3.69 | 3.67 | 4.67 | 0.0190 | 2.00 | 1.25 | 0.702 | 0.459 | 0.843 | 0.966 | 0.652 | 0.680 | |||
| Control | [-] | 3.72 | 3.69 | 3.67 | 4.67 | 0.0190 | 2.00 | 1.25 | 0.702 | 0.459 | 0.843 | 0.966 | 0.652 | 0.680 |
Download Data |
Period Mean (original grids) [mm d-1] |
Model Period Mean (intersection) [mm d-1] |
Model Period Mean (complement) [mm d-1] |
Benchmark Period Mean (intersection) [mm d-1] |
Benchmark Period Mean (complement) [mm d-1] |
Bias [mm d-1] |
RMSE [mm d-1] |
Phase Shift [months] |
Bias Score [1] |
RMSE Score [1] |
Seasonal Cycle Score [1] |
Spatial Distribution Score [1] |
Interannual Variability Score [1] |
Overall Score [1] |
|||
|---|---|---|---|---|---|---|---|---|---|---|---|---|---|---|---|---|---|
| Benchmark | [-] | 2.47 | |||||||||||||||
| Calib | [-] | 2.19 | 2.33 | 2.48 | 1.21 | -0.150 | 1.49 | 0.491 | 0.806 | 0.601 | 0.938 | 0.971 | 0.706 | 0.770 | |||
| Control | [-] | 2.19 | 2.33 | 2.48 | 1.21 | -0.150 | 1.49 | 0.491 | 0.806 | 0.601 | 0.938 | 0.971 | 0.706 | 0.770 |
Download Data |
Period Mean (original grids) [mm d-1] |
Model Period Mean (intersection) [mm d-1] |
Model Period Mean (complement) [mm d-1] |
Benchmark Period Mean (intersection) [mm d-1] |
Benchmark Period Mean (complement) [mm d-1] |
Bias [mm d-1] |
RMSE [mm d-1] |
Phase Shift [months] |
Bias Score [1] |
RMSE Score [1] |
Seasonal Cycle Score [1] |
Spatial Distribution Score [1] |
Interannual Variability Score [1] |
Overall Score [1] |
|||
|---|---|---|---|---|---|---|---|---|---|---|---|---|---|---|---|---|---|
| Benchmark | [-] | 2.47 | |||||||||||||||
| Calib | [-] | 2.42 | 2.35 | 2.46 | 3.24 | -0.107 | 1.38 | 1.02 | 0.837 | 0.589 | 0.866 | 0.988 | 0.719 | 0.765 | |||
| Control | [-] | 2.42 | 2.35 | 2.46 | 3.24 | -0.107 | 1.38 | 1.02 | 0.837 | 0.589 | 0.866 | 0.988 | 0.719 | 0.765 |
Download Data |
Period Mean (original grids) [mm d-1] |
Model Period Mean (intersection) [mm d-1] |
Model Period Mean (complement) [mm d-1] |
Benchmark Period Mean (intersection) [mm d-1] |
Benchmark Period Mean (complement) [mm d-1] |
Bias [mm d-1] |
RMSE [mm d-1] |
Phase Shift [months] |
Bias Score [1] |
RMSE Score [1] |
Seasonal Cycle Score [1] |
Spatial Distribution Score [1] |
Interannual Variability Score [1] |
Overall Score [1] |
|||
|---|---|---|---|---|---|---|---|---|---|---|---|---|---|---|---|---|---|
| Benchmark | [-] | 1.31 | |||||||||||||||
| Calib | [-] | 1.13 | 1.19 | 1.30 | 1.58 | -0.112 | 0.640 | 1.07 | 0.724 | 0.505 | 0.826 | 0.921 | 0.796 | 0.713 | |||
| Control | [-] | 1.13 | 1.19 | 1.30 | 1.58 | -0.112 | 0.640 | 1.07 | 0.724 | 0.505 | 0.826 | 0.921 | 0.796 | 0.713 |
Download Data |
Period Mean (original grids) [mm d-1] |
Model Period Mean (intersection) [mm d-1] |
Model Period Mean (complement) [mm d-1] |
Benchmark Period Mean (intersection) [mm d-1] |
Benchmark Period Mean (complement) [mm d-1] |
Bias [mm d-1] |
RMSE [mm d-1] |
Phase Shift [months] |
Bias Score [1] |
RMSE Score [1] |
Seasonal Cycle Score [1] |
Spatial Distribution Score [1] |
Interannual Variability Score [1] |
Overall Score [1] |
|||
|---|---|---|---|---|---|---|---|---|---|---|---|---|---|---|---|---|---|
| Benchmark | [-] | 6.85 | |||||||||||||||
| Calib | [-] | 7.20 | 7.07 | 7.03 | 5.07 | 0.0429 | 3.39 | 1.26 | 0.625 | 0.403 | 0.818 | 0.954 | 0.700 | 0.650 | |||
| Control | [-] | 7.20 | 7.07 | 7.03 | 5.07 | 0.0429 | 3.39 | 1.26 | 0.625 | 0.403 | 0.818 | 0.954 | 0.700 | 0.650 |
Download Data |
Period Mean (original grids) [mm d-1] |
Model Period Mean (intersection) [mm d-1] |
Model Period Mean (complement) [mm d-1] |
Benchmark Period Mean (intersection) [mm d-1] |
Benchmark Period Mean (complement) [mm d-1] |
Bias [mm d-1] |
RMSE [mm d-1] |
Phase Shift [months] |
Bias Score [1] |
RMSE Score [1] |
Seasonal Cycle Score [1] |
Spatial Distribution Score [1] |
Interannual Variability Score [1] |
Overall Score [1] |
|||
|---|---|---|---|---|---|---|---|---|---|---|---|---|---|---|---|---|---|
| Benchmark | [-] | 1.73 | |||||||||||||||
| Calib | [-] | 1.50 | 1.48 | 1.72 | 2.50 | -0.241 | 0.605 | 0.836 | 0.725 | 0.580 | 0.863 | 0.971 | 0.874 | 0.765 | |||
| Control | [-] | 1.50 | 1.48 | 1.72 | 2.50 | -0.241 | 0.605 | 0.836 | 0.725 | 0.580 | 0.863 | 0.971 | 0.874 | 0.765 |
Download Data |
Period Mean (original grids) [mm d-1] |
Model Period Mean (intersection) [mm d-1] |
Model Period Mean (complement) [mm d-1] |
Benchmark Period Mean (intersection) [mm d-1] |
Benchmark Period Mean (complement) [mm d-1] |
Bias [mm d-1] |
RMSE [mm d-1] |
Phase Shift [months] |
Bias Score [1] |
RMSE Score [1] |
Seasonal Cycle Score [1] |
Spatial Distribution Score [1] |
Interannual Variability Score [1] |
Overall Score [1] |
|||
|---|---|---|---|---|---|---|---|---|---|---|---|---|---|---|---|---|---|
| Benchmark | [-] | 1.77 | |||||||||||||||
| Calib | [-] | 1.48 | 1.51 | 1.69 | 4.32 | -0.187 | 0.881 | 0.964 | 0.744 | 0.558 | 0.871 | 0.980 | 0.797 | 0.752 | |||
| Control | [-] | 1.48 | 1.51 | 1.69 | 4.32 | -0.187 | 0.881 | 0.964 | 0.744 | 0.558 | 0.871 | 0.980 | 0.797 | 0.752 |
Download Data |
Period Mean (original grids) [mm d-1] |
Model Period Mean (intersection) [mm d-1] |
Model Period Mean (complement) [mm d-1] |
Benchmark Period Mean (intersection) [mm d-1] |
Benchmark Period Mean (complement) [mm d-1] |
Bias [mm d-1] |
RMSE [mm d-1] |
Phase Shift [months] |
Bias Score [1] |
RMSE Score [1] |
Seasonal Cycle Score [1] |
Spatial Distribution Score [1] |
Interannual Variability Score [1] |
Overall Score [1] |
|||
|---|---|---|---|---|---|---|---|---|---|---|---|---|---|---|---|---|---|
| Benchmark | [-] | 3.88 | |||||||||||||||
| Calib | [-] | 3.91 | 3.85 | 3.88 | 4.17 | -0.0257 | 2.73 | 0.858 | 0.750 | 0.539 | 0.896 | 0.927 | 0.738 | 0.732 | |||
| Control | [-] | 3.91 | 3.85 | 3.88 | 4.17 | -0.0257 | 2.73 | 0.858 | 0.750 | 0.539 | 0.896 | 0.927 | 0.738 | 0.732 |
Download Data |
Period Mean (original grids) [mm d-1] |
Model Period Mean (intersection) [mm d-1] |
Model Period Mean (complement) [mm d-1] |
Benchmark Period Mean (intersection) [mm d-1] |
Benchmark Period Mean (complement) [mm d-1] |
Bias [mm d-1] |
RMSE [mm d-1] |
Phase Shift [months] |
Bias Score [1] |
RMSE Score [1] |
Seasonal Cycle Score [1] |
Spatial Distribution Score [1] |
Interannual Variability Score [1] |
Overall Score [1] |
|||
|---|---|---|---|---|---|---|---|---|---|---|---|---|---|---|---|---|---|
| Benchmark | [-] | 1.52 | |||||||||||||||
| Calib | [-] | 1.23 | 1.26 | 1.53 | 1.10 | -0.266 | 0.597 | 0.878 | 0.645 | 0.525 | 0.891 | 0.956 | 0.844 | 0.731 | |||
| Control | [-] | 1.23 | 1.26 | 1.53 | 1.10 | -0.266 | 0.597 | 0.878 | 0.645 | 0.525 | 0.891 | 0.956 | 0.844 | 0.731 |
Download Data |
Period Mean (original grids) [mm d-1] |
Model Period Mean (intersection) [mm d-1] |
Model Period Mean (complement) [mm d-1] |
Benchmark Period Mean (intersection) [mm d-1] |
Benchmark Period Mean (complement) [mm d-1] |
Bias [mm d-1] |
RMSE [mm d-1] |
Phase Shift [months] |
Bias Score [1] |
RMSE Score [1] |
Seasonal Cycle Score [1] |
Spatial Distribution Score [1] |
Interannual Variability Score [1] |
Overall Score [1] |
|||
|---|---|---|---|---|---|---|---|---|---|---|---|---|---|---|---|---|---|
| Benchmark | [-] | 1.80 | |||||||||||||||
| Calib | [-] | 1.76 | 1.66 | 1.74 | 3.45 | -0.0755 | 1.15 | 0.730 | 0.801 | 0.568 | 0.880 | 0.970 | 0.786 | 0.762 | |||
| Control | [-] | 1.76 | 1.66 | 1.74 | 3.45 | -0.0755 | 1.15 | 0.730 | 0.801 | 0.568 | 0.880 | 0.970 | 0.786 | 0.762 |
Download Data |
Period Mean (original grids) [mm d-1] |
Model Period Mean (intersection) [mm d-1] |
Model Period Mean (complement) [mm d-1] |
Benchmark Period Mean (intersection) [mm d-1] |
Benchmark Period Mean (complement) [mm d-1] |
Bias [mm d-1] |
RMSE [mm d-1] |
Phase Shift [months] |
Bias Score [1] |
RMSE Score [1] |
Seasonal Cycle Score [1] |
Spatial Distribution Score [1] |
Interannual Variability Score [1] |
Overall Score [1] |
|||
|---|---|---|---|---|---|---|---|---|---|---|---|---|---|---|---|---|---|
| Benchmark | [-] | 2.58 | |||||||||||||||
| Calib | [-] | 2.35 | 2.26 | 2.60 | 2.24 | -0.342 | 1.13 | 1.10 | 0.693 | 0.532 | 0.842 | 0.979 | 0.808 | 0.731 | |||
| Control | [-] | 2.35 | 2.26 | 2.60 | 2.24 | -0.342 | 1.13 | 1.10 | 0.693 | 0.532 | 0.842 | 0.979 | 0.808 | 0.731 |
Download Data |
Period Mean (original grids) [mm d-1] |
Model Period Mean (intersection) [mm d-1] |
Model Period Mean (complement) [mm d-1] |
Benchmark Period Mean (intersection) [mm d-1] |
Benchmark Period Mean (complement) [mm d-1] |
Bias [mm d-1] |
RMSE [mm d-1] |
Phase Shift [months] |
Bias Score [1] |
RMSE Score [1] |
Seasonal Cycle Score [1] |
Spatial Distribution Score [1] |
Interannual Variability Score [1] |
Overall Score [1] |
|||
|---|---|---|---|---|---|---|---|---|---|---|---|---|---|---|---|---|---|
| Benchmark | [-] | 2.68 | |||||||||||||||
| Calib | [-] | 2.35 | 2.35 | 2.35 | 2.91 | -0.00337 | 1.34 | 1.20 | 0.714 | 0.503 | 0.839 | 0.963 | 0.752 | 0.712 | |||
| Control | [-] | 2.35 | 2.35 | 2.35 | 2.91 | -0.00337 | 1.34 | 1.20 | 0.714 | 0.503 | 0.839 | 0.963 | 0.752 | 0.712 |
Download Data |
Period Mean (original grids) [mm d-1] |
Model Period Mean (intersection) [mm d-1] |
Model Period Mean (complement) [mm d-1] |
Benchmark Period Mean (intersection) [mm d-1] |
Benchmark Period Mean (complement) [mm d-1] |
Bias [mm d-1] |
RMSE [mm d-1] |
Phase Shift [months] |
Bias Score [1] |
RMSE Score [1] |
Seasonal Cycle Score [1] |
Spatial Distribution Score [1] |
Interannual Variability Score [1] |
Overall Score [1] |
|||
|---|---|---|---|---|---|---|---|---|---|---|---|---|---|---|---|---|---|
| Benchmark | [-] | 0.411 | |||||||||||||||
| Calib | [-] | 0.346 | 0.324 | 0.395 | 1.10 | -0.0716 | 0.416 | 1.16 | 0.693 | 0.486 | 0.862 | 0.933 | 0.709 | 0.695 | |||
| Control | [-] | 0.346 | 0.324 | 0.395 | 1.10 | -0.0716 | 0.416 | 1.16 | 0.693 | 0.486 | 0.862 | 0.933 | 0.709 | 0.695 |
Download Data |
Period Mean (original grids) [mm d-1] |
Model Period Mean (intersection) [mm d-1] |
Model Period Mean (complement) [mm d-1] |
Benchmark Period Mean (intersection) [mm d-1] |
Benchmark Period Mean (complement) [mm d-1] |
Bias [mm d-1] |
RMSE [mm d-1] |
Phase Shift [months] |
Bias Score [1] |
RMSE Score [1] |
Seasonal Cycle Score [1] |
Spatial Distribution Score [1] |
Interannual Variability Score [1] |
Overall Score [1] |
|||
|---|---|---|---|---|---|---|---|---|---|---|---|---|---|---|---|---|---|
| Benchmark | [-] | 1.28 | |||||||||||||||
| Calib | [-] | 1.18 | 1.22 | 1.28 | 1.80 | -0.0525 | 0.652 | 0.711 | 0.686 | 0.500 | 0.878 | 0.950 | 0.753 | 0.711 | |||
| Control | [-] | 1.18 | 1.22 | 1.28 | 1.80 | -0.0525 | 0.652 | 0.711 | 0.686 | 0.500 | 0.878 | 0.950 | 0.753 | 0.711 |
Download Data |
Period Mean (original grids) [mm d-1] |
Model Period Mean (intersection) [mm d-1] |
Model Period Mean (complement) [mm d-1] |
Benchmark Period Mean (intersection) [mm d-1] |
Benchmark Period Mean (complement) [mm d-1] |
Bias [mm d-1] |
RMSE [mm d-1] |
Phase Shift [months] |
Bias Score [1] |
RMSE Score [1] |
Seasonal Cycle Score [1] |
Spatial Distribution Score [1] |
Interannual Variability Score [1] |
Overall Score [1] |
|||
|---|---|---|---|---|---|---|---|---|---|---|---|---|---|---|---|---|---|
| Benchmark | [-] | 3.08 | |||||||||||||||
| Calib | [-] | 3.24 | 3.21 | 3.07 | 3.24 | 0.138 | 2.01 | 1.01 | 0.700 | 0.501 | 0.835 | 0.958 | 0.733 | 0.705 | |||
| Control | [-] | 3.24 | 3.21 | 3.07 | 3.24 | 0.138 | 2.01 | 1.01 | 0.700 | 0.501 | 0.835 | 0.958 | 0.733 | 0.705 |
Download Data |
Period Mean (original grids) [mm d-1] |
Model Period Mean (intersection) [mm d-1] |
Model Period Mean (complement) [mm d-1] |
Benchmark Period Mean (intersection) [mm d-1] |
Benchmark Period Mean (complement) [mm d-1] |
Bias [mm d-1] |
RMSE [mm d-1] |
Phase Shift [months] |
Bias Score [1] |
RMSE Score [1] |
Seasonal Cycle Score [1] |
Spatial Distribution Score [1] |
Interannual Variability Score [1] |
Overall Score [1] |
|||
|---|---|---|---|---|---|---|---|---|---|---|---|---|---|---|---|---|---|
| Benchmark | [-] | 3.33 | |||||||||||||||
| Calib | [-] | 3.31 | 3.18 | 3.33 | -0.148 | 1.17 | 1.27 | 0.840 | 0.538 | 0.783 | 0.984 | 0.887 | 0.761 | ||||
| Control | [-] | 3.31 | 3.18 | 3.33 | -0.148 | 1.17 | 1.27 | 0.840 | 0.538 | 0.783 | 0.984 | 0.887 | 0.761 |
Download Data |
Period Mean (original grids) [mm d-1] |
Model Period Mean (intersection) [mm d-1] |
Model Period Mean (complement) [mm d-1] |
Benchmark Period Mean (intersection) [mm d-1] |
Benchmark Period Mean (complement) [mm d-1] |
Bias [mm d-1] |
RMSE [mm d-1] |
Phase Shift [months] |
Bias Score [1] |
RMSE Score [1] |
Seasonal Cycle Score [1] |
Spatial Distribution Score [1] |
Interannual Variability Score [1] |
Overall Score [1] |
|||
|---|---|---|---|---|---|---|---|---|---|---|---|---|---|---|---|---|---|
| Benchmark | [-] | 2.36 | |||||||||||||||
| Calib | [-] | 2.23 | 2.27 | 2.33 | 5.01 | -0.0641 | 0.902 | 0.875 | 0.727 | 0.532 | 0.825 | 0.972 | 0.792 | 0.730 | |||
| Control | [-] | 2.23 | 2.27 | 2.33 | 5.01 | -0.0641 | 0.902 | 0.875 | 0.727 | 0.532 | 0.825 | 0.972 | 0.792 | 0.730 |
Download Data |
Period Mean (original grids) [mm d-1] |
Model Period Mean (intersection) [mm d-1] |
Model Period Mean (complement) [mm d-1] |
Benchmark Period Mean (intersection) [mm d-1] |
Benchmark Period Mean (complement) [mm d-1] |
Bias [mm d-1] |
RMSE [mm d-1] |
Phase Shift [months] |
Bias Score [1] |
RMSE Score [1] |
Seasonal Cycle Score [1] |
Spatial Distribution Score [1] |
Interannual Variability Score [1] |
Overall Score [1] |
|||
|---|---|---|---|---|---|---|---|---|---|---|---|---|---|---|---|---|---|
| Benchmark | [-] | 1.32 | |||||||||||||||
| Calib | [-] | 1.19 | 1.24 | 1.32 | -0.0830 | 0.835 | 1.19 | 0.730 | 0.539 | 0.847 | 0.905 | 0.753 | 0.719 | ||||
| Control | [-] | 1.19 | 1.24 | 1.32 | -0.0830 | 0.835 | 1.19 | 0.730 | 0.539 | 0.847 | 0.905 | 0.753 | 0.719 |
Download Data |
Period Mean (original grids) [mm d-1] |
Model Period Mean (intersection) [mm d-1] |
Model Period Mean (complement) [mm d-1] |
Benchmark Period Mean (intersection) [mm d-1] |
Benchmark Period Mean (complement) [mm d-1] |
Bias [mm d-1] |
RMSE [mm d-1] |
Phase Shift [months] |
Bias Score [1] |
RMSE Score [1] |
Seasonal Cycle Score [1] |
Spatial Distribution Score [1] |
Interannual Variability Score [1] |
Overall Score [1] |
|||
|---|---|---|---|---|---|---|---|---|---|---|---|---|---|---|---|---|---|
| Benchmark | [-] | 6.19 | |||||||||||||||
| Calib | [-] | 6.14 | 6.08 | 6.20 | 3.95 | -0.120 | 2.43 | 0.813 | 0.735 | 0.553 | 0.901 | 0.953 | 0.725 | 0.736 | |||
| Control | [-] | 6.14 | 6.08 | 6.20 | 3.95 | -0.120 | 2.43 | 0.813 | 0.735 | 0.553 | 0.901 | 0.953 | 0.725 | 0.736 |
Download Data |
Period Mean (original grids) [mm d-1] |
Model Period Mean (intersection) [mm d-1] |
Model Period Mean (complement) [mm d-1] |
Benchmark Period Mean (intersection) [mm d-1] |
Benchmark Period Mean (complement) [mm d-1] |
Bias [mm d-1] |
RMSE [mm d-1] |
Phase Shift [months] |
Bias Score [1] |
RMSE Score [1] |
Seasonal Cycle Score [1] |
Spatial Distribution Score [1] |
Interannual Variability Score [1] |
Overall Score [1] |
|||
|---|---|---|---|---|---|---|---|---|---|---|---|---|---|---|---|---|---|
| Benchmark | [-] | 3.52 | |||||||||||||||
| Calib | [-] | 3.34 | 3.28 | 3.53 | 3.08 | -0.249 | 1.48 | 1.08 | 0.821 | 0.602 | 0.826 | 0.990 | 0.841 | 0.781 | |||
| Control | [-] | 3.34 | 3.28 | 3.53 | 3.08 | -0.249 | 1.48 | 1.08 | 0.821 | 0.602 | 0.826 | 0.990 | 0.841 | 0.781 |
Download Data |
Period Mean (original grids) [mm d-1] |
Model Period Mean (intersection) [mm d-1] |
Model Period Mean (complement) [mm d-1] |
Benchmark Period Mean (intersection) [mm d-1] |
Benchmark Period Mean (complement) [mm d-1] |
Bias [mm d-1] |
RMSE [mm d-1] |
Phase Shift [months] |
Bias Score [1] |
RMSE Score [1] |
Seasonal Cycle Score [1] |
Spatial Distribution Score [1] |
Interannual Variability Score [1] |
Overall Score [1] |
|||
|---|---|---|---|---|---|---|---|---|---|---|---|---|---|---|---|---|---|
| Benchmark | [-] | 1.85 | |||||||||||||||
| Calib | [-] | 2.04 | 1.68 | 1.85 | 1.94 | -0.176 | 1.44 | 0.974 | 0.485 | 0.474 | 0.887 | 0.902 | 0.689 | 0.652 | |||
| Control | [-] | 2.04 | 1.68 | 1.85 | 1.94 | -0.176 | 1.44 | 0.974 | 0.485 | 0.474 | 0.887 | 0.902 | 0.689 | 0.652 |
Temporally integrated period mean