Mean State
Download Data |
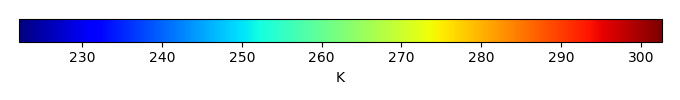
Period Mean (original grids) [K] |
Model Period Mean (intersection) [K] |
Model Period Mean (complement) [K] |
Benchmark Period Mean (intersection) [K] |
Benchmark Period Mean (complement) [K] |
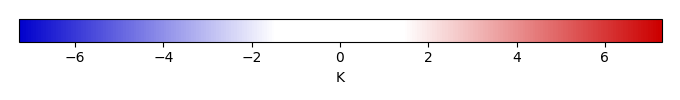
Bias [K] |
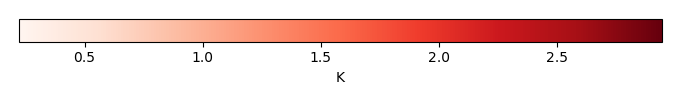
RMSE [K] |
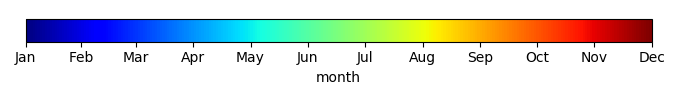
Phase Shift [months] |
Bias Score [1] |
RMSE Score [1] |
Seasonal Cycle Score [1] |
Spatial Distribution Score [1] |
Interannual Variability Score [1] |
Overall Score [1] |
|||
|---|---|---|---|---|---|---|---|---|---|---|---|---|---|---|---|---|---|
| Benchmark | [-] | 299. | |||||||||||||||
| Calib | [-] | 299. | 299. | 300. | 299. | -0.0219 | 1.23 | 0.536 | 0.520 | 0.673 | 0.941 | 0.996 | 0.892 | 0.783 | |||
| Control | [-] | 299. | 299. | 300. | 299. | 0.0694 | 1.23 | 0.536 | 0.509 | 0.679 | 0.941 | 0.996 | 0.891 | 0.783 |
Download Data |
Period Mean (original grids) [K] |
Model Period Mean (intersection) [K] |
Model Period Mean (complement) [K] |
Benchmark Period Mean (intersection) [K] |
Benchmark Period Mean (complement) [K] |
Bias [K] |
RMSE [K] |
Phase Shift [months] |
Bias Score [1] |
RMSE Score [1] |
Seasonal Cycle Score [1] |
Spatial Distribution Score [1] |
Interannual Variability Score [1] |
Overall Score [1] |
|||
|---|---|---|---|---|---|---|---|---|---|---|---|---|---|---|---|---|---|
| Benchmark | [-] | 300. | |||||||||||||||
| Calib | [-] | 301. | 301. | 300. | 300. | 300. | 0.351 | 1.63 | 0.422 | 0.648 | 0.702 | 0.964 | 0.954 | 0.897 | 0.811 | ||
| Control | [-] | 301. | 301. | 300. | 300. | 300. | 0.408 | 1.65 | 0.446 | 0.640 | 0.701 | 0.962 | 0.951 | 0.898 | 0.809 |
Download Data |
Period Mean (original grids) [K] |
Model Period Mean (intersection) [K] |
Model Period Mean (complement) [K] |
Benchmark Period Mean (intersection) [K] |
Benchmark Period Mean (complement) [K] |
Bias [K] |
RMSE [K] |
Phase Shift [months] |
Bias Score [1] |
RMSE Score [1] |
Seasonal Cycle Score [1] |
Spatial Distribution Score [1] |
Interannual Variability Score [1] |
Overall Score [1] |
|||
|---|---|---|---|---|---|---|---|---|---|---|---|---|---|---|---|---|---|
| Benchmark | [-] | 295. | |||||||||||||||
| Calib | [-] | 296. | 296. | 297. | 295. | 299. | 0.511 | 1.53 | 0.559 | 0.602 | 0.769 | 0.927 | 0.996 | 0.882 | 0.824 | ||
| Control | [-] | 296. | 296. | 297. | 295. | 299. | 0.565 | 1.55 | 0.559 | 0.597 | 0.769 | 0.927 | 0.997 | 0.884 | 0.824 |
Download Data |
Period Mean (original grids) [K] |
Model Period Mean (intersection) [K] |
Model Period Mean (complement) [K] |
Benchmark Period Mean (intersection) [K] |
Benchmark Period Mean (complement) [K] |
Bias [K] |
RMSE [K] |
Phase Shift [months] |
Bias Score [1] |
RMSE Score [1] |
Seasonal Cycle Score [1] |
Spatial Distribution Score [1] |
Interannual Variability Score [1] |
Overall Score [1] |
|||
|---|---|---|---|---|---|---|---|---|---|---|---|---|---|---|---|---|---|
| Benchmark | [-] | 262. | |||||||||||||||
| Calib | [-] | 263. | 262. | 268. | 262. | 268. | 0.564 | 2.73 | 0.0601 | 0.878 | 0.906 | 0.996 | 0.985 | 0.888 | 0.927 | ||
| Control | [-] | 262. | 262. | 268. | 262. | 268. | 0.550 | 2.73 | 0.0601 | 0.878 | 0.906 | 0.996 | 0.985 | 0.888 | 0.926 |
Download Data |
Period Mean (original grids) [K] |
Model Period Mean (intersection) [K] |
Model Period Mean (complement) [K] |
Benchmark Period Mean (intersection) [K] |
Benchmark Period Mean (complement) [K] |
Bias [K] |
RMSE [K] |
Phase Shift [months] |
Bias Score [1] |
RMSE Score [1] |
Seasonal Cycle Score [1] |
Spatial Distribution Score [1] |
Interannual Variability Score [1] |
Overall Score [1] |
|||
|---|---|---|---|---|---|---|---|---|---|---|---|---|---|---|---|---|---|
| Benchmark | [-] | 299. | |||||||||||||||
| Calib | [-] | 300. | 299. | 300. | 299. | 299. | 0.206 | 1.28 | 0.778 | 0.337 | 0.594 | 0.881 | 1.00 | 0.823 | 0.705 | ||
| Control | [-] | 300. | 300. | 300. | 299. | 299. | 0.288 | 1.29 | 0.778 | 0.334 | 0.597 | 0.881 | 1.00 | 0.822 | 0.705 |
Download Data |
Period Mean (original grids) [K] |
Model Period Mean (intersection) [K] |
Model Period Mean (complement) [K] |
Benchmark Period Mean (intersection) [K] |
Benchmark Period Mean (complement) [K] |
Bias [K] |
RMSE [K] |
Phase Shift [months] |
Bias Score [1] |
RMSE Score [1] |
Seasonal Cycle Score [1] |
Spatial Distribution Score [1] |
Interannual Variability Score [1] |
Overall Score [1] |
|||
|---|---|---|---|---|---|---|---|---|---|---|---|---|---|---|---|---|---|
| Benchmark | [-] | 271. | |||||||||||||||
| Calib | [-] | 271. | 272. | 274. | 271. | 275. | 0.0407 | 1.37 | 0.0680 | 0.931 | 0.949 | 0.995 | 1.00 | 0.957 | 0.963 | ||
| Control | [-] | 271. | 271. | 274. | 271. | 275. | 0.0101 | 1.38 | 0.0764 | 0.930 | 0.948 | 0.994 | 1.00 | 0.957 | 0.963 |
Download Data |
Period Mean (original grids) [K] |
Model Period Mean (intersection) [K] |
Model Period Mean (complement) [K] |
Benchmark Period Mean (intersection) [K] |
Benchmark Period Mean (complement) [K] |
Bias [K] |
RMSE [K] |
Phase Shift [months] |
Bias Score [1] |
RMSE Score [1] |
Seasonal Cycle Score [1] |
Spatial Distribution Score [1] |
Interannual Variability Score [1] |
Overall Score [1] |
|||
|---|---|---|---|---|---|---|---|---|---|---|---|---|---|---|---|---|---|
| Benchmark | [-] | 281. | |||||||||||||||
| Calib | [-] | 281. | 281. | 289. | 281. | 285. | 0.335 | 2.40 | 0.0900 | 0.821 | 0.916 | 0.994 | 1.00 | 0.919 | 0.928 | ||
| Control | [-] | 281. | 281. | 289. | 281. | 285. | 0.338 | 2.41 | 0.0872 | 0.821 | 0.916 | 0.994 | 1.00 | 0.919 | 0.928 |
Download Data |
Period Mean (original grids) [K] |
Model Period Mean (intersection) [K] |
Model Period Mean (complement) [K] |
Benchmark Period Mean (intersection) [K] |
Benchmark Period Mean (complement) [K] |
Bias [K] |
RMSE [K] |
Phase Shift [months] |
Bias Score [1] |
RMSE Score [1] |
Seasonal Cycle Score [1] |
Spatial Distribution Score [1] |
Interannual Variability Score [1] |
Overall Score [1] |
|||
|---|---|---|---|---|---|---|---|---|---|---|---|---|---|---|---|---|---|
| Benchmark | [-] | 297. | |||||||||||||||
| Calib | [-] | 298. | 297. | 300. | 297. | 300. | 0.103 | 2.29 | 0.363 | 0.651 | 0.768 | 0.963 | 0.999 | 0.882 | 0.839 | ||
| Control | [-] | 298. | 298. | 300. | 297. | 300. | 0.206 | 2.32 | 0.363 | 0.643 | 0.769 | 0.963 | 0.998 | 0.883 | 0.838 |
Download Data |
Period Mean (original grids) [K] |
Model Period Mean (intersection) [K] |
Model Period Mean (complement) [K] |
Benchmark Period Mean (intersection) [K] |
Benchmark Period Mean (complement) [K] |
Bias [K] |
RMSE [K] |
Phase Shift [months] |
Bias Score [1] |
RMSE Score [1] |
Seasonal Cycle Score [1] |
Spatial Distribution Score [1] |
Interannual Variability Score [1] |
Overall Score [1] |
|||
|---|---|---|---|---|---|---|---|---|---|---|---|---|---|---|---|---|---|
| Benchmark | [-] | 264. | |||||||||||||||
| Calib | [-] | 264. | 264. | 268. | 264. | 267. | 0.528 | 1.95 | 0.154 | 0.920 | 0.923 | 0.988 | 1.00 | 0.920 | 0.946 | ||
| Control | [-] | 264. | 264. | 268. | 264. | 267. | 0.517 | 1.95 | 0.155 | 0.920 | 0.923 | 0.988 | 1.00 | 0.921 | 0.946 |
Download Data |
Period Mean (original grids) [K] |
Model Period Mean (intersection) [K] |
Model Period Mean (complement) [K] |
Benchmark Period Mean (intersection) [K] |
Benchmark Period Mean (complement) [K] |
Bias [K] |
RMSE [K] |
Phase Shift [months] |
Bias Score [1] |
RMSE Score [1] |
Seasonal Cycle Score [1] |
Spatial Distribution Score [1] |
Interannual Variability Score [1] |
Overall Score [1] |
|||
|---|---|---|---|---|---|---|---|---|---|---|---|---|---|---|---|---|---|
| Benchmark | [-] | 295. | |||||||||||||||
| Calib | [-] | 295. | 295. | 292. | 295. | 294. | 0.636 | 1.36 | 0.197 | 0.809 | 0.851 | 0.986 | 0.994 | 0.896 | 0.898 | ||
| Control | [-] | 295. | 295. | 292. | 295. | 294. | 0.653 | 1.37 | 0.197 | 0.807 | 0.850 | 0.986 | 0.994 | 0.896 | 0.897 |
Download Data |
Period Mean (original grids) [K] |
Model Period Mean (intersection) [K] |
Model Period Mean (complement) [K] |
Benchmark Period Mean (intersection) [K] |
Benchmark Period Mean (complement) [K] |
Bias [K] |
RMSE [K] |
Phase Shift [months] |
Bias Score [1] |
RMSE Score [1] |
Seasonal Cycle Score [1] |
Spatial Distribution Score [1] |
Interannual Variability Score [1] |
Overall Score [1] |
|||
|---|---|---|---|---|---|---|---|---|---|---|---|---|---|---|---|---|---|
| Benchmark | [-] | 283. | |||||||||||||||
| Calib | [-] | 282. | 283. | 285. | 282. | 289. | 0.303 | 1.76 | 0.101 | 0.822 | 0.884 | 0.993 | 0.999 | 0.913 | 0.916 | ||
| Control | [-] | 282. | 283. | 285. | 282. | 289. | 0.307 | 1.76 | 0.101 | 0.822 | 0.883 | 0.993 | 0.998 | 0.912 | 0.915 |
Download Data |
Period Mean (original grids) [K] |
Model Period Mean (intersection) [K] |
Model Period Mean (complement) [K] |
Benchmark Period Mean (intersection) [K] |
Benchmark Period Mean (complement) [K] |
Bias [K] |
RMSE [K] |
Phase Shift [months] |
Bias Score [1] |
RMSE Score [1] |
Seasonal Cycle Score [1] |
Spatial Distribution Score [1] |
Interannual Variability Score [1] |
Overall Score [1] |
|||
|---|---|---|---|---|---|---|---|---|---|---|---|---|---|---|---|---|---|
| Benchmark | [-] | 287. | |||||||||||||||
| Calib | [-] | 284. | 287. | 277. | 287. | 292. | 0.342 | 1.89 | 0.288 | 0.740 | 0.831 | 0.969 | 1.00 | 0.905 | 0.879 | ||
| Control | [-] | 284. | 287. | 278. | 287. | 292. | 0.367 | 1.90 | 0.288 | 0.737 | 0.832 | 0.969 | 1.00 | 0.905 | 0.879 |
Download Data |
Period Mean (original grids) [K] |
Model Period Mean (intersection) [K] |
Model Period Mean (complement) [K] |
Benchmark Period Mean (intersection) [K] |
Benchmark Period Mean (complement) [K] |
Bias [K] |
RMSE [K] |
Phase Shift [months] |
Bias Score [1] |
RMSE Score [1] |
Seasonal Cycle Score [1] |
Spatial Distribution Score [1] |
Interannual Variability Score [1] |
Overall Score [1] |
|||
|---|---|---|---|---|---|---|---|---|---|---|---|---|---|---|---|---|---|
| Benchmark | [-] | 296. | |||||||||||||||
| Calib | [-] | 296. | 297. | 296. | 296. | 292. | 0.225 | 1.73 | 0.267 | 0.823 | 0.883 | 0.979 | 0.992 | 0.919 | 0.913 | ||
| Control | [-] | 296. | 297. | 296. | 296. | 292. | 0.219 | 1.73 | 0.267 | 0.823 | 0.883 | 0.979 | 0.992 | 0.919 | 0.913 |
Download Data |
Period Mean (original grids) [K] |
Model Period Mean (intersection) [K] |
Model Period Mean (complement) [K] |
Benchmark Period Mean (intersection) [K] |
Benchmark Period Mean (complement) [K] |
Bias [K] |
RMSE [K] |
Phase Shift [months] |
Bias Score [1] |
RMSE Score [1] |
Seasonal Cycle Score [1] |
Spatial Distribution Score [1] |
Interannual Variability Score [1] |
Overall Score [1] |
|||
|---|---|---|---|---|---|---|---|---|---|---|---|---|---|---|---|---|---|
| Benchmark | [-] | 265. | |||||||||||||||
| Calib | [-] | 266. | 266. | 268. | 265. | 265. | 1.03 | 2.44 | 0.0727 | 0.876 | 0.889 | 0.995 | 0.998 | 0.910 | 0.926 | ||
| Control | [-] | 266. | 266. | 268. | 265. | 265. | 1.03 | 2.45 | 0.0727 | 0.876 | 0.889 | 0.995 | 0.998 | 0.910 | 0.926 |
Download Data |
Period Mean (original grids) [K] |
Model Period Mean (intersection) [K] |
Model Period Mean (complement) [K] |
Benchmark Period Mean (intersection) [K] |
Benchmark Period Mean (complement) [K] |
Bias [K] |
RMSE [K] |
Phase Shift [months] |
Bias Score [1] |
RMSE Score [1] |
Seasonal Cycle Score [1] |
Spatial Distribution Score [1] |
Interannual Variability Score [1] |
Overall Score [1] |
|||
|---|---|---|---|---|---|---|---|---|---|---|---|---|---|---|---|---|---|
| Benchmark | [-] | 296. | |||||||||||||||
| Calib | [-] | 297. | 297. | 299. | 296. | 299. | 1.22 | 2.58 | 0.620 | 0.504 | 0.723 | 0.929 | 0.930 | 0.871 | 0.780 | ||
| Control | [-] | 298. | 297. | 299. | 296. | 299. | 1.29 | 2.61 | 0.620 | 0.501 | 0.722 | 0.929 | 0.934 | 0.872 | 0.780 |
Download Data |
Period Mean (original grids) [K] |
Model Period Mean (intersection) [K] |
Model Period Mean (complement) [K] |
Benchmark Period Mean (intersection) [K] |
Benchmark Period Mean (complement) [K] |
Bias [K] |
RMSE [K] |
Phase Shift [months] |
Bias Score [1] |
RMSE Score [1] |
Seasonal Cycle Score [1] |
Spatial Distribution Score [1] |
Interannual Variability Score [1] |
Overall Score [1] |
|||
|---|---|---|---|---|---|---|---|---|---|---|---|---|---|---|---|---|---|
| Benchmark | [-] | 286. | |||||||||||||||
| Calib | [-] | 287. | 287. | 294. | 286. | 0.236 | 1.39 | 0.131 | 0.875 | 0.920 | 0.991 | 0.995 | 0.934 | 0.939 | |||
| Control | [-] | 287. | 287. | 294. | 286. | 0.262 | 1.39 | 0.131 | 0.875 | 0.920 | 0.991 | 0.995 | 0.934 | 0.939 |
Download Data |
Period Mean (original grids) [K] |
Model Period Mean (intersection) [K] |
Model Period Mean (complement) [K] |
Benchmark Period Mean (intersection) [K] |
Benchmark Period Mean (complement) [K] |
Bias [K] |
RMSE [K] |
Phase Shift [months] |
Bias Score [1] |
RMSE Score [1] |
Seasonal Cycle Score [1] |
Spatial Distribution Score [1] |
Interannual Variability Score [1] |
Overall Score [1] |
|||
|---|---|---|---|---|---|---|---|---|---|---|---|---|---|---|---|---|---|
| Benchmark | [-] | 275. | |||||||||||||||
| Calib | [-] | 275. | 275. | 279. | 274. | 281. | 0.298 | 1.69 | 0.0977 | 0.879 | 0.911 | 0.993 | 0.984 | 0.941 | 0.937 | ||
| Control | [-] | 275. | 275. | 279. | 274. | 281. | 0.269 | 1.70 | 0.0977 | 0.879 | 0.911 | 0.993 | 0.984 | 0.941 | 0.937 |
Download Data |
Period Mean (original grids) [K] |
Model Period Mean (intersection) [K] |
Model Period Mean (complement) [K] |
Benchmark Period Mean (intersection) [K] |
Benchmark Period Mean (complement) [K] |
Bias [K] |
RMSE [K] |
Phase Shift [months] |
Bias Score [1] |
RMSE Score [1] |
Seasonal Cycle Score [1] |
Spatial Distribution Score [1] |
Interannual Variability Score [1] |
Overall Score [1] |
|||
|---|---|---|---|---|---|---|---|---|---|---|---|---|---|---|---|---|---|
| Benchmark | [-] | 284. | |||||||||||||||
| Calib | [-] | 285. | 284. | 287. | 284. | 0.441 | 2.32 | 0.0831 | 0.787 | 0.891 | 0.994 | 1.00 | 0.925 | 0.915 | |||
| Control | [-] | 285. | 284. | 287. | 284. | 0.450 | 2.33 | 0.0831 | 0.787 | 0.891 | 0.994 | 1.00 | 0.926 | 0.915 |
Download Data |
Period Mean (original grids) [K] |
Model Period Mean (intersection) [K] |
Model Period Mean (complement) [K] |
Benchmark Period Mean (intersection) [K] |
Benchmark Period Mean (complement) [K] |
Bias [K] |
RMSE [K] |
Phase Shift [months] |
Bias Score [1] |
RMSE Score [1] |
Seasonal Cycle Score [1] |
Spatial Distribution Score [1] |
Interannual Variability Score [1] |
Overall Score [1] |
|||
|---|---|---|---|---|---|---|---|---|---|---|---|---|---|---|---|---|---|
| Benchmark | [-] | 299. | |||||||||||||||
| Calib | [-] | 300. | 299. | 300. | 299. | 300. | 0.0973 | 1.30 | 0.713 | 0.520 | 0.656 | 0.906 | 0.999 | 0.885 | 0.770 | ||
| Control | [-] | 300. | 299. | 300. | 299. | 300. | 0.190 | 1.31 | 0.691 | 0.505 | 0.662 | 0.908 | 1.00 | 0.886 | 0.771 |
Download Data |
Period Mean (original grids) [K] |
Model Period Mean (intersection) [K] |
Model Period Mean (complement) [K] |
Benchmark Period Mean (intersection) [K] |
Benchmark Period Mean (complement) [K] |
Bias [K] |
RMSE [K] |
Phase Shift [months] |
Bias Score [1] |
RMSE Score [1] |
Seasonal Cycle Score [1] |
Spatial Distribution Score [1] |
Interannual Variability Score [1] |
Overall Score [1] |
|||
|---|---|---|---|---|---|---|---|---|---|---|---|---|---|---|---|---|---|
| Benchmark | [-] | 296. | |||||||||||||||
| Calib | [-] | 296. | 296. | 296. | 296. | 289. | 0.236 | 1.31 | 0.484 | 0.668 | 0.770 | 0.936 | 0.997 | 0.896 | 0.840 | ||
| Control | [-] | 296. | 296. | 296. | 296. | 289. | 0.300 | 1.33 | 0.484 | 0.660 | 0.772 | 0.936 | 0.997 | 0.899 | 0.839 |
Download Data |
Period Mean (original grids) [K] |
Model Period Mean (intersection) [K] |
Model Period Mean (complement) [K] |
Benchmark Period Mean (intersection) [K] |
Benchmark Period Mean (complement) [K] |
Bias [K] |
RMSE [K] |
Phase Shift [months] |
Bias Score [1] |
RMSE Score [1] |
Seasonal Cycle Score [1] |
Spatial Distribution Score [1] |
Interannual Variability Score [1] |
Overall Score [1] |
|||
|---|---|---|---|---|---|---|---|---|---|---|---|---|---|---|---|---|---|
| Benchmark | [-] | 284. | |||||||||||||||
| Calib | [-] | 286. | 285. | 288. | 284. | 280. | 1.41 | 4.16 | 0.447 | 0.460 | 0.758 | 0.953 | 0.985 | 0.848 | 0.794 | ||
| Control | [-] | 286. | 285. | 288. | 284. | 280. | 1.43 | 4.17 | 0.451 | 0.459 | 0.758 | 0.953 | 0.985 | 0.848 | 0.793 |
Temporally integrated period mean