Mean State
Download Data |
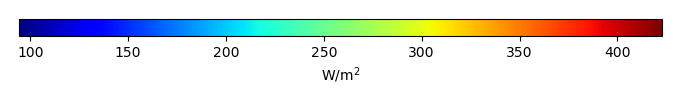
Period Mean (original grids) [W/m2] |
Model Period Mean (intersection) [W/m2] |
Model Period Mean (complement) [W/m2] |
Benchmark Period Mean (intersection) [W/m2] |
Benchmark Period Mean (complement) [W/m2] |
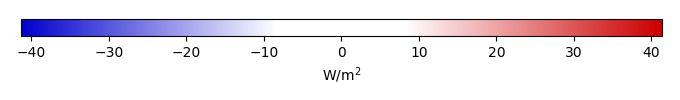
Bias [W/m2] |
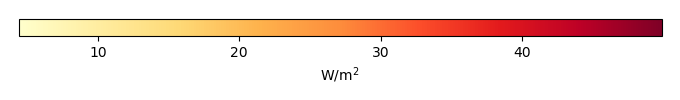
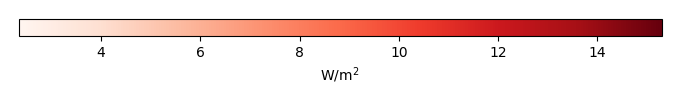
RMSE [W/m2] |
Phase Shift [months] |
Bias Score [1] |
RMSE Score [1] |
Seasonal Cycle Score [1] |
Spatial Distribution Score [1] |
Interannual Variability Score [1] |
Overall Score [1] |
|||
|---|---|---|---|---|---|---|---|---|---|---|---|---|---|---|---|---|---|
| Benchmark | [-] | 400. | |||||||||||||||
| Calib | [-] | 398. | 397. | 400. | 418. | -3.66 | 12.0 | 1.72 | 0.398 | 0.365 | 0.730 | 0.987 | 0.599 | 0.574 | |||
| Control | [-] | 398. | 397. | 400. | 418. | -3.66 | 12.0 | 1.72 | 0.398 | 0.365 | 0.730 | 0.987 | 0.599 | 0.574 |
Download Data |
Period Mean (original grids) [W/m2] |
Model Period Mean (intersection) [W/m2] |
Model Period Mean (complement) [W/m2] |
Benchmark Period Mean (intersection) [W/m2] |
Benchmark Period Mean (complement) [W/m2] |
Bias [W/m2] |
RMSE [W/m2] |
Phase Shift [months] |
Bias Score [1] |
RMSE Score [1] |
Seasonal Cycle Score [1] |
Spatial Distribution Score [1] |
Interannual Variability Score [1] |
Overall Score [1] |
|||
|---|---|---|---|---|---|---|---|---|---|---|---|---|---|---|---|---|---|
| Benchmark | [-] | 391. | |||||||||||||||
| Calib | [-] | 383. | 385. | 391. | 387. | -6.78 | 15.6 | 0.645 | 0.631 | 0.633 | 0.931 | 0.839 | 0.576 | 0.707 | |||
| Control | [-] | 383. | 385. | 391. | 387. | -6.78 | 15.6 | 0.645 | 0.631 | 0.633 | 0.931 | 0.839 | 0.576 | 0.707 |
Download Data |
Period Mean (original grids) [W/m2] |
Model Period Mean (intersection) [W/m2] |
Model Period Mean (complement) [W/m2] |
Benchmark Period Mean (intersection) [W/m2] |
Benchmark Period Mean (complement) [W/m2] |
Bias [W/m2] |
RMSE [W/m2] |
Phase Shift [months] |
Bias Score [1] |
RMSE Score [1] |
Seasonal Cycle Score [1] |
Spatial Distribution Score [1] |
Interannual Variability Score [1] |
Overall Score [1] |
|||
|---|---|---|---|---|---|---|---|---|---|---|---|---|---|---|---|---|---|
| Benchmark | [-] | 367. | |||||||||||||||
| Calib | [-] | 363. | 363. | 366. | 394. | -3.59 | 15.6 | 1.07 | 0.623 | 0.595 | 0.857 | 0.988 | 0.653 | 0.719 | |||
| Control | [-] | 363. | 363. | 366. | 394. | -3.59 | 15.6 | 1.07 | 0.623 | 0.595 | 0.857 | 0.988 | 0.653 | 0.719 |
Download Data |
Period Mean (original grids) [W/m2] |
Model Period Mean (intersection) [W/m2] |
Model Period Mean (complement) [W/m2] |
Benchmark Period Mean (intersection) [W/m2] |
Benchmark Period Mean (complement) [W/m2] |
Bias [W/m2] |
RMSE [W/m2] |
Phase Shift [months] |
Bias Score [1] |
RMSE Score [1] |
Seasonal Cycle Score [1] |
Spatial Distribution Score [1] |
Interannual Variability Score [1] |
Overall Score [1] |
|||
|---|---|---|---|---|---|---|---|---|---|---|---|---|---|---|---|---|---|
| Benchmark | [-] | 242. | |||||||||||||||
| Calib | [-] | 239. | 241. | 242. | 254. | -1.01 | 14.1 | 0.120 | 0.914 | 0.799 | 0.992 | 0.996 | 0.905 | 0.901 | |||
| Control | [-] | 239. | 241. | 242. | 254. | -1.01 | 14.1 | 0.120 | 0.914 | 0.799 | 0.992 | 0.996 | 0.905 | 0.901 |
Download Data |
Period Mean (original grids) [W/m2] |
Model Period Mean (intersection) [W/m2] |
Model Period Mean (complement) [W/m2] |
Benchmark Period Mean (intersection) [W/m2] |
Benchmark Period Mean (complement) [W/m2] |
Bias [W/m2] |
RMSE [W/m2] |
Phase Shift [months] |
Bias Score [1] |
RMSE Score [1] |
Seasonal Cycle Score [1] |
Spatial Distribution Score [1] |
Interannual Variability Score [1] |
Overall Score [1] |
|||
|---|---|---|---|---|---|---|---|---|---|---|---|---|---|---|---|---|---|
| Benchmark | [-] | 411. | |||||||||||||||
| Calib | [-] | 413. | 413. | 411. | 413. | 1.97 | 11.4 | 1.66 | 0.394 | 0.423 | 0.747 | 0.732 | 0.744 | 0.577 | |||
| Control | [-] | 413. | 413. | 411. | 413. | 1.97 | 11.4 | 1.66 | 0.394 | 0.423 | 0.747 | 0.732 | 0.744 | 0.577 |
Download Data |
Period Mean (original grids) [W/m2] |
Model Period Mean (intersection) [W/m2] |
Model Period Mean (complement) [W/m2] |
Benchmark Period Mean (intersection) [W/m2] |
Benchmark Period Mean (complement) [W/m2] |
Bias [W/m2] |
RMSE [W/m2] |
Phase Shift [months] |
Bias Score [1] |
RMSE Score [1] |
Seasonal Cycle Score [1] |
Spatial Distribution Score [1] |
Interannual Variability Score [1] |
Overall Score [1] |
|||
|---|---|---|---|---|---|---|---|---|---|---|---|---|---|---|---|---|---|
| Benchmark | [-] | 269. | |||||||||||||||
| Calib | [-] | 264. | 265. | 269. | 285. | -3.54 | 11.4 | 0.176 | 0.896 | 0.844 | 0.988 | 0.984 | 0.871 | 0.905 | |||
| Control | [-] | 264. | 265. | 269. | 285. | -3.54 | 11.4 | 0.176 | 0.896 | 0.844 | 0.988 | 0.984 | 0.871 | 0.905 |
Download Data |
Period Mean (original grids) [W/m2] |
Model Period Mean (intersection) [W/m2] |
Model Period Mean (complement) [W/m2] |
Benchmark Period Mean (intersection) [W/m2] |
Benchmark Period Mean (complement) [W/m2] |
Bias [W/m2] |
RMSE [W/m2] |
Phase Shift [months] |
Bias Score [1] |
RMSE Score [1] |
Seasonal Cycle Score [1] |
Spatial Distribution Score [1] |
Interannual Variability Score [1] |
Overall Score [1] |
|||
|---|---|---|---|---|---|---|---|---|---|---|---|---|---|---|---|---|---|
| Benchmark | [-] | 300. | |||||||||||||||
| Calib | [-] | 295. | 295. | 298. | 340. | -3.05 | 16.1 | 0.205 | 0.800 | 0.796 | 0.986 | 0.989 | 0.744 | 0.852 | |||
| Control | [-] | 295. | 295. | 298. | 340. | -3.05 | 16.1 | 0.205 | 0.800 | 0.796 | 0.986 | 0.989 | 0.744 | 0.852 |
Download Data |
Period Mean (original grids) [W/m2] |
Model Period Mean (intersection) [W/m2] |
Model Period Mean (complement) [W/m2] |
Benchmark Period Mean (intersection) [W/m2] |
Benchmark Period Mean (complement) [W/m2] |
Bias [W/m2] |
RMSE [W/m2] |
Phase Shift [months] |
Bias Score [1] |
RMSE Score [1] |
Seasonal Cycle Score [1] |
Spatial Distribution Score [1] |
Interannual Variability Score [1] |
Overall Score [1] |
|||
|---|---|---|---|---|---|---|---|---|---|---|---|---|---|---|---|---|---|
| Benchmark | [-] | 389. | |||||||||||||||
| Calib | [-] | 383. | 380. | 388. | 415. | -8.67 | 18.7 | 0.495 | 0.633 | 0.704 | 0.953 | 0.998 | 0.779 | 0.795 | |||
| Control | [-] | 383. | 380. | 388. | 415. | -8.67 | 18.7 | 0.495 | 0.633 | 0.704 | 0.953 | 0.998 | 0.779 | 0.795 |
Download Data |
Period Mean (original grids) [W/m2] |
Model Period Mean (intersection) [W/m2] |
Model Period Mean (complement) [W/m2] |
Benchmark Period Mean (intersection) [W/m2] |
Benchmark Period Mean (complement) [W/m2] |
Bias [W/m2] |
RMSE [W/m2] |
Phase Shift [months] |
Bias Score [1] |
RMSE Score [1] |
Seasonal Cycle Score [1] |
Spatial Distribution Score [1] |
Interannual Variability Score [1] |
Overall Score [1] |
|||
|---|---|---|---|---|---|---|---|---|---|---|---|---|---|---|---|---|---|
| Benchmark | [-] | 246. | |||||||||||||||
| Calib | [-] | 244. | 245. | 246. | 263. | -1.34 | 13.8 | 0.197 | 0.929 | 0.790 | 0.985 | 0.971 | 0.896 | 0.894 | |||
| Control | [-] | 244. | 245. | 246. | 263. | -1.34 | 13.8 | 0.197 | 0.929 | 0.790 | 0.985 | 0.971 | 0.896 | 0.894 |
Download Data |
Period Mean (original grids) [W/m2] |
Model Period Mean (intersection) [W/m2] |
Model Period Mean (complement) [W/m2] |
Benchmark Period Mean (intersection) [W/m2] |
Benchmark Period Mean (complement) [W/m2] |
Bias [W/m2] |
RMSE [W/m2] |
Phase Shift [months] |
Bias Score [1] |
RMSE Score [1] |
Seasonal Cycle Score [1] |
Spatial Distribution Score [1] |
Interannual Variability Score [1] |
Overall Score [1] |
|||
|---|---|---|---|---|---|---|---|---|---|---|---|---|---|---|---|---|---|
| Benchmark | [-] | 353. | |||||||||||||||
| Calib | [-] | 351. | 352. | 353. | 369. | -1.22 | 11.8 | 0.296 | 0.814 | 0.731 | 0.970 | 0.991 | 0.794 | 0.838 | |||
| Control | [-] | 351. | 352. | 353. | 369. | -1.22 | 11.8 | 0.296 | 0.814 | 0.731 | 0.970 | 0.991 | 0.794 | 0.838 |
Download Data |
Period Mean (original grids) [W/m2] |
Model Period Mean (intersection) [W/m2] |
Model Period Mean (complement) [W/m2] |
Benchmark Period Mean (intersection) [W/m2] |
Benchmark Period Mean (complement) [W/m2] |
Bias [W/m2] |
RMSE [W/m2] |
Phase Shift [months] |
Bias Score [1] |
RMSE Score [1] |
Seasonal Cycle Score [1] |
Spatial Distribution Score [1] |
Interannual Variability Score [1] |
Overall Score [1] |
|||
|---|---|---|---|---|---|---|---|---|---|---|---|---|---|---|---|---|---|
| Benchmark | [-] | 316. | |||||||||||||||
| Calib | [-] | 307. | 309. | 314. | 338. | -5.06 | 13.1 | 0.230 | 0.763 | 0.736 | 0.981 | 1.00 | 0.722 | 0.823 | |||
| Control | [-] | 307. | 309. | 314. | 338. | -5.06 | 13.1 | 0.230 | 0.763 | 0.736 | 0.981 | 1.00 | 0.722 | 0.823 |
Download Data |
Period Mean (original grids) [W/m2] |
Model Period Mean (intersection) [W/m2] |
Model Period Mean (complement) [W/m2] |
Benchmark Period Mean (intersection) [W/m2] |
Benchmark Period Mean (complement) [W/m2] |
Bias [W/m2] |
RMSE [W/m2] |
Phase Shift [months] |
Bias Score [1] |
RMSE Score [1] |
Seasonal Cycle Score [1] |
Spatial Distribution Score [1] |
Interannual Variability Score [1] |
Overall Score [1] |
|||
|---|---|---|---|---|---|---|---|---|---|---|---|---|---|---|---|---|---|
| Benchmark | [-] | 345. | |||||||||||||||
| Calib | [-] | 319. | 319. | 323. | 360. | -3.33 | 14.8 | 0.601 | 0.701 | 0.665 | 0.929 | 0.999 | 0.770 | 0.788 | |||
| Control | [-] | 319. | 319. | 323. | 360. | -3.33 | 14.8 | 0.601 | 0.701 | 0.665 | 0.929 | 0.999 | 0.770 | 0.788 |
Download Data |
Period Mean (original grids) [W/m2] |
Model Period Mean (intersection) [W/m2] |
Model Period Mean (complement) [W/m2] |
Benchmark Period Mean (intersection) [W/m2] |
Benchmark Period Mean (complement) [W/m2] |
Bias [W/m2] |
RMSE [W/m2] |
Phase Shift [months] |
Bias Score [1] |
RMSE Score [1] |
Seasonal Cycle Score [1] |
Spatial Distribution Score [1] |
Interannual Variability Score [1] |
Overall Score [1] |
|||
|---|---|---|---|---|---|---|---|---|---|---|---|---|---|---|---|---|---|
| Benchmark | [-] | 349. | |||||||||||||||
| Calib | [-] | 343. | 343. | 349. | 349. | -5.80 | 17.1 | 0.418 | 0.740 | 0.726 | 0.963 | 0.985 | 0.753 | 0.815 | |||
| Control | [-] | 343. | 343. | 349. | 349. | -5.80 | 17.1 | 0.418 | 0.740 | 0.726 | 0.963 | 0.985 | 0.753 | 0.815 |
Download Data |
Period Mean (original grids) [W/m2] |
Model Period Mean (intersection) [W/m2] |
Model Period Mean (complement) [W/m2] |
Benchmark Period Mean (intersection) [W/m2] |
Benchmark Period Mean (complement) [W/m2] |
Bias [W/m2] |
RMSE [W/m2] |
Phase Shift [months] |
Bias Score [1] |
RMSE Score [1] |
Seasonal Cycle Score [1] |
Spatial Distribution Score [1] |
Interannual Variability Score [1] |
Overall Score [1] |
|||
|---|---|---|---|---|---|---|---|---|---|---|---|---|---|---|---|---|---|
| Benchmark | [-] | 247. | |||||||||||||||
| Calib | [-] | 243. | 245. | 247. | 257. | -2.29 | 14.0 | 0.133 | 0.903 | 0.783 | 0.991 | 0.996 | 0.867 | 0.887 | |||
| Control | [-] | 243. | 245. | 247. | 257. | -2.29 | 14.0 | 0.133 | 0.903 | 0.783 | 0.991 | 0.996 | 0.867 | 0.887 |
Download Data |
Period Mean (original grids) [W/m2] |
Model Period Mean (intersection) [W/m2] |
Model Period Mean (complement) [W/m2] |
Benchmark Period Mean (intersection) [W/m2] |
Benchmark Period Mean (complement) [W/m2] |
Bias [W/m2] |
RMSE [W/m2] |
Phase Shift [months] |
Bias Score [1] |
RMSE Score [1] |
Seasonal Cycle Score [1] |
Spatial Distribution Score [1] |
Interannual Variability Score [1] |
Overall Score [1] |
|||
|---|---|---|---|---|---|---|---|---|---|---|---|---|---|---|---|---|---|
| Benchmark | [-] | 377. | |||||||||||||||
| Calib | [-] | 375. | 375. | 375. | 401. | 0.142 | 17.9 | 1.08 | 0.559 | 0.660 | 0.847 | 0.986 | 0.794 | 0.751 | |||
| Control | [-] | 375. | 375. | 375. | 401. | 0.142 | 17.9 | 1.08 | 0.559 | 0.660 | 0.847 | 0.986 | 0.794 | 0.751 |
Download Data |
Period Mean (original grids) [W/m2] |
Model Period Mean (intersection) [W/m2] |
Model Period Mean (complement) [W/m2] |
Benchmark Period Mean (intersection) [W/m2] |
Benchmark Period Mean (complement) [W/m2] |
Bias [W/m2] |
RMSE [W/m2] |
Phase Shift [months] |
Bias Score [1] |
RMSE Score [1] |
Seasonal Cycle Score [1] |
Spatial Distribution Score [1] |
Interannual Variability Score [1] |
Overall Score [1] |
|||
|---|---|---|---|---|---|---|---|---|---|---|---|---|---|---|---|---|---|
| Benchmark | [-] | 335. | |||||||||||||||
| Calib | [-] | 334. | 332. | 335. | -2.57 | 11.7 | 0.319 | 0.860 | 0.814 | 0.976 | 0.998 | 0.847 | 0.885 | ||||
| Control | [-] | 334. | 332. | 335. | -2.57 | 11.7 | 0.319 | 0.860 | 0.814 | 0.976 | 0.998 | 0.847 | 0.885 |
Download Data |
Period Mean (original grids) [W/m2] |
Model Period Mean (intersection) [W/m2] |
Model Period Mean (complement) [W/m2] |
Benchmark Period Mean (intersection) [W/m2] |
Benchmark Period Mean (complement) [W/m2] |
Bias [W/m2] |
RMSE [W/m2] |
Phase Shift [months] |
Bias Score [1] |
RMSE Score [1] |
Seasonal Cycle Score [1] |
Spatial Distribution Score [1] |
Interannual Variability Score [1] |
Overall Score [1] |
|||
|---|---|---|---|---|---|---|---|---|---|---|---|---|---|---|---|---|---|
| Benchmark | [-] | 278. | |||||||||||||||
| Calib | [-] | 276. | 277. | 277. | 311. | -0.595 | 11.3 | 0.249 | 0.862 | 0.812 | 0.983 | 0.997 | 0.839 | 0.884 | |||
| Control | [-] | 276. | 277. | 277. | 311. | -0.595 | 11.3 | 0.249 | 0.862 | 0.812 | 0.983 | 0.997 | 0.839 | 0.884 |
Download Data |
Period Mean (original grids) [W/m2] |
Model Period Mean (intersection) [W/m2] |
Model Period Mean (complement) [W/m2] |
Benchmark Period Mean (intersection) [W/m2] |
Benchmark Period Mean (complement) [W/m2] |
Bias [W/m2] |
RMSE [W/m2] |
Phase Shift [months] |
Bias Score [1] |
RMSE Score [1] |
Seasonal Cycle Score [1] |
Spatial Distribution Score [1] |
Interannual Variability Score [1] |
Overall Score [1] |
|||
|---|---|---|---|---|---|---|---|---|---|---|---|---|---|---|---|---|---|
| Benchmark | [-] | 300. | |||||||||||||||
| Calib | [-] | 298. | 298. | 300. | -1.92 | 15.5 | 0.237 | 0.751 | 0.746 | 0.984 | 0.999 | 0.756 | 0.830 | ||||
| Control | [-] | 298. | 298. | 300. | -1.92 | 15.5 | 0.237 | 0.751 | 0.746 | 0.984 | 0.999 | 0.756 | 0.830 |
Download Data |
Period Mean (original grids) [W/m2] |
Model Period Mean (intersection) [W/m2] |
Model Period Mean (complement) [W/m2] |
Benchmark Period Mean (intersection) [W/m2] |
Benchmark Period Mean (complement) [W/m2] |
Bias [W/m2] |
RMSE [W/m2] |
Phase Shift [months] |
Bias Score [1] |
RMSE Score [1] |
Seasonal Cycle Score [1] |
Spatial Distribution Score [1] |
Interannual Variability Score [1] |
Overall Score [1] |
|||
|---|---|---|---|---|---|---|---|---|---|---|---|---|---|---|---|---|---|
| Benchmark | [-] | 409. | |||||||||||||||
| Calib | [-] | 408. | 406. | 409. | 410. | -3.74 | 12.9 | 1.48 | 0.485 | 0.484 | 0.796 | 0.999 | 0.769 | 0.670 | |||
| Control | [-] | 408. | 406. | 409. | 410. | -3.74 | 12.9 | 1.48 | 0.485 | 0.484 | 0.796 | 0.999 | 0.769 | 0.670 |
Download Data |
Period Mean (original grids) [W/m2] |
Model Period Mean (intersection) [W/m2] |
Model Period Mean (complement) [W/m2] |
Benchmark Period Mean (intersection) [W/m2] |
Benchmark Period Mean (complement) [W/m2] |
Bias [W/m2] |
RMSE [W/m2] |
Phase Shift [months] |
Bias Score [1] |
RMSE Score [1] |
Seasonal Cycle Score [1] |
Spatial Distribution Score [1] |
Interannual Variability Score [1] |
Overall Score [1] |
|||
|---|---|---|---|---|---|---|---|---|---|---|---|---|---|---|---|---|---|
| Benchmark | [-] | 380. | |||||||||||||||
| Calib | [-] | 376. | 376. | 380. | 349. | -4.01 | 13.7 | 0.902 | 0.690 | 0.627 | 0.906 | 0.998 | 0.818 | 0.778 | |||
| Control | [-] | 376. | 376. | 380. | 349. | -4.01 | 13.7 | 0.902 | 0.690 | 0.627 | 0.906 | 0.998 | 0.818 | 0.778 |
Download Data |
Period Mean (original grids) [W/m2] |
Model Period Mean (intersection) [W/m2] |
Model Period Mean (complement) [W/m2] |
Benchmark Period Mean (intersection) [W/m2] |
Benchmark Period Mean (complement) [W/m2] |
Bias [W/m2] |
RMSE [W/m2] |
Phase Shift [months] |
Bias Score [1] |
RMSE Score [1] |
Seasonal Cycle Score [1] |
Spatial Distribution Score [1] |
Interannual Variability Score [1] |
Overall Score [1] |
|||
|---|---|---|---|---|---|---|---|---|---|---|---|---|---|---|---|---|---|
| Benchmark | [-] | 304. | |||||||||||||||
| Calib | [-] | 317. | 314. | 303. | 314. | 10.7 | 32.2 | 0.532 | 0.352 | 0.500 | 0.948 | 0.872 | 0.685 | 0.643 | |||
| Control | [-] | 317. | 314. | 303. | 314. | 10.7 | 32.2 | 0.532 | 0.352 | 0.500 | 0.948 | 0.872 | 0.685 | 0.643 |
Temporally integrated period mean