Mean State
Download Data |
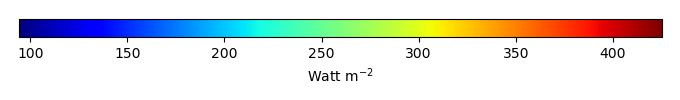
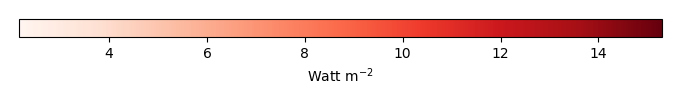
Period Mean (original grids) [Watt m-2] |
Model Period Mean (intersection) [Watt m-2] |
Model Period Mean (complement) [Watt m-2] |
Benchmark Period Mean (intersection) [Watt m-2] |
Benchmark Period Mean (complement) [Watt m-2] |
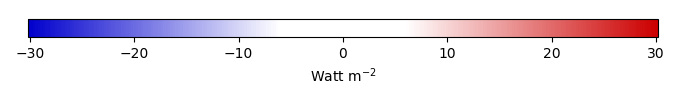
Bias [Watt m-2] |
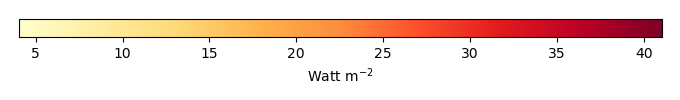
RMSE [Watt m-2] |
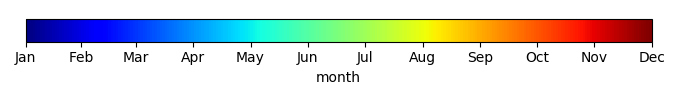
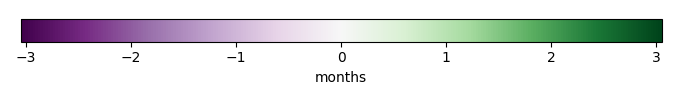
Phase Shift [months] |
Bias Score [1] |
RMSE Score [1] |
Seasonal Cycle Score [1] |
Spatial Distribution Score [1] |
Interannual Variability Score [1] |
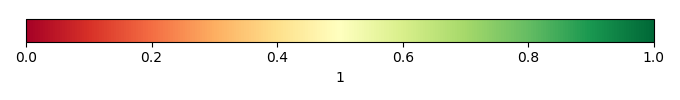
Overall Score [1] |
|||
|---|---|---|---|---|---|---|---|---|---|---|---|---|---|---|---|---|---|
| Benchmark | [-] | 396. | |||||||||||||||
| Calib | [-] | 398. | 397. | 396. | 415. | 0.893 | 8.83 | 1.25 | 0.612 | 0.463 | 0.814 | 0.992 | 0.658 | 0.667 | |||
| Control | [-] | 398. | 397. | 396. | 415. | 0.893 | 8.83 | 1.25 | 0.612 | 0.463 | 0.814 | 0.992 | 0.658 | 0.667 |
Download Data |
Period Mean (original grids) [Watt m-2] |
Model Period Mean (intersection) [Watt m-2] |
Model Period Mean (complement) [Watt m-2] |
Benchmark Period Mean (intersection) [Watt m-2] |
Benchmark Period Mean (complement) [Watt m-2] |
Bias [Watt m-2] |
RMSE [Watt m-2] |
Phase Shift [months] |
Bias Score [1] |
RMSE Score [1] |
Seasonal Cycle Score [1] |
Spatial Distribution Score [1] |
Interannual Variability Score [1] |
Overall Score [1] |
|||
|---|---|---|---|---|---|---|---|---|---|---|---|---|---|---|---|---|---|
| Benchmark | [-] | 382. | |||||||||||||||
| Calib | [-] | 383. | 385. | 382. | 382. | 2.61 | 11.9 | 0.745 | 0.776 | 0.684 | 0.914 | 0.966 | 0.780 | 0.801 | |||
| Control | [-] | 383. | 385. | 382. | 382. | 2.61 | 11.9 | 0.745 | 0.776 | 0.684 | 0.914 | 0.966 | 0.780 | 0.801 |
Download Data |
Period Mean (original grids) [Watt m-2] |
Model Period Mean (intersection) [Watt m-2] |
Model Period Mean (complement) [Watt m-2] |
Benchmark Period Mean (intersection) [Watt m-2] |
Benchmark Period Mean (complement) [Watt m-2] |
Bias [Watt m-2] |
RMSE [Watt m-2] |
Phase Shift [months] |
Bias Score [1] |
RMSE Score [1] |
Seasonal Cycle Score [1] |
Spatial Distribution Score [1] |
Interannual Variability Score [1] |
Overall Score [1] |
|||
|---|---|---|---|---|---|---|---|---|---|---|---|---|---|---|---|---|---|
| Benchmark | [-] | 361. | |||||||||||||||
| Calib | [-] | 363. | 363. | 361. | 392. | 2.23 | 12.4 | 0.788 | 0.742 | 0.680 | 0.907 | 0.999 | 0.766 | 0.796 | |||
| Control | [-] | 363. | 363. | 361. | 392. | 2.23 | 12.4 | 0.788 | 0.742 | 0.680 | 0.907 | 0.999 | 0.766 | 0.796 |
Download Data |
Period Mean (original grids) [Watt m-2] |
Model Period Mean (intersection) [Watt m-2] |
Model Period Mean (complement) [Watt m-2] |
Benchmark Period Mean (intersection) [Watt m-2] |
Benchmark Period Mean (complement) [Watt m-2] |
Bias [Watt m-2] |
RMSE [Watt m-2] |
Phase Shift [months] |
Bias Score [1] |
RMSE Score [1] |
Seasonal Cycle Score [1] |
Spatial Distribution Score [1] |
Interannual Variability Score [1] |
Overall Score [1] |
|||
|---|---|---|---|---|---|---|---|---|---|---|---|---|---|---|---|---|---|
| Benchmark | [-] | 239. | |||||||||||||||
| Calib | [-] | 239. | 241. | 238. | 249. | 2.35 | 11.2 | 0.0941 | 0.910 | 0.828 | 0.994 | 0.998 | 0.894 | 0.909 | |||
| Control | [-] | 239. | 241. | 238. | 249. | 2.35 | 11.2 | 0.0941 | 0.910 | 0.828 | 0.994 | 0.998 | 0.894 | 0.909 |
Download Data |
Period Mean (original grids) [Watt m-2] |
Model Period Mean (intersection) [Watt m-2] |
Model Period Mean (complement) [Watt m-2] |
Benchmark Period Mean (intersection) [Watt m-2] |
Benchmark Period Mean (complement) [Watt m-2] |
Bias [Watt m-2] |
RMSE [Watt m-2] |
Phase Shift [months] |
Bias Score [1] |
RMSE Score [1] |
Seasonal Cycle Score [1] |
Spatial Distribution Score [1] |
Interannual Variability Score [1] |
Overall Score [1] |
|||
|---|---|---|---|---|---|---|---|---|---|---|---|---|---|---|---|---|---|
| Benchmark | [-] | 411. | |||||||||||||||
| Calib | [-] | 413. | 413. | 411. | 414. | 1.99 | 7.46 | 1.66 | 0.470 | 0.415 | 0.739 | 0.993 | 0.743 | 0.629 | |||
| Control | [-] | 413. | 413. | 411. | 414. | 1.99 | 7.46 | 1.66 | 0.470 | 0.415 | 0.739 | 0.993 | 0.743 | 0.629 |
Download Data |
Period Mean (original grids) [Watt m-2] |
Model Period Mean (intersection) [Watt m-2] |
Model Period Mean (complement) [Watt m-2] |
Benchmark Period Mean (intersection) [Watt m-2] |
Benchmark Period Mean (complement) [Watt m-2] |
Bias [Watt m-2] |
RMSE [Watt m-2] |
Phase Shift [months] |
Bias Score [1] |
RMSE Score [1] |
Seasonal Cycle Score [1] |
Spatial Distribution Score [1] |
Interannual Variability Score [1] |
Overall Score [1] |
|||
|---|---|---|---|---|---|---|---|---|---|---|---|---|---|---|---|---|---|
| Benchmark | [-] | 264. | |||||||||||||||
| Calib | [-] | 264. | 265. | 264. | 281. | 1.09 | 9.45 | 0.170 | 0.938 | 0.861 | 0.989 | 1.00 | 0.812 | 0.910 | |||
| Control | [-] | 264. | 265. | 264. | 281. | 1.09 | 9.45 | 0.170 | 0.938 | 0.861 | 0.989 | 1.00 | 0.812 | 0.910 |
Download Data |
Period Mean (original grids) [Watt m-2] |
Model Period Mean (intersection) [Watt m-2] |
Model Period Mean (complement) [Watt m-2] |
Benchmark Period Mean (intersection) [Watt m-2] |
Benchmark Period Mean (complement) [Watt m-2] |
Bias [Watt m-2] |
RMSE [Watt m-2] |
Phase Shift [months] |
Bias Score [1] |
RMSE Score [1] |
Seasonal Cycle Score [1] |
Spatial Distribution Score [1] |
Interannual Variability Score [1] |
Overall Score [1] |
|||
|---|---|---|---|---|---|---|---|---|---|---|---|---|---|---|---|---|---|
| Benchmark | [-] | 295. | |||||||||||||||
| Calib | [-] | 295. | 295. | 293. | 336. | 2.13 | 13.0 | 0.147 | 0.858 | 0.815 | 0.990 | 1.00 | 0.765 | 0.874 | |||
| Control | [-] | 295. | 295. | 293. | 336. | 2.13 | 13.0 | 0.147 | 0.858 | 0.815 | 0.990 | 1.00 | 0.765 | 0.874 |
Download Data |
Period Mean (original grids) [Watt m-2] |
Model Period Mean (intersection) [Watt m-2] |
Model Period Mean (complement) [Watt m-2] |
Benchmark Period Mean (intersection) [Watt m-2] |
Benchmark Period Mean (complement) [Watt m-2] |
Bias [Watt m-2] |
RMSE [Watt m-2] |
Phase Shift [months] |
Bias Score [1] |
RMSE Score [1] |
Seasonal Cycle Score [1] |
Spatial Distribution Score [1] |
Interannual Variability Score [1] |
Overall Score [1] |
|||
|---|---|---|---|---|---|---|---|---|---|---|---|---|---|---|---|---|---|
| Benchmark | [-] | 377. | |||||||||||||||
| Calib | [-] | 383. | 380. | 377. | 408. | 2.62 | 13.5 | 0.369 | 0.744 | 0.722 | 0.970 | 0.998 | 0.828 | 0.831 | |||
| Control | [-] | 383. | 380. | 377. | 408. | 2.62 | 13.5 | 0.369 | 0.744 | 0.722 | 0.970 | 0.998 | 0.828 | 0.831 |
Download Data |
Period Mean (original grids) [Watt m-2] |
Model Period Mean (intersection) [Watt m-2] |
Model Period Mean (complement) [Watt m-2] |
Benchmark Period Mean (intersection) [Watt m-2] |
Benchmark Period Mean (complement) [Watt m-2] |
Bias [Watt m-2] |
RMSE [Watt m-2] |
Phase Shift [months] |
Bias Score [1] |
RMSE Score [1] |
Seasonal Cycle Score [1] |
Spatial Distribution Score [1] |
Interannual Variability Score [1] |
Overall Score [1] |
|||
|---|---|---|---|---|---|---|---|---|---|---|---|---|---|---|---|---|---|
| Benchmark | [-] | 242. | |||||||||||||||
| Calib | [-] | 244. | 245. | 242. | 258. | 2.71 | 9.78 | 0.179 | 0.933 | 0.836 | 0.988 | 1.00 | 0.835 | 0.905 | |||
| Control | [-] | 244. | 245. | 242. | 258. | 2.71 | 9.78 | 0.179 | 0.933 | 0.836 | 0.988 | 1.00 | 0.835 | 0.905 |
Download Data |
Period Mean (original grids) [Watt m-2] |
Model Period Mean (intersection) [Watt m-2] |
Model Period Mean (complement) [Watt m-2] |
Benchmark Period Mean (intersection) [Watt m-2] |
Benchmark Period Mean (complement) [Watt m-2] |
Bias [Watt m-2] |
RMSE [Watt m-2] |
Phase Shift [months] |
Bias Score [1] |
RMSE Score [1] |
Seasonal Cycle Score [1] |
Spatial Distribution Score [1] |
Interannual Variability Score [1] |
Overall Score [1] |
|||
|---|---|---|---|---|---|---|---|---|---|---|---|---|---|---|---|---|---|
| Benchmark | [-] | 351. | |||||||||||||||
| Calib | [-] | 351. | 352. | 350. | 367. | 1.37 | 10.5 | 0.206 | 0.846 | 0.752 | 0.982 | 1.00 | 0.845 | 0.863 | |||
| Control | [-] | 351. | 352. | 350. | 367. | 1.37 | 10.5 | 0.206 | 0.846 | 0.752 | 0.982 | 1.00 | 0.845 | 0.863 |
Download Data |
Period Mean (original grids) [Watt m-2] |
Model Period Mean (intersection) [Watt m-2] |
Model Period Mean (complement) [Watt m-2] |
Benchmark Period Mean (intersection) [Watt m-2] |
Benchmark Period Mean (complement) [Watt m-2] |
Bias [Watt m-2] |
RMSE [Watt m-2] |
Phase Shift [months] |
Bias Score [1] |
RMSE Score [1] |
Seasonal Cycle Score [1] |
Spatial Distribution Score [1] |
Interannual Variability Score [1] |
Overall Score [1] |
|||
|---|---|---|---|---|---|---|---|---|---|---|---|---|---|---|---|---|---|
| Benchmark | [-] | 310. | |||||||||||||||
| Calib | [-] | 307. | 309. | 308. | 333. | 0.977 | 10.2 | 0.189 | 0.847 | 0.767 | 0.982 | 0.999 | 0.745 | 0.851 | |||
| Control | [-] | 307. | 309. | 308. | 333. | 0.977 | 10.2 | 0.189 | 0.847 | 0.767 | 0.982 | 0.999 | 0.745 | 0.851 |
Download Data |
Period Mean (original grids) [Watt m-2] |
Model Period Mean (intersection) [Watt m-2] |
Model Period Mean (complement) [Watt m-2] |
Benchmark Period Mean (intersection) [Watt m-2] |
Benchmark Period Mean (complement) [Watt m-2] |
Bias [Watt m-2] |
RMSE [Watt m-2] |
Phase Shift [months] |
Bias Score [1] |
RMSE Score [1] |
Seasonal Cycle Score [1] |
Spatial Distribution Score [1] |
Interannual Variability Score [1] |
Overall Score [1] |
|||
|---|---|---|---|---|---|---|---|---|---|---|---|---|---|---|---|---|---|
| Benchmark | [-] | 343. | |||||||||||||||
| Calib | [-] | 319. | 319. | 318. | 360. | 1.08 | 11.7 | 0.494 | 0.769 | 0.690 | 0.945 | 0.999 | 0.792 | 0.814 | |||
| Control | [-] | 319. | 319. | 318. | 360. | 1.08 | 11.7 | 0.494 | 0.769 | 0.690 | 0.945 | 0.999 | 0.792 | 0.814 |
Download Data |
Period Mean (original grids) [Watt m-2] |
Model Period Mean (intersection) [Watt m-2] |
Model Period Mean (complement) [Watt m-2] |
Benchmark Period Mean (intersection) [Watt m-2] |
Benchmark Period Mean (complement) [Watt m-2] |
Bias [Watt m-2] |
RMSE [Watt m-2] |
Phase Shift [months] |
Bias Score [1] |
RMSE Score [1] |
Seasonal Cycle Score [1] |
Spatial Distribution Score [1] |
Interannual Variability Score [1] |
Overall Score [1] |
|||
|---|---|---|---|---|---|---|---|---|---|---|---|---|---|---|---|---|---|
| Benchmark | [-] | 341. | |||||||||||||||
| Calib | [-] | 343. | 343. | 341. | 344. | 2.51 | 13.8 | 0.344 | 0.799 | 0.717 | 0.967 | 0.998 | 0.855 | 0.842 | |||
| Control | [-] | 343. | 343. | 341. | 344. | 2.51 | 13.8 | 0.344 | 0.799 | 0.717 | 0.967 | 0.998 | 0.855 | 0.842 |
Download Data |
Period Mean (original grids) [Watt m-2] |
Model Period Mean (intersection) [Watt m-2] |
Model Period Mean (complement) [Watt m-2] |
Benchmark Period Mean (intersection) [Watt m-2] |
Benchmark Period Mean (complement) [Watt m-2] |
Bias [Watt m-2] |
RMSE [Watt m-2] |
Phase Shift [months] |
Bias Score [1] |
RMSE Score [1] |
Seasonal Cycle Score [1] |
Spatial Distribution Score [1] |
Interannual Variability Score [1] |
Overall Score [1] |
|||
|---|---|---|---|---|---|---|---|---|---|---|---|---|---|---|---|---|---|
| Benchmark | [-] | 244. | |||||||||||||||
| Calib | [-] | 243. | 245. | 244. | 252. | 1.21 | 10.1 | 0.0949 | 0.920 | 0.820 | 0.994 | 1.00 | 0.841 | 0.899 | |||
| Control | [-] | 243. | 245. | 244. | 252. | 1.21 | 10.1 | 0.0949 | 0.920 | 0.820 | 0.994 | 1.00 | 0.841 | 0.899 |
Download Data |
Period Mean (original grids) [Watt m-2] |
Model Period Mean (intersection) [Watt m-2] |
Model Period Mean (complement) [Watt m-2] |
Benchmark Period Mean (intersection) [Watt m-2] |
Benchmark Period Mean (complement) [Watt m-2] |
Bias [Watt m-2] |
RMSE [Watt m-2] |
Phase Shift [months] |
Bias Score [1] |
RMSE Score [1] |
Seasonal Cycle Score [1] |
Spatial Distribution Score [1] |
Interannual Variability Score [1] |
Overall Score [1] |
|||
|---|---|---|---|---|---|---|---|---|---|---|---|---|---|---|---|---|---|
| Benchmark | [-] | 372. | |||||||||||||||
| Calib | [-] | 375. | 375. | 370. | 393. | 5.05 | 14.5 | 0.985 | 0.638 | 0.668 | 0.860 | 0.996 | 0.822 | 0.775 | |||
| Control | [-] | 375. | 375. | 370. | 393. | 5.05 | 14.5 | 0.985 | 0.638 | 0.668 | 0.860 | 0.996 | 0.822 | 0.775 |
Download Data |
Period Mean (original grids) [Watt m-2] |
Model Period Mean (intersection) [Watt m-2] |
Model Period Mean (complement) [Watt m-2] |
Benchmark Period Mean (intersection) [Watt m-2] |
Benchmark Period Mean (complement) [Watt m-2] |
Bias [Watt m-2] |
RMSE [Watt m-2] |
Phase Shift [months] |
Bias Score [1] |
RMSE Score [1] |
Seasonal Cycle Score [1] |
Spatial Distribution Score [1] |
Interannual Variability Score [1] |
Overall Score [1] |
|||
|---|---|---|---|---|---|---|---|---|---|---|---|---|---|---|---|---|---|
| Benchmark | [-] | 331. | |||||||||||||||
| Calib | [-] | 334. | 332. | 331. | 0.768 | 9.93 | 0.298 | 0.870 | 0.832 | 0.976 | 0.996 | 0.869 | 0.896 | ||||
| Control | [-] | 334. | 332. | 331. | 0.768 | 9.93 | 0.298 | 0.870 | 0.832 | 0.976 | 0.996 | 0.869 | 0.896 |
Download Data |
Period Mean (original grids) [Watt m-2] |
Model Period Mean (intersection) [Watt m-2] |
Model Period Mean (complement) [Watt m-2] |
Benchmark Period Mean (intersection) [Watt m-2] |
Benchmark Period Mean (complement) [Watt m-2] |
Bias [Watt m-2] |
RMSE [Watt m-2] |
Phase Shift [months] |
Bias Score [1] |
RMSE Score [1] |
Seasonal Cycle Score [1] |
Spatial Distribution Score [1] |
Interannual Variability Score [1] |
Overall Score [1] |
|||
|---|---|---|---|---|---|---|---|---|---|---|---|---|---|---|---|---|---|
| Benchmark | [-] | 277. | |||||||||||||||
| Calib | [-] | 276. | 277. | 276. | 308. | 0.356 | 9.53 | 0.231 | 0.884 | 0.835 | 0.984 | 0.996 | 0.804 | 0.890 | |||
| Control | [-] | 276. | 277. | 276. | 308. | 0.356 | 9.53 | 0.231 | 0.884 | 0.835 | 0.984 | 0.996 | 0.804 | 0.890 |
Download Data |
Period Mean (original grids) [Watt m-2] |
Model Period Mean (intersection) [Watt m-2] |
Model Period Mean (complement) [Watt m-2] |
Benchmark Period Mean (intersection) [Watt m-2] |
Benchmark Period Mean (complement) [Watt m-2] |
Bias [Watt m-2] |
RMSE [Watt m-2] |
Phase Shift [months] |
Bias Score [1] |
RMSE Score [1] |
Seasonal Cycle Score [1] |
Spatial Distribution Score [1] |
Interannual Variability Score [1] |
Overall Score [1] |
|||
|---|---|---|---|---|---|---|---|---|---|---|---|---|---|---|---|---|---|
| Benchmark | [-] | 295. | |||||||||||||||
| Calib | [-] | 298. | 298. | 295. | 2.67 | 13.6 | 0.246 | 0.776 | 0.757 | 0.983 | 0.998 | 0.793 | 0.844 | ||||
| Control | [-] | 298. | 298. | 295. | 2.67 | 13.6 | 0.246 | 0.776 | 0.757 | 0.983 | 0.998 | 0.793 | 0.844 |
Download Data |
Period Mean (original grids) [Watt m-2] |
Model Period Mean (intersection) [Watt m-2] |
Model Period Mean (complement) [Watt m-2] |
Benchmark Period Mean (intersection) [Watt m-2] |
Benchmark Period Mean (complement) [Watt m-2] |
Bias [Watt m-2] |
RMSE [Watt m-2] |
Phase Shift [months] |
Bias Score [1] |
RMSE Score [1] |
Seasonal Cycle Score [1] |
Spatial Distribution Score [1] |
Interannual Variability Score [1] |
Overall Score [1] |
|||
|---|---|---|---|---|---|---|---|---|---|---|---|---|---|---|---|---|---|
| Benchmark | [-] | 405. | |||||||||||||||
| Calib | [-] | 408. | 406. | 405. | 409. | 1.07 | 8.56 | 1.48 | 0.545 | 0.496 | 0.798 | 0.922 | 0.757 | 0.669 | |||
| Control | [-] | 408. | 406. | 405. | 409. | 1.07 | 8.56 | 1.48 | 0.545 | 0.496 | 0.798 | 0.922 | 0.757 | 0.669 |
Download Data |
Period Mean (original grids) [Watt m-2] |
Model Period Mean (intersection) [Watt m-2] |
Model Period Mean (complement) [Watt m-2] |
Benchmark Period Mean (intersection) [Watt m-2] |
Benchmark Period Mean (complement) [Watt m-2] |
Bias [Watt m-2] |
RMSE [Watt m-2] |
Phase Shift [months] |
Bias Score [1] |
RMSE Score [1] |
Seasonal Cycle Score [1] |
Spatial Distribution Score [1] |
Interannual Variability Score [1] |
Overall Score [1] |
|||
|---|---|---|---|---|---|---|---|---|---|---|---|---|---|---|---|---|---|
| Benchmark | [-] | 375. | |||||||||||||||
| Calib | [-] | 376. | 376. | 375. | 351. | 0.489 | 11.5 | 0.665 | 0.758 | 0.658 | 0.937 | 0.994 | 0.828 | 0.805 | |||
| Control | [-] | 376. | 376. | 375. | 351. | 0.489 | 11.5 | 0.665 | 0.758 | 0.658 | 0.937 | 0.994 | 0.828 | 0.805 |
Download Data |
Period Mean (original grids) [Watt m-2] |
Model Period Mean (intersection) [Watt m-2] |
Model Period Mean (complement) [Watt m-2] |
Benchmark Period Mean (intersection) [Watt m-2] |
Benchmark Period Mean (complement) [Watt m-2] |
Bias [Watt m-2] |
RMSE [Watt m-2] |
Phase Shift [months] |
Bias Score [1] |
RMSE Score [1] |
Seasonal Cycle Score [1] |
Spatial Distribution Score [1] |
Interannual Variability Score [1] |
Overall Score [1] |
|||
|---|---|---|---|---|---|---|---|---|---|---|---|---|---|---|---|---|---|
| Benchmark | [-] | 306. | |||||||||||||||
| Calib | [-] | 317. | 314. | 306. | 312. | 7.70 | 24.0 | 0.508 | 0.486 | 0.541 | 0.956 | 0.984 | 0.724 | 0.705 | |||
| Control | [-] | 317. | 314. | 306. | 312. | 7.70 | 24.0 | 0.508 | 0.486 | 0.541 | 0.956 | 0.984 | 0.724 | 0.705 |
Temporally integrated period mean