Mean State
Download Data |
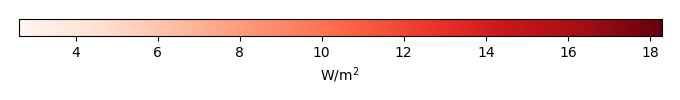
Period Mean (original grids) [W/m2] |
Model Period Mean (intersection) [W/m2] |
Model Period Mean (complement) [W/m2] |
Benchmark Period Mean (intersection) [W/m2] |
Benchmark Period Mean (complement) [W/m2] |
Bias [W/m2] |
RMSE [W/m2] |
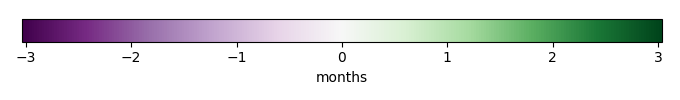
Phase Shift [months] |
Bias Score [1] |
RMSE Score [1] |
Seasonal Cycle Score [1] |
Spatial Distribution Score [1] |
Interannual Variability Score [1] |
Overall Score [1] |
|||
|---|---|---|---|---|---|---|---|---|---|---|---|---|---|---|---|---|---|
| Benchmark | [-] | 217. | |||||||||||||||
| Calib | [-] | 216. | 217. | 217. | 200. | 0.436 | 19.2 | 0.920 | 0.642 | 0.472 | 0.875 | 0.913 | 0.818 | 0.699 | |||
| Control | [-] | 216. | 217. | 217. | 200. | 0.436 | 19.2 | 0.920 | 0.642 | 0.472 | 0.875 | 0.913 | 0.818 | 0.699 |
Download Data |
Period Mean (original grids) [W/m2] |
Model Period Mean (intersection) [W/m2] |
Model Period Mean (complement) [W/m2] |
Benchmark Period Mean (intersection) [W/m2] |
Benchmark Period Mean (complement) [W/m2] |
Bias [W/m2] |
RMSE [W/m2] |
Phase Shift [months] |
Bias Score [1] |
RMSE Score [1] |
Seasonal Cycle Score [1] |
Spatial Distribution Score [1] |
Interannual Variability Score [1] |
Overall Score [1] |
|||
|---|---|---|---|---|---|---|---|---|---|---|---|---|---|---|---|---|---|
| Benchmark | [-] | 242. | |||||||||||||||
| Calib | [-] | 244. | 243. | 242. | 244. | 0.830 | 16.2 | 0.491 | 0.768 | 0.545 | 0.959 | 0.994 | 0.849 | 0.777 | |||
| Control | [-] | 244. | 243. | 242. | 244. | 0.830 | 16.2 | 0.491 | 0.768 | 0.545 | 0.959 | 0.994 | 0.849 | 0.777 |
Download Data |
Period Mean (original grids) [W/m2] |
Model Period Mean (intersection) [W/m2] |
Model Period Mean (complement) [W/m2] |
Benchmark Period Mean (intersection) [W/m2] |
Benchmark Period Mean (complement) [W/m2] |
Bias [W/m2] |
RMSE [W/m2] |
Phase Shift [months] |
Bias Score [1] |
RMSE Score [1] |
Seasonal Cycle Score [1] |
Spatial Distribution Score [1] |
Interannual Variability Score [1] |
Overall Score [1] |
|||
|---|---|---|---|---|---|---|---|---|---|---|---|---|---|---|---|---|---|
| Benchmark | [-] | 231. | |||||||||||||||
| Calib | [-] | 232. | 232. | 231. | 242. | 1.03 | 19.8 | 0.918 | 0.751 | 0.554 | 0.874 | 0.964 | 0.766 | 0.744 | |||
| Control | [-] | 232. | 232. | 231. | 242. | 1.03 | 19.8 | 0.918 | 0.751 | 0.554 | 0.874 | 0.964 | 0.766 | 0.744 |
Download Data |
Period Mean (original grids) [W/m2] |
Model Period Mean (intersection) [W/m2] |
Model Period Mean (complement) [W/m2] |
Benchmark Period Mean (intersection) [W/m2] |
Benchmark Period Mean (complement) [W/m2] |
Bias [W/m2] |
RMSE [W/m2] |
Phase Shift [months] |
Bias Score [1] |
RMSE Score [1] |
Seasonal Cycle Score [1] |
Spatial Distribution Score [1] |
Interannual Variability Score [1] |
Overall Score [1] |
|||
|---|---|---|---|---|---|---|---|---|---|---|---|---|---|---|---|---|---|
| Benchmark | [-] | 113. | |||||||||||||||
| Calib | [-] | 105. | 106. | 113. | 116. | -6.69 | 21.5 | 0.807 | 0.924 | 0.789 | 0.942 | 0.996 | 0.714 | 0.859 | |||
| Control | [-] | 105. | 106. | 113. | 116. | -6.69 | 21.5 | 0.807 | 0.924 | 0.789 | 0.942 | 0.996 | 0.714 | 0.859 |
Download Data |
Period Mean (original grids) [W/m2] |
Model Period Mean (intersection) [W/m2] |
Model Period Mean (complement) [W/m2] |
Benchmark Period Mean (intersection) [W/m2] |
Benchmark Period Mean (complement) [W/m2] |
Bias [W/m2] |
RMSE [W/m2] |
Phase Shift [months] |
Bias Score [1] |
RMSE Score [1] |
Seasonal Cycle Score [1] |
Spatial Distribution Score [1] |
Interannual Variability Score [1] |
Overall Score [1] |
|||
|---|---|---|---|---|---|---|---|---|---|---|---|---|---|---|---|---|---|
| Benchmark | [-] | 213. | |||||||||||||||
| Calib | [-] | 213. | 214. | 212. | 222. | 2.64 | 20.2 | 1.30 | 0.661 | 0.415 | 0.801 | 0.879 | 0.722 | 0.649 | |||
| Control | [-] | 213. | 214. | 212. | 222. | 2.64 | 20.2 | 1.30 | 0.661 | 0.415 | 0.801 | 0.879 | 0.722 | 0.649 |
Download Data |
Period Mean (original grids) [W/m2] |
Model Period Mean (intersection) [W/m2] |
Model Period Mean (complement) [W/m2] |
Benchmark Period Mean (intersection) [W/m2] |
Benchmark Period Mean (complement) [W/m2] |
Bias [W/m2] |
RMSE [W/m2] |
Phase Shift [months] |
Bias Score [1] |
RMSE Score [1] |
Seasonal Cycle Score [1] |
Spatial Distribution Score [1] |
Interannual Variability Score [1] |
Overall Score [1] |
|||
|---|---|---|---|---|---|---|---|---|---|---|---|---|---|---|---|---|---|
| Benchmark | [-] | 126. | |||||||||||||||
| Calib | [-] | 123. | 125. | 126. | 142. | -0.498 | 15.2 | 0.305 | 0.947 | 0.831 | 0.975 | 0.977 | 0.640 | 0.867 | |||
| Control | [-] | 123. | 125. | 126. | 142. | -0.498 | 15.2 | 0.305 | 0.947 | 0.831 | 0.975 | 0.977 | 0.640 | 0.867 |
Download Data |
Period Mean (original grids) [W/m2] |
Model Period Mean (intersection) [W/m2] |
Model Period Mean (complement) [W/m2] |
Benchmark Period Mean (intersection) [W/m2] |
Benchmark Period Mean (complement) [W/m2] |
Bias [W/m2] |
RMSE [W/m2] |
Phase Shift [months] |
Bias Score [1] |
RMSE Score [1] |
Seasonal Cycle Score [1] |
Spatial Distribution Score [1] |
Interannual Variability Score [1] |
Overall Score [1] |
|||
|---|---|---|---|---|---|---|---|---|---|---|---|---|---|---|---|---|---|
| Benchmark | [-] | 174. | |||||||||||||||
| Calib | [-] | 169. | 170. | 175. | 158. | -4.92 | 18.7 | 0.491 | 0.853 | 0.768 | 0.952 | 0.979 | 0.629 | 0.825 | |||
| Control | [-] | 169. | 170. | 175. | 158. | -4.92 | 18.7 | 0.491 | 0.853 | 0.768 | 0.952 | 0.979 | 0.629 | 0.825 |
Download Data |
Period Mean (original grids) [W/m2] |
Model Period Mean (intersection) [W/m2] |
Model Period Mean (complement) [W/m2] |
Benchmark Period Mean (intersection) [W/m2] |
Benchmark Period Mean (complement) [W/m2] |
Bias [W/m2] |
RMSE [W/m2] |
Phase Shift [months] |
Bias Score [1] |
RMSE Score [1] |
Seasonal Cycle Score [1] |
Spatial Distribution Score [1] |
Interannual Variability Score [1] |
Overall Score [1] |
|||
|---|---|---|---|---|---|---|---|---|---|---|---|---|---|---|---|---|---|
| Benchmark | [-] | 211. | |||||||||||||||
| Calib | [-] | 210. | 211. | 211. | 221. | -0.0192 | 21.1 | 0.351 | 0.772 | 0.594 | 0.966 | 0.929 | 0.707 | 0.760 | |||
| Control | [-] | 210. | 211. | 211. | 221. | -0.0192 | 21.1 | 0.351 | 0.772 | 0.594 | 0.966 | 0.929 | 0.707 | 0.760 |
Download Data |
Period Mean (original grids) [W/m2] |
Model Period Mean (intersection) [W/m2] |
Model Period Mean (complement) [W/m2] |
Benchmark Period Mean (intersection) [W/m2] |
Benchmark Period Mean (complement) [W/m2] |
Bias [W/m2] |
RMSE [W/m2] |
Phase Shift [months] |
Bias Score [1] |
RMSE Score [1] |
Seasonal Cycle Score [1] |
Spatial Distribution Score [1] |
Interannual Variability Score [1] |
Overall Score [1] |
|||
|---|---|---|---|---|---|---|---|---|---|---|---|---|---|---|---|---|---|
| Benchmark | [-] | 101. | |||||||||||||||
| Calib | [-] | 94.3 | 95.2 | 101. | 90.0 | -5.79 | 21.0 | 0.600 | 0.930 | 0.801 | 0.960 | 0.910 | 0.654 | 0.843 | |||
| Control | [-] | 94.3 | 95.2 | 101. | 90.0 | -5.79 | 21.0 | 0.600 | 0.930 | 0.801 | 0.960 | 0.910 | 0.654 | 0.843 |
Download Data |
Period Mean (original grids) [W/m2] |
Model Period Mean (intersection) [W/m2] |
Model Period Mean (complement) [W/m2] |
Benchmark Period Mean (intersection) [W/m2] |
Benchmark Period Mean (complement) [W/m2] |
Bias [W/m2] |
RMSE [W/m2] |
Phase Shift [months] |
Bias Score [1] |
RMSE Score [1] |
Seasonal Cycle Score [1] |
Spatial Distribution Score [1] |
Interannual Variability Score [1] |
Overall Score [1] |
|||
|---|---|---|---|---|---|---|---|---|---|---|---|---|---|---|---|---|---|
| Benchmark | [-] | 233. | |||||||||||||||
| Calib | [-] | 227. | 229. | 233. | 212. | -4.49 | 17.7 | 0.474 | 0.856 | 0.775 | 0.960 | 0.990 | 0.767 | 0.854 | |||
| Control | [-] | 227. | 229. | 233. | 212. | -4.49 | 17.7 | 0.474 | 0.856 | 0.775 | 0.960 | 0.990 | 0.767 | 0.854 |
Download Data |
Period Mean (original grids) [W/m2] |
Model Period Mean (intersection) [W/m2] |
Model Period Mean (complement) [W/m2] |
Benchmark Period Mean (intersection) [W/m2] |
Benchmark Period Mean (complement) [W/m2] |
Bias [W/m2] |
RMSE [W/m2] |
Phase Shift [months] |
Bias Score [1] |
RMSE Score [1] |
Seasonal Cycle Score [1] |
Spatial Distribution Score [1] |
Interannual Variability Score [1] |
Overall Score [1] |
|||
|---|---|---|---|---|---|---|---|---|---|---|---|---|---|---|---|---|---|
| Benchmark | [-] | 139. | |||||||||||||||
| Calib | [-] | 134. | 138. | 137. | 177. | 1.19 | 16.8 | 0.388 | 0.913 | 0.830 | 0.974 | 0.999 | 0.672 | 0.870 | |||
| Control | [-] | 134. | 138. | 137. | 177. | 1.19 | 16.8 | 0.388 | 0.913 | 0.830 | 0.974 | 0.999 | 0.672 | 0.870 |
Download Data |
Period Mean (original grids) [W/m2] |
Model Period Mean (intersection) [W/m2] |
Model Period Mean (complement) [W/m2] |
Benchmark Period Mean (intersection) [W/m2] |
Benchmark Period Mean (complement) [W/m2] |
Bias [W/m2] |
RMSE [W/m2] |
Phase Shift [months] |
Bias Score [1] |
RMSE Score [1] |
Seasonal Cycle Score [1] |
Spatial Distribution Score [1] |
Interannual Variability Score [1] |
Overall Score [1] |
|||
|---|---|---|---|---|---|---|---|---|---|---|---|---|---|---|---|---|---|
| Benchmark | [-] | 187. | |||||||||||||||
| Calib | [-] | 183. | 183. | 186. | 187. | -3.29 | 19.9 | 0.507 | 0.829 | 0.710 | 0.945 | 0.997 | 0.719 | 0.818 | |||
| Control | [-] | 183. | 183. | 186. | 187. | -3.29 | 19.9 | 0.507 | 0.829 | 0.710 | 0.945 | 0.997 | 0.719 | 0.818 |
Download Data |
Period Mean (original grids) [W/m2] |
Model Period Mean (intersection) [W/m2] |
Model Period Mean (complement) [W/m2] |
Benchmark Period Mean (intersection) [W/m2] |
Benchmark Period Mean (complement) [W/m2] |
Bias [W/m2] |
RMSE [W/m2] |
Phase Shift [months] |
Bias Score [1] |
RMSE Score [1] |
Seasonal Cycle Score [1] |
Spatial Distribution Score [1] |
Interannual Variability Score [1] |
Overall Score [1] |
|||
|---|---|---|---|---|---|---|---|---|---|---|---|---|---|---|---|---|---|
| Benchmark | [-] | 251. | |||||||||||||||
| Calib | [-] | 240. | 241. | 252. | 216. | -10.6 | 17.9 | 0.333 | 0.794 | 0.764 | 0.975 | 0.999 | 0.700 | 0.833 | |||
| Control | [-] | 240. | 241. | 252. | 216. | -10.6 | 17.9 | 0.333 | 0.794 | 0.764 | 0.975 | 0.999 | 0.700 | 0.833 |
Download Data |
Period Mean (original grids) [W/m2] |
Model Period Mean (intersection) [W/m2] |
Model Period Mean (complement) [W/m2] |
Benchmark Period Mean (intersection) [W/m2] |
Benchmark Period Mean (complement) [W/m2] |
Bias [W/m2] |
RMSE [W/m2] |
Phase Shift [months] |
Bias Score [1] |
RMSE Score [1] |
Seasonal Cycle Score [1] |
Spatial Distribution Score [1] |
Interannual Variability Score [1] |
Overall Score [1] |
|||
|---|---|---|---|---|---|---|---|---|---|---|---|---|---|---|---|---|---|
| Benchmark | [-] | 117. | |||||||||||||||
| Calib | [-] | 107. | 108. | 117. | 104. | -9.37 | 24.4 | 0.617 | 0.904 | 0.784 | 0.949 | 0.992 | 0.726 | 0.856 | |||
| Control | [-] | 107. | 108. | 117. | 104. | -9.37 | 24.4 | 0.617 | 0.904 | 0.784 | 0.949 | 0.992 | 0.726 | 0.856 |
Download Data |
Period Mean (original grids) [W/m2] |
Model Period Mean (intersection) [W/m2] |
Model Period Mean (complement) [W/m2] |
Benchmark Period Mean (intersection) [W/m2] |
Benchmark Period Mean (complement) [W/m2] |
Bias [W/m2] |
RMSE [W/m2] |
Phase Shift [months] |
Bias Score [1] |
RMSE Score [1] |
Seasonal Cycle Score [1] |
Spatial Distribution Score [1] |
Interannual Variability Score [1] |
Overall Score [1] |
|||
|---|---|---|---|---|---|---|---|---|---|---|---|---|---|---|---|---|---|
| Benchmark | [-] | 230. | |||||||||||||||
| Calib | [-] | 229. | 228. | 230. | 236. | -1.53 | 22.2 | 0.705 | 0.718 | 0.661 | 0.909 | 0.992 | 0.734 | 0.779 | |||
| Control | [-] | 229. | 228. | 230. | 236. | -1.53 | 22.2 | 0.705 | 0.718 | 0.661 | 0.909 | 0.992 | 0.734 | 0.779 |
Download Data |
Period Mean (original grids) [W/m2] |
Model Period Mean (intersection) [W/m2] |
Model Period Mean (complement) [W/m2] |
Benchmark Period Mean (intersection) [W/m2] |
Benchmark Period Mean (complement) [W/m2] |
Bias [W/m2] |
RMSE [W/m2] |
Phase Shift [months] |
Bias Score [1] |
RMSE Score [1] |
Seasonal Cycle Score [1] |
Spatial Distribution Score [1] |
Interannual Variability Score [1] |
Overall Score [1] |
|||
|---|---|---|---|---|---|---|---|---|---|---|---|---|---|---|---|---|---|
| Benchmark | [-] | 175. | |||||||||||||||
| Calib | [-] | 174. | 174. | 175. | -0.730 | 16.0 | 0.312 | 0.921 | 0.785 | 0.976 | 1.00 | 0.656 | 0.854 | ||||
| Control | [-] | 174. | 174. | 175. | -0.730 | 16.0 | 0.312 | 0.921 | 0.785 | 0.976 | 1.00 | 0.656 | 0.854 |
Download Data |
Period Mean (original grids) [W/m2] |
Model Period Mean (intersection) [W/m2] |
Model Period Mean (complement) [W/m2] |
Benchmark Period Mean (intersection) [W/m2] |
Benchmark Period Mean (complement) [W/m2] |
Bias [W/m2] |
RMSE [W/m2] |
Phase Shift [months] |
Bias Score [1] |
RMSE Score [1] |
Seasonal Cycle Score [1] |
Spatial Distribution Score [1] |
Interannual Variability Score [1] |
Overall Score [1] |
|||
|---|---|---|---|---|---|---|---|---|---|---|---|---|---|---|---|---|---|
| Benchmark | [-] | 137. | |||||||||||||||
| Calib | [-] | 136. | 136. | 137. | 126. | -1.63 | 15.0 | 0.212 | 0.944 | 0.829 | 0.984 | 0.996 | 0.672 | 0.876 | |||
| Control | [-] | 136. | 136. | 137. | 126. | -1.63 | 15.0 | 0.212 | 0.944 | 0.829 | 0.984 | 0.996 | 0.672 | 0.876 |
Download Data |
Period Mean (original grids) [W/m2] |
Model Period Mean (intersection) [W/m2] |
Model Period Mean (complement) [W/m2] |
Benchmark Period Mean (intersection) [W/m2] |
Benchmark Period Mean (complement) [W/m2] |
Bias [W/m2] |
RMSE [W/m2] |
Phase Shift [months] |
Bias Score [1] |
RMSE Score [1] |
Seasonal Cycle Score [1] |
Spatial Distribution Score [1] |
Interannual Variability Score [1] |
Overall Score [1] |
|||
|---|---|---|---|---|---|---|---|---|---|---|---|---|---|---|---|---|---|
| Benchmark | [-] | 202. | |||||||||||||||
| Calib | [-] | 195. | 192. | 202. | -9.66 | 18.0 | 0.178 | 0.874 | 0.828 | 0.987 | 0.971 | 0.681 | 0.861 | ||||
| Control | [-] | 195. | 192. | 202. | -9.66 | 18.0 | 0.178 | 0.874 | 0.828 | 0.987 | 0.971 | 0.681 | 0.861 |
Download Data |
Period Mean (original grids) [W/m2] |
Model Period Mean (intersection) [W/m2] |
Model Period Mean (complement) [W/m2] |
Benchmark Period Mean (intersection) [W/m2] |
Benchmark Period Mean (complement) [W/m2] |
Bias [W/m2] |
RMSE [W/m2] |
Phase Shift [months] |
Bias Score [1] |
RMSE Score [1] |
Seasonal Cycle Score [1] |
Spatial Distribution Score [1] |
Interannual Variability Score [1] |
Overall Score [1] |
|||
|---|---|---|---|---|---|---|---|---|---|---|---|---|---|---|---|---|---|
| Benchmark | [-] | 206. | |||||||||||||||
| Calib | [-] | 205. | 204. | 205. | 235. | -1.27 | 17.3 | 1.03 | 0.689 | 0.455 | 0.858 | 0.992 | 0.789 | 0.706 | |||
| Control | [-] | 205. | 204. | 205. | 235. | -1.27 | 17.3 | 1.03 | 0.689 | 0.455 | 0.858 | 0.992 | 0.789 | 0.706 |
Download Data |
Period Mean (original grids) [W/m2] |
Model Period Mean (intersection) [W/m2] |
Model Period Mean (complement) [W/m2] |
Benchmark Period Mean (intersection) [W/m2] |
Benchmark Period Mean (complement) [W/m2] |
Bias [W/m2] |
RMSE [W/m2] |
Phase Shift [months] |
Bias Score [1] |
RMSE Score [1] |
Seasonal Cycle Score [1] |
Spatial Distribution Score [1] |
Interannual Variability Score [1] |
Overall Score [1] |
|||
|---|---|---|---|---|---|---|---|---|---|---|---|---|---|---|---|---|---|
| Benchmark | [-] | 213. | |||||||||||||||
| Calib | [-] | 215. | 213. | 213. | 197. | -0.146 | 19.4 | 1.07 | 0.799 | 0.633 | 0.856 | 0.988 | 0.705 | 0.769 | |||
| Control | [-] | 215. | 213. | 213. | 197. | -0.146 | 19.4 | 1.07 | 0.799 | 0.633 | 0.856 | 0.988 | 0.705 | 0.769 |
Download Data |
Period Mean (original grids) [W/m2] |
Model Period Mean (intersection) [W/m2] |
Model Period Mean (complement) [W/m2] |
Benchmark Period Mean (intersection) [W/m2] |
Benchmark Period Mean (complement) [W/m2] |
Bias [W/m2] |
RMSE [W/m2] |
Phase Shift [months] |
Bias Score [1] |
RMSE Score [1] |
Seasonal Cycle Score [1] |
Spatial Distribution Score [1] |
Interannual Variability Score [1] |
Overall Score [1] |
|||
|---|---|---|---|---|---|---|---|---|---|---|---|---|---|---|---|---|---|
| Benchmark | [-] | 208. | |||||||||||||||
| Calib | [-] | 198. | 201. | 208. | 170. | -7.75 | 30.9 | 0.561 | 0.720 | 0.702 | 0.949 | 0.958 | 0.705 | 0.789 | |||
| Control | [-] | 198. | 201. | 208. | 170. | -7.75 | 30.9 | 0.561 | 0.720 | 0.702 | 0.949 | 0.958 | 0.705 | 0.789 |
Temporally integrated period mean