Mean State
Download Data |
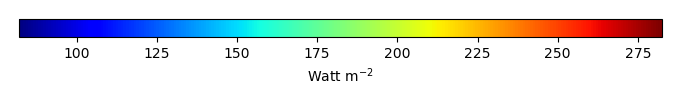
Period Mean (original grids) [Watt m-2] |
Model Period Mean (intersection) [Watt m-2] |
Model Period Mean (complement) [Watt m-2] |
Benchmark Period Mean (intersection) [Watt m-2] |
Benchmark Period Mean (complement) [Watt m-2] |
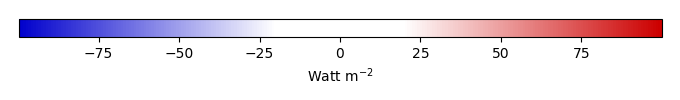
Bias [Watt m-2] |
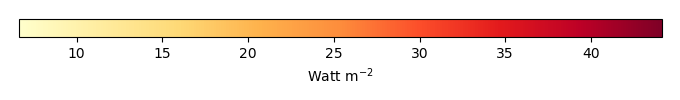
RMSE [Watt m-2] |
Phase Shift [months] |
Bias Score [1] |
RMSE Score [1] |
Seasonal Cycle Score [1] |
Spatial Distribution Score [1] |
Interannual Variability Score [1] |
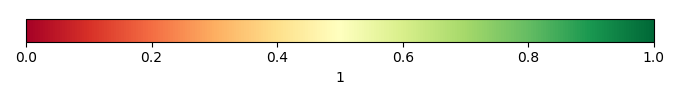
Overall Score [1] |
|||
|---|---|---|---|---|---|---|---|---|---|---|---|---|---|---|---|---|---|
| Benchmark | [-] | 216. | |||||||||||||||
| Calib | [-] | 216. | 217. | 216. | 214. | 1.21 | 17.8 | 0.601 | 0.712 | 0.545 | 0.922 | 0.966 | 0.768 | 0.743 | |||
| Control | [-] | 216. | 217. | 216. | 214. | 1.21 | 17.8 | 0.601 | 0.712 | 0.545 | 0.922 | 0.966 | 0.768 | 0.743 |
Download Data |
Period Mean (original grids) [Watt m-2] |
Model Period Mean (intersection) [Watt m-2] |
Model Period Mean (complement) [Watt m-2] |
Benchmark Period Mean (intersection) [Watt m-2] |
Benchmark Period Mean (complement) [Watt m-2] |
Bias [Watt m-2] |
RMSE [Watt m-2] |
Phase Shift [months] |
Bias Score [1] |
RMSE Score [1] |
Seasonal Cycle Score [1] |
Spatial Distribution Score [1] |
Interannual Variability Score [1] |
Overall Score [1] |
|||
|---|---|---|---|---|---|---|---|---|---|---|---|---|---|---|---|---|---|
| Benchmark | [-] | 241. | |||||||||||||||
| Calib | [-] | 244. | 243. | 241. | 255. | 2.08 | 16.4 | 0.395 | 0.792 | 0.605 | 0.965 | 1.00 | 0.826 | 0.799 | |||
| Control | [-] | 244. | 243. | 241. | 255. | 2.08 | 16.4 | 0.395 | 0.792 | 0.605 | 0.965 | 1.00 | 0.826 | 0.799 |
Download Data |
Period Mean (original grids) [Watt m-2] |
Model Period Mean (intersection) [Watt m-2] |
Model Period Mean (complement) [Watt m-2] |
Benchmark Period Mean (intersection) [Watt m-2] |
Benchmark Period Mean (complement) [Watt m-2] |
Bias [Watt m-2] |
RMSE [Watt m-2] |
Phase Shift [months] |
Bias Score [1] |
RMSE Score [1] |
Seasonal Cycle Score [1] |
Spatial Distribution Score [1] |
Interannual Variability Score [1] |
Overall Score [1] |
|||
|---|---|---|---|---|---|---|---|---|---|---|---|---|---|---|---|---|---|
| Benchmark | [-] | 233. | |||||||||||||||
| Calib | [-] | 232. | 232. | 232. | 248. | -0.513 | 19.4 | 0.648 | 0.784 | 0.593 | 0.915 | 0.970 | 0.718 | 0.762 | |||
| Control | [-] | 232. | 232. | 232. | 248. | -0.513 | 19.4 | 0.648 | 0.784 | 0.593 | 0.915 | 0.970 | 0.718 | 0.762 |
Download Data |
Period Mean (original grids) [Watt m-2] |
Model Period Mean (intersection) [Watt m-2] |
Model Period Mean (complement) [Watt m-2] |
Benchmark Period Mean (intersection) [Watt m-2] |
Benchmark Period Mean (complement) [Watt m-2] |
Bias [Watt m-2] |
RMSE [Watt m-2] |
Phase Shift [months] |
Bias Score [1] |
RMSE Score [1] |
Seasonal Cycle Score [1] |
Spatial Distribution Score [1] |
Interannual Variability Score [1] |
Overall Score [1] |
|||
|---|---|---|---|---|---|---|---|---|---|---|---|---|---|---|---|---|---|
| Benchmark | [-] | 109. | |||||||||||||||
| Calib | [-] | 105. | 106. | 109. | 116. | -3.16 | 14.1 | 0.252 | 0.936 | 0.837 | 0.983 | 0.897 | 0.675 | 0.861 | |||
| Control | [-] | 105. | 106. | 109. | 116. | -3.16 | 14.1 | 0.252 | 0.936 | 0.837 | 0.983 | 0.897 | 0.675 | 0.861 |
Download Data |
Period Mean (original grids) [Watt m-2] |
Model Period Mean (intersection) [Watt m-2] |
Model Period Mean (complement) [Watt m-2] |
Benchmark Period Mean (intersection) [Watt m-2] |
Benchmark Period Mean (complement) [Watt m-2] |
Bias [Watt m-2] |
RMSE [Watt m-2] |
Phase Shift [months] |
Bias Score [1] |
RMSE Score [1] |
Seasonal Cycle Score [1] |
Spatial Distribution Score [1] |
Interannual Variability Score [1] |
Overall Score [1] |
|||
|---|---|---|---|---|---|---|---|---|---|---|---|---|---|---|---|---|---|
| Benchmark | [-] | 210. | |||||||||||||||
| Calib | [-] | 213. | 214. | 209. | 223. | 5.20 | 22.0 | 1.16 | 0.648 | 0.442 | 0.831 | 0.994 | 0.695 | 0.675 | |||
| Control | [-] | 213. | 214. | 209. | 223. | 5.20 | 22.0 | 1.16 | 0.648 | 0.442 | 0.831 | 0.994 | 0.695 | 0.675 |
Download Data |
Period Mean (original grids) [Watt m-2] |
Model Period Mean (intersection) [Watt m-2] |
Model Period Mean (complement) [Watt m-2] |
Benchmark Period Mean (intersection) [Watt m-2] |
Benchmark Period Mean (complement) [Watt m-2] |
Bias [Watt m-2] |
RMSE [Watt m-2] |
Phase Shift [months] |
Bias Score [1] |
RMSE Score [1] |
Seasonal Cycle Score [1] |
Spatial Distribution Score [1] |
Interannual Variability Score [1] |
Overall Score [1] |
|||
|---|---|---|---|---|---|---|---|---|---|---|---|---|---|---|---|---|---|
| Benchmark | [-] | 124. | |||||||||||||||
| Calib | [-] | 123. | 125. | 123. | 141. | 2.00 | 12.7 | 0.253 | 0.952 | 0.856 | 0.983 | 0.994 | 0.650 | 0.882 | |||
| Control | [-] | 123. | 125. | 123. | 141. | 2.00 | 12.7 | 0.253 | 0.952 | 0.856 | 0.983 | 0.994 | 0.650 | 0.882 |
Download Data |
Period Mean (original grids) [Watt m-2] |
Model Period Mean (intersection) [Watt m-2] |
Model Period Mean (complement) [Watt m-2] |
Benchmark Period Mean (intersection) [Watt m-2] |
Benchmark Period Mean (complement) [Watt m-2] |
Bias [Watt m-2] |
RMSE [Watt m-2] |
Phase Shift [months] |
Bias Score [1] |
RMSE Score [1] |
Seasonal Cycle Score [1] |
Spatial Distribution Score [1] |
Interannual Variability Score [1] |
Overall Score [1] |
|||
|---|---|---|---|---|---|---|---|---|---|---|---|---|---|---|---|---|---|
| Benchmark | [-] | 169. | |||||||||||||||
| Calib | [-] | 169. | 170. | 169. | 160. | 1.17 | 16.8 | 0.431 | 0.889 | 0.771 | 0.962 | 0.998 | 0.621 | 0.835 | |||
| Control | [-] | 169. | 170. | 169. | 160. | 1.17 | 16.8 | 0.431 | 0.889 | 0.771 | 0.962 | 0.998 | 0.621 | 0.835 |
Download Data |
Period Mean (original grids) [Watt m-2] |
Model Period Mean (intersection) [Watt m-2] |
Model Period Mean (complement) [Watt m-2] |
Benchmark Period Mean (intersection) [Watt m-2] |
Benchmark Period Mean (complement) [Watt m-2] |
Bias [Watt m-2] |
RMSE [Watt m-2] |
Phase Shift [months] |
Bias Score [1] |
RMSE Score [1] |
Seasonal Cycle Score [1] |
Spatial Distribution Score [1] |
Interannual Variability Score [1] |
Overall Score [1] |
|||
|---|---|---|---|---|---|---|---|---|---|---|---|---|---|---|---|---|---|
| Benchmark | [-] | 211. | |||||||||||||||
| Calib | [-] | 210. | 211. | 211. | 231. | -0.223 | 21.2 | 0.385 | 0.784 | 0.621 | 0.964 | 0.939 | 0.658 | 0.765 | |||
| Control | [-] | 210. | 211. | 211. | 231. | -0.223 | 21.2 | 0.385 | 0.784 | 0.621 | 0.964 | 0.939 | 0.658 | 0.765 |
Download Data |
Period Mean (original grids) [Watt m-2] |
Model Period Mean (intersection) [Watt m-2] |
Model Period Mean (complement) [Watt m-2] |
Benchmark Period Mean (intersection) [Watt m-2] |
Benchmark Period Mean (complement) [Watt m-2] |
Bias [Watt m-2] |
RMSE [Watt m-2] |
Phase Shift [months] |
Bias Score [1] |
RMSE Score [1] |
Seasonal Cycle Score [1] |
Spatial Distribution Score [1] |
Interannual Variability Score [1] |
Overall Score [1] |
|||
|---|---|---|---|---|---|---|---|---|---|---|---|---|---|---|---|---|---|
| Benchmark | [-] | 104. | |||||||||||||||
| Calib | [-] | 94.3 | 95.2 | 104. | 102. | -8.88 | 13.7 | 0.0690 | 0.893 | 0.819 | 0.995 | 0.915 | 0.659 | 0.850 | |||
| Control | [-] | 94.3 | 95.2 | 104. | 102. | -8.88 | 13.7 | 0.0690 | 0.893 | 0.819 | 0.995 | 0.915 | 0.659 | 0.850 |
Download Data |
Period Mean (original grids) [Watt m-2] |
Model Period Mean (intersection) [Watt m-2] |
Model Period Mean (complement) [Watt m-2] |
Benchmark Period Mean (intersection) [Watt m-2] |
Benchmark Period Mean (complement) [Watt m-2] |
Bias [Watt m-2] |
RMSE [Watt m-2] |
Phase Shift [months] |
Bias Score [1] |
RMSE Score [1] |
Seasonal Cycle Score [1] |
Spatial Distribution Score [1] |
Interannual Variability Score [1] |
Overall Score [1] |
|||
|---|---|---|---|---|---|---|---|---|---|---|---|---|---|---|---|---|---|
| Benchmark | [-] | 225. | |||||||||||||||
| Calib | [-] | 227. | 229. | 225. | 214. | 3.68 | 17.3 | 0.384 | 0.883 | 0.741 | 0.968 | 0.998 | 0.719 | 0.842 | |||
| Control | [-] | 227. | 229. | 225. | 214. | 3.68 | 17.3 | 0.384 | 0.883 | 0.741 | 0.968 | 0.998 | 0.719 | 0.842 |
Download Data |
Period Mean (original grids) [Watt m-2] |
Model Period Mean (intersection) [Watt m-2] |
Model Period Mean (complement) [Watt m-2] |
Benchmark Period Mean (intersection) [Watt m-2] |
Benchmark Period Mean (complement) [Watt m-2] |
Bias [Watt m-2] |
RMSE [Watt m-2] |
Phase Shift [months] |
Bias Score [1] |
RMSE Score [1] |
Seasonal Cycle Score [1] |
Spatial Distribution Score [1] |
Interannual Variability Score [1] |
Overall Score [1] |
|||
|---|---|---|---|---|---|---|---|---|---|---|---|---|---|---|---|---|---|
| Benchmark | [-] | 139. | |||||||||||||||
| Calib | [-] | 134. | 138. | 137. | 179. | 0.678 | 16.0 | 0.369 | 0.909 | 0.838 | 0.976 | 0.998 | 0.667 | 0.871 | |||
| Control | [-] | 134. | 138. | 137. | 179. | 0.678 | 16.0 | 0.369 | 0.909 | 0.838 | 0.976 | 0.998 | 0.667 | 0.871 |
Download Data |
Period Mean (original grids) [Watt m-2] |
Model Period Mean (intersection) [Watt m-2] |
Model Period Mean (complement) [Watt m-2] |
Benchmark Period Mean (intersection) [Watt m-2] |
Benchmark Period Mean (complement) [Watt m-2] |
Bias [Watt m-2] |
RMSE [Watt m-2] |
Phase Shift [months] |
Bias Score [1] |
RMSE Score [1] |
Seasonal Cycle Score [1] |
Spatial Distribution Score [1] |
Interannual Variability Score [1] |
Overall Score [1] |
|||
|---|---|---|---|---|---|---|---|---|---|---|---|---|---|---|---|---|---|
| Benchmark | [-] | 191. | |||||||||||||||
| Calib | [-] | 183. | 183. | 187. | 193. | -4.18 | 17.6 | 0.399 | 0.840 | 0.716 | 0.958 | 0.986 | 0.678 | 0.816 | |||
| Control | [-] | 183. | 183. | 187. | 193. | -4.18 | 17.6 | 0.399 | 0.840 | 0.716 | 0.958 | 0.986 | 0.678 | 0.816 |
Download Data |
Period Mean (original grids) [Watt m-2] |
Model Period Mean (intersection) [Watt m-2] |
Model Period Mean (complement) [Watt m-2] |
Benchmark Period Mean (intersection) [Watt m-2] |
Benchmark Period Mean (complement) [Watt m-2] |
Bias [Watt m-2] |
RMSE [Watt m-2] |
Phase Shift [months] |
Bias Score [1] |
RMSE Score [1] |
Seasonal Cycle Score [1] |
Spatial Distribution Score [1] |
Interannual Variability Score [1] |
Overall Score [1] |
|||
|---|---|---|---|---|---|---|---|---|---|---|---|---|---|---|---|---|---|
| Benchmark | [-] | 243. | |||||||||||||||
| Calib | [-] | 240. | 241. | 244. | 220. | -2.73 | 15.4 | 0.313 | 0.879 | 0.797 | 0.977 | 0.999 | 0.651 | 0.850 | |||
| Control | [-] | 240. | 241. | 244. | 220. | -2.73 | 15.4 | 0.313 | 0.879 | 0.797 | 0.977 | 0.999 | 0.651 | 0.850 |
Download Data |
Period Mean (original grids) [Watt m-2] |
Model Period Mean (intersection) [Watt m-2] |
Model Period Mean (complement) [Watt m-2] |
Benchmark Period Mean (intersection) [Watt m-2] |
Benchmark Period Mean (complement) [Watt m-2] |
Bias [Watt m-2] |
RMSE [Watt m-2] |
Phase Shift [months] |
Bias Score [1] |
RMSE Score [1] |
Seasonal Cycle Score [1] |
Spatial Distribution Score [1] |
Interannual Variability Score [1] |
Overall Score [1] |
|||
|---|---|---|---|---|---|---|---|---|---|---|---|---|---|---|---|---|---|
| Benchmark | [-] | 112. | |||||||||||||||
| Calib | [-] | 107. | 108. | 112. | 107. | -4.28 | 13.9 | 0.172 | 0.927 | 0.836 | 0.988 | 0.872 | 0.739 | 0.866 | |||
| Control | [-] | 107. | 108. | 112. | 107. | -4.28 | 13.9 | 0.172 | 0.927 | 0.836 | 0.988 | 0.872 | 0.739 | 0.866 |
Download Data |
Period Mean (original grids) [Watt m-2] |
Model Period Mean (intersection) [Watt m-2] |
Model Period Mean (complement) [Watt m-2] |
Benchmark Period Mean (intersection) [Watt m-2] |
Benchmark Period Mean (complement) [Watt m-2] |
Bias [Watt m-2] |
RMSE [Watt m-2] |
Phase Shift [months] |
Bias Score [1] |
RMSE Score [1] |
Seasonal Cycle Score [1] |
Spatial Distribution Score [1] |
Interannual Variability Score [1] |
Overall Score [1] |
|||
|---|---|---|---|---|---|---|---|---|---|---|---|---|---|---|---|---|---|
| Benchmark | [-] | 232. | |||||||||||||||
| Calib | [-] | 229. | 228. | 230. | 247. | -1.87 | 22.7 | 0.561 | 0.732 | 0.648 | 0.934 | 0.969 | 0.685 | 0.769 | |||
| Control | [-] | 229. | 228. | 230. | 247. | -1.87 | 22.7 | 0.561 | 0.732 | 0.648 | 0.934 | 0.969 | 0.685 | 0.769 |
Download Data |
Period Mean (original grids) [Watt m-2] |
Model Period Mean (intersection) [Watt m-2] |
Model Period Mean (complement) [Watt m-2] |
Benchmark Period Mean (intersection) [Watt m-2] |
Benchmark Period Mean (complement) [Watt m-2] |
Bias [Watt m-2] |
RMSE [Watt m-2] |
Phase Shift [months] |
Bias Score [1] |
RMSE Score [1] |
Seasonal Cycle Score [1] |
Spatial Distribution Score [1] |
Interannual Variability Score [1] |
Overall Score [1] |
|||
|---|---|---|---|---|---|---|---|---|---|---|---|---|---|---|---|---|---|
| Benchmark | [-] | 174. | |||||||||||||||
| Calib | [-] | 174. | 174. | 174. | 0.438 | 16.3 | 0.264 | 0.915 | 0.778 | 0.980 | 0.997 | 0.647 | 0.849 | ||||
| Control | [-] | 174. | 174. | 174. | 0.438 | 16.3 | 0.264 | 0.915 | 0.778 | 0.980 | 0.997 | 0.647 | 0.849 |
Download Data |
Period Mean (original grids) [Watt m-2] |
Model Period Mean (intersection) [Watt m-2] |
Model Period Mean (complement) [Watt m-2] |
Benchmark Period Mean (intersection) [Watt m-2] |
Benchmark Period Mean (complement) [Watt m-2] |
Bias [Watt m-2] |
RMSE [Watt m-2] |
Phase Shift [months] |
Bias Score [1] |
RMSE Score [1] |
Seasonal Cycle Score [1] |
Spatial Distribution Score [1] |
Interannual Variability Score [1] |
Overall Score [1] |
|||
|---|---|---|---|---|---|---|---|---|---|---|---|---|---|---|---|---|---|
| Benchmark | [-] | 135. | |||||||||||||||
| Calib | [-] | 136. | 136. | 135. | 129. | 1.06 | 12.2 | 0.184 | 0.952 | 0.858 | 0.987 | 0.995 | 0.703 | 0.892 | |||
| Control | [-] | 136. | 136. | 135. | 129. | 1.06 | 12.2 | 0.184 | 0.952 | 0.858 | 0.987 | 0.995 | 0.703 | 0.892 |
Download Data |
Period Mean (original grids) [Watt m-2] |
Model Period Mean (intersection) [Watt m-2] |
Model Period Mean (complement) [Watt m-2] |
Benchmark Period Mean (intersection) [Watt m-2] |
Benchmark Period Mean (complement) [Watt m-2] |
Bias [Watt m-2] |
RMSE [Watt m-2] |
Phase Shift [months] |
Bias Score [1] |
RMSE Score [1] |
Seasonal Cycle Score [1] |
Spatial Distribution Score [1] |
Interannual Variability Score [1] |
Overall Score [1] |
|||
|---|---|---|---|---|---|---|---|---|---|---|---|---|---|---|---|---|---|
| Benchmark | [-] | 194. | |||||||||||||||
| Calib | [-] | 195. | 192. | 194. | -1.99 | 15.7 | 0.205 | 0.923 | 0.835 | 0.985 | 0.994 | 0.685 | 0.876 | ||||
| Control | [-] | 195. | 192. | 194. | -1.99 | 15.7 | 0.205 | 0.923 | 0.835 | 0.985 | 0.994 | 0.685 | 0.876 |
Download Data |
Period Mean (original grids) [Watt m-2] |
Model Period Mean (intersection) [Watt m-2] |
Model Period Mean (complement) [Watt m-2] |
Benchmark Period Mean (intersection) [Watt m-2] |
Benchmark Period Mean (complement) [Watt m-2] |
Bias [Watt m-2] |
RMSE [Watt m-2] |
Phase Shift [months] |
Bias Score [1] |
RMSE Score [1] |
Seasonal Cycle Score [1] |
Spatial Distribution Score [1] |
Interannual Variability Score [1] |
Overall Score [1] |
|||
|---|---|---|---|---|---|---|---|---|---|---|---|---|---|---|---|---|---|
| Benchmark | [-] | 204. | |||||||||||||||
| Calib | [-] | 205. | 204. | 203. | 246. | 0.782 | 17.6 | 0.867 | 0.741 | 0.505 | 0.885 | 0.943 | 0.772 | 0.725 | |||
| Control | [-] | 205. | 204. | 203. | 246. | 0.782 | 17.6 | 0.867 | 0.741 | 0.505 | 0.885 | 0.943 | 0.772 | 0.725 |
Download Data |
Period Mean (original grids) [Watt m-2] |
Model Period Mean (intersection) [Watt m-2] |
Model Period Mean (complement) [Watt m-2] |
Benchmark Period Mean (intersection) [Watt m-2] |
Benchmark Period Mean (complement) [Watt m-2] |
Bias [Watt m-2] |
RMSE [Watt m-2] |
Phase Shift [months] |
Bias Score [1] |
RMSE Score [1] |
Seasonal Cycle Score [1] |
Spatial Distribution Score [1] |
Interannual Variability Score [1] |
Overall Score [1] |
|||
|---|---|---|---|---|---|---|---|---|---|---|---|---|---|---|---|---|---|
| Benchmark | [-] | 213. | |||||||||||||||
| Calib | [-] | 215. | 213. | 213. | 196. | -0.377 | 19.4 | 0.761 | 0.820 | 0.633 | 0.907 | 0.997 | 0.662 | 0.775 | |||
| Control | [-] | 215. | 213. | 213. | 196. | -0.377 | 19.4 | 0.761 | 0.820 | 0.633 | 0.907 | 0.997 | 0.662 | 0.775 |
Download Data |
Period Mean (original grids) [Watt m-2] |
Model Period Mean (intersection) [Watt m-2] |
Model Period Mean (complement) [Watt m-2] |
Benchmark Period Mean (intersection) [Watt m-2] |
Benchmark Period Mean (complement) [Watt m-2] |
Bias [Watt m-2] |
RMSE [Watt m-2] |
Phase Shift [months] |
Bias Score [1] |
RMSE Score [1] |
Seasonal Cycle Score [1] |
Spatial Distribution Score [1] |
Interannual Variability Score [1] |
Overall Score [1] |
|||
|---|---|---|---|---|---|---|---|---|---|---|---|---|---|---|---|---|---|
| Benchmark | [-] | 202. | |||||||||||||||
| Calib | [-] | 198. | 201. | 203. | 182. | -1.83 | 29.1 | 0.671 | 0.765 | 0.686 | 0.937 | 0.964 | 0.658 | 0.783 | |||
| Control | [-] | 198. | 201. | 203. | 182. | -1.83 | 29.1 | 0.671 | 0.765 | 0.686 | 0.937 | 0.964 | 0.658 | 0.783 |
Temporally integrated period mean