Mean State
Download Data |
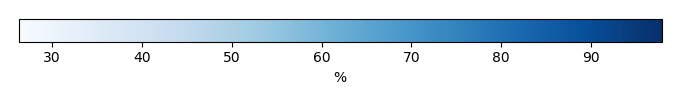
Period Mean (original grids) [%] |
Model Period Mean (intersection) [%] |
Model Period Mean (complement) [%] |
Benchmark Period Mean (intersection) [%] |
Benchmark Period Mean (complement) [%] |
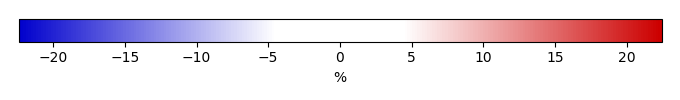
Bias [%] |
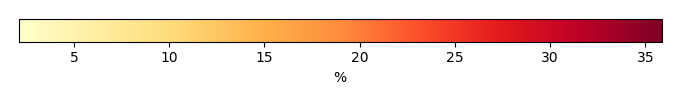
RMSE [%] |
Phase Shift [months] |
Bias Score [1] |
RMSE Score [1] |
Seasonal Cycle Score [1] |
Spatial Distribution Score [1] |
Interannual Variability Score [1] |
Overall Score [1] |
|||
|---|---|---|---|---|---|---|---|---|---|---|---|---|---|---|---|---|---|
| Benchmark | [-] | 78.2 | |||||||||||||||
| Calib | [-] | 72.2 | 70.5 | 78.2 | 82.3 | -7.70 | 14.4 | 1.91 | 0.292 | 0.243 | 0.715 | 0.995 | 0.529 | 0.503 | |||
| Control | [-] | 71.4 | 69.7 | 78.2 | 82.3 | -8.50 | 15.0 | 1.93 | 0.284 | 0.237 | 0.716 | 0.994 | 0.522 | 0.498 |
Download Data |
Period Mean (original grids) [%] |
Model Period Mean (intersection) [%] |
Model Period Mean (complement) [%] |
Benchmark Period Mean (intersection) [%] |
Benchmark Period Mean (complement) [%] |
Bias [%] |
RMSE [%] |
Phase Shift [months] |
Bias Score [1] |
RMSE Score [1] |
Seasonal Cycle Score [1] |
Spatial Distribution Score [1] |
Interannual Variability Score [1] |
Overall Score [1] |
|||
|---|---|---|---|---|---|---|---|---|---|---|---|---|---|---|---|---|---|
| Benchmark | [-] | 52.7 | |||||||||||||||
| Calib | [-] | 47.0 | 48.3 | 52.6 | 77.0 | -4.29 | 13.3 | 0.628 | 0.630 | 0.581 | 0.902 | 0.970 | 0.795 | 0.743 | |||
| Control | [-] | 46.5 | 47.8 | 52.6 | 77.0 | -4.81 | 13.5 | 0.648 | 0.624 | 0.579 | 0.900 | 0.967 | 0.794 | 0.741 |
Download Data |
Period Mean (original grids) [%] |
Model Period Mean (intersection) [%] |
Model Period Mean (complement) [%] |
Benchmark Period Mean (intersection) [%] |
Benchmark Period Mean (complement) [%] |
Bias [%] |
RMSE [%] |
Phase Shift [months] |
Bias Score [1] |
RMSE Score [1] |
Seasonal Cycle Score [1] |
Spatial Distribution Score [1] |
Interannual Variability Score [1] |
Overall Score [1] |
|||
|---|---|---|---|---|---|---|---|---|---|---|---|---|---|---|---|---|---|
| Benchmark | [-] | 65.5 | |||||||||||||||
| Calib | [-] | 64.2 | 64.0 | 65.3 | 75.4 | -1.25 | 11.7 | 1.43 | 0.568 | 0.461 | 0.792 | 0.971 | 0.760 | 0.669 | |||
| Control | [-] | 63.7 | 63.5 | 65.3 | 75.4 | -1.77 | 11.8 | 1.35 | 0.565 | 0.459 | 0.808 | 0.972 | 0.761 | 0.671 |
Download Data |
Period Mean (original grids) [%] |
Model Period Mean (intersection) [%] |
Model Period Mean (complement) [%] |
Benchmark Period Mean (intersection) [%] |
Benchmark Period Mean (complement) [%] |
Bias [%] |
RMSE [%] |
Phase Shift [months] |
Bias Score [1] |
RMSE Score [1] |
Seasonal Cycle Score [1] |
Spatial Distribution Score [1] |
Interannual Variability Score [1] |
Overall Score [1] |
|||
|---|---|---|---|---|---|---|---|---|---|---|---|---|---|---|---|---|---|
| Benchmark | [-] | 77.7 | |||||||||||||||
| Calib | [-] | 89.2 | 88.9 | 77.8 | 79.8 | 11.1 | 17.2 | 4.28 | 0.127 | 0.0884 | 0.260 | 0.848 | 0.771 | 0.364 | |||
| Control | [-] | 89.1 | 88.8 | 77.8 | 79.8 | 11.0 | 17.2 | 3.59 | 0.128 | 0.0877 | 0.383 | 0.850 | 0.762 | 0.383 |
Download Data |
Period Mean (original grids) [%] |
Model Period Mean (intersection) [%] |
Model Period Mean (complement) [%] |
Benchmark Period Mean (intersection) [%] |
Benchmark Period Mean (complement) [%] |
Bias [%] |
RMSE [%] |
Phase Shift [months] |
Bias Score [1] |
RMSE Score [1] |
Seasonal Cycle Score [1] |
Spatial Distribution Score [1] |
Interannual Variability Score [1] |
Overall Score [1] |
|||
|---|---|---|---|---|---|---|---|---|---|---|---|---|---|---|---|---|---|
| Benchmark | [-] | 83.2 | |||||||||||||||
| Calib | [-] | 84.3 | 84.0 | 83.5 | 80.1 | 0.453 | 4.36 | 1.73 | 0.493 | 0.390 | 0.732 | 0.998 | 0.709 | 0.619 | |||
| Control | [-] | 83.7 | 83.4 | 83.5 | 80.1 | -0.182 | 4.40 | 1.91 | 0.478 | 0.387 | 0.698 | 0.998 | 0.706 | 0.609 |
Download Data |
Period Mean (original grids) [%] |
Model Period Mean (intersection) [%] |
Model Period Mean (complement) [%] |
Benchmark Period Mean (intersection) [%] |
Benchmark Period Mean (complement) [%] |
Bias [%] |
RMSE [%] |
Phase Shift [months] |
Bias Score [1] |
RMSE Score [1] |
Seasonal Cycle Score [1] |
Spatial Distribution Score [1] |
Interannual Variability Score [1] |
Overall Score [1] |
|||
|---|---|---|---|---|---|---|---|---|---|---|---|---|---|---|---|---|---|
| Benchmark | [-] | 72.3 | |||||||||||||||
| Calib | [-] | 83.6 | 82.8 | 72.2 | 77.9 | 10.5 | 17.6 | 2.14 | 0.317 | 0.213 | 0.700 | 0.999 | 0.808 | 0.542 | |||
| Control | [-] | 83.8 | 82.9 | 72.2 | 77.9 | 10.7 | 17.7 | 2.00 | 0.311 | 0.214 | 0.722 | 0.998 | 0.796 | 0.542 |
Download Data |
Period Mean (original grids) [%] |
Model Period Mean (intersection) [%] |
Model Period Mean (complement) [%] |
Benchmark Period Mean (intersection) [%] |
Benchmark Period Mean (complement) [%] |
Bias [%] |
RMSE [%] |
Phase Shift [months] |
Bias Score [1] |
RMSE Score [1] |
Seasonal Cycle Score [1] |
Spatial Distribution Score [1] |
Interannual Variability Score [1] |
Overall Score [1] |
|||
|---|---|---|---|---|---|---|---|---|---|---|---|---|---|---|---|---|---|
| Benchmark | [-] | 61.6 | |||||||||||||||
| Calib | [-] | 65.8 | 65.4 | 61.2 | 73.6 | 4.12 | 15.9 | 1.84 | 0.524 | 0.343 | 0.710 | 0.991 | 0.787 | 0.616 | |||
| Control | [-] | 65.4 | 65.0 | 61.2 | 73.6 | 3.78 | 16.1 | 1.82 | 0.522 | 0.339 | 0.711 | 0.989 | 0.785 | 0.614 |
Download Data |
Period Mean (original grids) [%] |
Model Period Mean (intersection) [%] |
Model Period Mean (complement) [%] |
Benchmark Period Mean (intersection) [%] |
Benchmark Period Mean (complement) [%] |
Bias [%] |
RMSE [%] |
Phase Shift [months] |
Bias Score [1] |
RMSE Score [1] |
Seasonal Cycle Score [1] |
Spatial Distribution Score [1] |
Interannual Variability Score [1] |
Overall Score [1] |
|||
|---|---|---|---|---|---|---|---|---|---|---|---|---|---|---|---|---|---|
| Benchmark | [-] | 68.8 | |||||||||||||||
| Calib | [-] | 64.4 | 64.4 | 68.7 | 78.9 | -4.33 | 12.1 | 1.10 | 0.537 | 0.393 | 0.845 | 0.958 | 0.710 | 0.639 | |||
| Control | [-] | 63.5 | 63.5 | 68.7 | 78.9 | -5.18 | 12.5 | 1.10 | 0.513 | 0.391 | 0.845 | 0.954 | 0.703 | 0.633 |
Download Data |
Period Mean (original grids) [%] |
Model Period Mean (intersection) [%] |
Model Period Mean (complement) [%] |
Benchmark Period Mean (intersection) [%] |
Benchmark Period Mean (complement) [%] |
Bias [%] |
RMSE [%] |
Phase Shift [months] |
Bias Score [1] |
RMSE Score [1] |
Seasonal Cycle Score [1] |
Spatial Distribution Score [1] |
Interannual Variability Score [1] |
Overall Score [1] |
|||
|---|---|---|---|---|---|---|---|---|---|---|---|---|---|---|---|---|---|
| Benchmark | [-] | 78.7 | |||||||||||||||
| Calib | [-] | 89.6 | 89.3 | 78.6 | 84.5 | 10.7 | 16.1 | 3.70 | 0.160 | 0.122 | 0.387 | 0.929 | 0.821 | 0.424 | |||
| Control | [-] | 89.5 | 89.2 | 78.6 | 84.5 | 10.6 | 16.2 | 3.64 | 0.160 | 0.122 | 0.391 | 0.923 | 0.818 | 0.422 |
Download Data |
Period Mean (original grids) [%] |
Model Period Mean (intersection) [%] |
Model Period Mean (complement) [%] |
Benchmark Period Mean (intersection) [%] |
Benchmark Period Mean (complement) [%] |
Bias [%] |
RMSE [%] |
Phase Shift [months] |
Bias Score [1] |
RMSE Score [1] |
Seasonal Cycle Score [1] |
Spatial Distribution Score [1] |
Interannual Variability Score [1] |
Overall Score [1] |
|||
|---|---|---|---|---|---|---|---|---|---|---|---|---|---|---|---|---|---|
| Benchmark | [-] | 53.1 | |||||||||||||||
| Calib | [-] | 54.7 | 53.8 | 52.4 | 73.3 | 1.36 | 8.38 | 0.852 | 0.616 | 0.512 | 0.858 | 0.995 | 0.773 | 0.711 | |||
| Control | [-] | 54.3 | 53.4 | 52.4 | 73.3 | 0.974 | 8.33 | 0.852 | 0.620 | 0.512 | 0.858 | 0.996 | 0.774 | 0.712 |
Download Data |
Period Mean (original grids) [%] |
Model Period Mean (intersection) [%] |
Model Period Mean (complement) [%] |
Benchmark Period Mean (intersection) [%] |
Benchmark Period Mean (complement) [%] |
Bias [%] |
RMSE [%] |
Phase Shift [months] |
Bias Score [1] |
RMSE Score [1] |
Seasonal Cycle Score [1] |
Spatial Distribution Score [1] |
Interannual Variability Score [1] |
Overall Score [1] |
|||
|---|---|---|---|---|---|---|---|---|---|---|---|---|---|---|---|---|---|
| Benchmark | [-] | 76.3 | |||||||||||||||
| Calib | [-] | 77.2 | 77.1 | 76.4 | 75.3 | 0.773 | 8.49 | 1.84 | 0.634 | 0.368 | 0.740 | 0.834 | 0.764 | 0.618 | |||
| Control | [-] | 77.1 | 77.1 | 76.4 | 75.3 | 0.698 | 8.62 | 1.76 | 0.624 | 0.367 | 0.755 | 0.808 | 0.764 | 0.614 |
Download Data |
Period Mean (original grids) [%] |
Model Period Mean (intersection) [%] |
Model Period Mean (complement) [%] |
Benchmark Period Mean (intersection) [%] |
Benchmark Period Mean (complement) [%] |
Bias [%] |
RMSE [%] |
Phase Shift [months] |
Bias Score [1] |
RMSE Score [1] |
Seasonal Cycle Score [1] |
Spatial Distribution Score [1] |
Interannual Variability Score [1] |
Overall Score [1] |
|||
|---|---|---|---|---|---|---|---|---|---|---|---|---|---|---|---|---|---|
| Benchmark | [-] | 74.8 | |||||||||||||||
| Calib | [-] | 72.2 | 72.2 | 67.6 | 79.5 | 4.56 | 13.0 | 1.81 | 0.398 | 0.337 | 0.705 | 0.953 | 0.730 | 0.577 | |||
| Control | [-] | 71.9 | 71.9 | 67.6 | 79.5 | 4.26 | 13.1 | 1.79 | 0.395 | 0.335 | 0.709 | 0.949 | 0.728 | 0.575 |
Download Data |
Period Mean (original grids) [%] |
Model Period Mean (intersection) [%] |
Model Period Mean (complement) [%] |
Benchmark Period Mean (intersection) [%] |
Benchmark Period Mean (complement) [%] |
Bias [%] |
RMSE [%] |
Phase Shift [months] |
Bias Score [1] |
RMSE Score [1] |
Seasonal Cycle Score [1] |
Spatial Distribution Score [1] |
Interannual Variability Score [1] |
Overall Score [1] |
|||
|---|---|---|---|---|---|---|---|---|---|---|---|---|---|---|---|---|---|
| Benchmark | [-] | 36.8 | |||||||||||||||
| Calib | [-] | 43.6 | 42.6 | 36.0 | 71.3 | 6.60 | 13.3 | 0.838 | 0.416 | 0.434 | 0.843 | 0.938 | 0.711 | 0.630 | |||
| Control | [-] | 43.2 | 42.2 | 36.0 | 71.3 | 6.26 | 13.1 | 0.834 | 0.419 | 0.437 | 0.844 | 0.938 | 0.715 | 0.632 |
Download Data |
Period Mean (original grids) [%] |
Model Period Mean (intersection) [%] |
Model Period Mean (complement) [%] |
Benchmark Period Mean (intersection) [%] |
Benchmark Period Mean (complement) [%] |
Bias [%] |
RMSE [%] |
Phase Shift [months] |
Bias Score [1] |
RMSE Score [1] |
Seasonal Cycle Score [1] |
Spatial Distribution Score [1] |
Interannual Variability Score [1] |
Overall Score [1] |
|||
|---|---|---|---|---|---|---|---|---|---|---|---|---|---|---|---|---|---|
| Benchmark | [-] | 78.2 | |||||||||||||||
| Calib | [-] | 89.5 | 89.3 | 78.1 | 82.4 | 11.2 | 16.6 | 2.87 | 0.178 | 0.152 | 0.549 | 0.970 | 0.792 | 0.465 | |||
| Control | [-] | 89.4 | 89.2 | 78.1 | 82.4 | 11.1 | 16.6 | 2.76 | 0.181 | 0.150 | 0.572 | 0.971 | 0.789 | 0.469 |
Download Data |
Period Mean (original grids) [%] |
Model Period Mean (intersection) [%] |
Model Period Mean (complement) [%] |
Benchmark Period Mean (intersection) [%] |
Benchmark Period Mean (complement) [%] |
Bias [%] |
RMSE [%] |
Phase Shift [months] |
Bias Score [1] |
RMSE Score [1] |
Seasonal Cycle Score [1] |
Spatial Distribution Score [1] |
Interannual Variability Score [1] |
Overall Score [1] |
|||
|---|---|---|---|---|---|---|---|---|---|---|---|---|---|---|---|---|---|
| Benchmark | [-] | 69.3 | |||||||||||||||
| Calib | [-] | 70.7 | 70.4 | 68.8 | 75.2 | 1.59 | 9.69 | 2.08 | 0.459 | 0.347 | 0.657 | 0.952 | 0.733 | 0.582 | |||
| Control | [-] | 70.1 | 69.9 | 68.8 | 75.2 | 1.01 | 9.74 | 2.07 | 0.445 | 0.345 | 0.660 | 0.954 | 0.732 | 0.580 |
Download Data |
Period Mean (original grids) [%] |
Model Period Mean (intersection) [%] |
Model Period Mean (complement) [%] |
Benchmark Period Mean (intersection) [%] |
Benchmark Period Mean (complement) [%] |
Bias [%] |
RMSE [%] |
Phase Shift [months] |
Bias Score [1] |
RMSE Score [1] |
Seasonal Cycle Score [1] |
Spatial Distribution Score [1] |
Interannual Variability Score [1] |
Overall Score [1] |
|||
|---|---|---|---|---|---|---|---|---|---|---|---|---|---|---|---|---|---|
| Benchmark | [-] | 71.1 | |||||||||||||||
| Calib | [-] | 76.8 | 76.1 | 71.1 | 4.99 | 10.3 | 2.18 | 0.397 | 0.260 | 0.657 | 0.979 | 0.727 | 0.546 | ||||
| Control | [-] | 76.5 | 75.9 | 71.1 | 4.72 | 10.2 | 2.18 | 0.411 | 0.258 | 0.657 | 0.984 | 0.726 | 0.549 |
Download Data |
Period Mean (original grids) [%] |
Model Period Mean (intersection) [%] |
Model Period Mean (complement) [%] |
Benchmark Period Mean (intersection) [%] |
Benchmark Period Mean (complement) [%] |
Bias [%] |
RMSE [%] |
Phase Shift [months] |
Bias Score [1] |
RMSE Score [1] |
Seasonal Cycle Score [1] |
Spatial Distribution Score [1] |
Interannual Variability Score [1] |
Overall Score [1] |
|||
|---|---|---|---|---|---|---|---|---|---|---|---|---|---|---|---|---|---|
| Benchmark | [-] | 72.6 | |||||||||||||||
| Calib | [-] | 80.1 | 80.6 | 72.6 | 82.3 | 8.00 | 14.5 | 1.70 | 0.378 | 0.241 | 0.785 | 0.998 | 0.818 | 0.577 | |||
| Control | [-] | 80.3 | 80.8 | 72.6 | 82.3 | 8.24 | 14.7 | 1.67 | 0.364 | 0.241 | 0.787 | 0.998 | 0.815 | 0.574 |
Download Data |
Period Mean (original grids) [%] |
Model Period Mean (intersection) [%] |
Model Period Mean (complement) [%] |
Benchmark Period Mean (intersection) [%] |
Benchmark Period Mean (complement) [%] |
Bias [%] |
RMSE [%] |
Phase Shift [months] |
Bias Score [1] |
RMSE Score [1] |
Seasonal Cycle Score [1] |
Spatial Distribution Score [1] |
Interannual Variability Score [1] |
Overall Score [1] |
|||
|---|---|---|---|---|---|---|---|---|---|---|---|---|---|---|---|---|---|
| Benchmark | [-] | 53.2 | |||||||||||||||
| Calib | [-] | 62.1 | 62.9 | 53.2 | 9.71 | 15.5 | 1.28 | 0.455 | 0.421 | 0.827 | 0.889 | 0.803 | 0.636 | ||||
| Control | [-] | 61.8 | 62.7 | 53.2 | 9.46 | 15.4 | 1.24 | 0.461 | 0.416 | 0.830 | 0.903 | 0.800 | 0.638 |
Download Data |
Period Mean (original grids) [%] |
Model Period Mean (intersection) [%] |
Model Period Mean (complement) [%] |
Benchmark Period Mean (intersection) [%] |
Benchmark Period Mean (complement) [%] |
Bias [%] |
RMSE [%] |
Phase Shift [months] |
Bias Score [1] |
RMSE Score [1] |
Seasonal Cycle Score [1] |
Spatial Distribution Score [1] |
Interannual Variability Score [1] |
Overall Score [1] |
|||
|---|---|---|---|---|---|---|---|---|---|---|---|---|---|---|---|---|---|
| Benchmark | [-] | 84.8 | |||||||||||||||
| Calib | [-] | 80.9 | 80.7 | 84.9 | 81.2 | -4.16 | 10.3 | 1.31 | 0.396 | 0.304 | 0.840 | 0.940 | 0.594 | 0.563 | |||
| Control | [-] | 80.2 | 80.0 | 84.9 | 81.2 | -4.81 | 10.6 | 1.32 | 0.376 | 0.299 | 0.840 | 0.933 | 0.586 | 0.556 |
Download Data |
Period Mean (original grids) [%] |
Model Period Mean (intersection) [%] |
Model Period Mean (complement) [%] |
Benchmark Period Mean (intersection) [%] |
Benchmark Period Mean (complement) [%] |
Bias [%] |
RMSE [%] |
Phase Shift [months] |
Bias Score [1] |
RMSE Score [1] |
Seasonal Cycle Score [1] |
Spatial Distribution Score [1] |
Interannual Variability Score [1] |
Overall Score [1] |
|||
|---|---|---|---|---|---|---|---|---|---|---|---|---|---|---|---|---|---|
| Benchmark | [-] | 69.8 | |||||||||||||||
| Calib | [-] | 73.3 | 73.1 | 69.8 | 74.2 | 3.33 | 12.9 | 1.21 | 0.437 | 0.370 | 0.842 | 0.846 | 0.705 | 0.595 | |||
| Control | [-] | 72.8 | 72.6 | 69.8 | 74.2 | 2.78 | 12.8 | 1.14 | 0.438 | 0.367 | 0.848 | 0.843 | 0.702 | 0.594 |
Download Data |
Period Mean (original grids) [%] |
Model Period Mean (intersection) [%] |
Model Period Mean (complement) [%] |
Benchmark Period Mean (intersection) [%] |
Benchmark Period Mean (complement) [%] |
Bias [%] |
RMSE [%] |
Phase Shift [months] |
Bias Score [1] |
RMSE Score [1] |
Seasonal Cycle Score [1] |
Spatial Distribution Score [1] |
Interannual Variability Score [1] |
Overall Score [1] |
|||
|---|---|---|---|---|---|---|---|---|---|---|---|---|---|---|---|---|---|
| Benchmark | [-] | 66.3 | |||||||||||||||
| Calib | [-] | 65.7 | 64.8 | 66.0 | 81.1 | -1.20 | 15.5 | 1.39 | 0.356 | 0.378 | 0.806 | 0.967 | 0.679 | 0.594 | |||
| Control | [-] | 65.4 | 64.5 | 66.0 | 81.1 | -1.54 | 15.5 | 1.42 | 0.356 | 0.376 | 0.799 | 0.969 | 0.679 | 0.593 |
Temporally integrated period mean