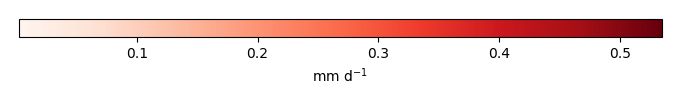
Mean State
Download Data |
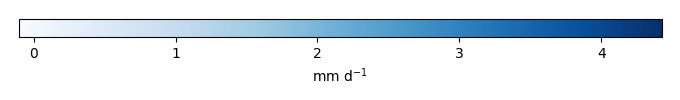
Period Mean (original grids) [mm d-1] |
Model Period Mean (intersection) [mm d-1] |
Model Period Mean (complement) [mm d-1] |
Benchmark Period Mean (intersection) [mm d-1] |
Benchmark Period Mean (complement) [mm d-1] |
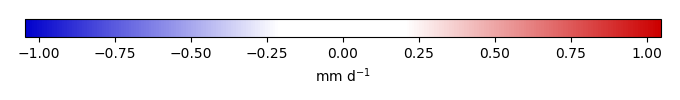
Bias [mm d-1] |
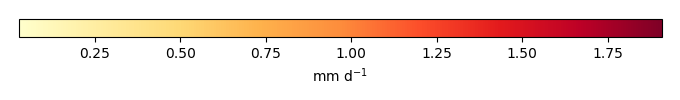
RMSE [mm d-1] |
Phase Shift [months] |
Bias Score [1] |
RMSE Score [1] |
Seasonal Cycle Score [1] |
Spatial Distribution Score [1] |
Interannual Variability Score [1] |
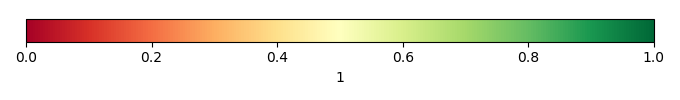
Overall Score [1] |
|||
|---|---|---|---|---|---|---|---|---|---|---|---|---|---|---|---|---|---|
| Benchmark | [-] | 2.04 | |||||||||||||||
| Calib | [-] | 2.61 | 2.69 | 2.27 | 2.04 | 0.643 | 0.901 | 2.36 | 0.328 | 0.337 | 0.636 | 0.979 | 0.634 | 0.542 | |||
| Control | [-] | 2.14 | 2.18 | 1.90 | 2.04 | 0.137 | 0.683 | 2.16 | 0.526 | 0.354 | 0.684 | 0.985 | 0.638 | 0.590 |
Download Data |
Period Mean (original grids) [mm d-1] |
Model Period Mean (intersection) [mm d-1] |
Model Period Mean (complement) [mm d-1] |
Benchmark Period Mean (intersection) [mm d-1] |
Benchmark Period Mean (complement) [mm d-1] |
Bias [mm d-1] |
RMSE [mm d-1] |
Phase Shift [months] |
Bias Score [1] |
RMSE Score [1] |
Seasonal Cycle Score [1] |
Spatial Distribution Score [1] |
Interannual Variability Score [1] |
Overall Score [1] |
|||
|---|---|---|---|---|---|---|---|---|---|---|---|---|---|---|---|---|---|
| Benchmark | [-] | 1.35 | |||||||||||||||
| Calib | [-] | 1.90 | 1.88 | 1.99 | 1.35 | 0.533 | 0.867 | 0.923 | 0.525 | 0.488 | 0.828 | 0.874 | 0.672 | 0.646 | |||
| Control | [-] | 1.47 | 1.48 | 1.84 | 1.35 | 0.129 | 0.723 | 0.776 | 0.672 | 0.475 | 0.874 | 0.949 | 0.635 | 0.680 |
Download Data |
Period Mean (original grids) [mm d-1] |
Model Period Mean (intersection) [mm d-1] |
Model Period Mean (complement) [mm d-1] |
Benchmark Period Mean (intersection) [mm d-1] |
Benchmark Period Mean (complement) [mm d-1] |
Bias [mm d-1] |
RMSE [mm d-1] |
Phase Shift [months] |
Bias Score [1] |
RMSE Score [1] |
Seasonal Cycle Score [1] |
Spatial Distribution Score [1] |
Interannual Variability Score [1] |
Overall Score [1] |
|||
|---|---|---|---|---|---|---|---|---|---|---|---|---|---|---|---|---|---|
| Benchmark | [-] | 1.61 | |||||||||||||||
| Calib | [-] | 2.03 | 2.02 | 1.90 | 1.60 | 2.01 | 0.414 | 0.814 | 1.17 | 0.518 | 0.503 | 0.848 | 0.876 | 0.692 | 0.657 | ||
| Control | [-] | 1.61 | 1.59 | 1.61 | 1.60 | 2.01 | -0.0110 | 0.691 | 1.12 | 0.617 | 0.497 | 0.869 | 0.946 | 0.695 | 0.687 |
Download Data |
Period Mean (original grids) [mm d-1] |
Model Period Mean (intersection) [mm d-1] |
Model Period Mean (complement) [mm d-1] |
Benchmark Period Mean (intersection) [mm d-1] |
Benchmark Period Mean (complement) [mm d-1] |
Bias [mm d-1] |
RMSE [mm d-1] |
Phase Shift [months] |
Bias Score [1] |
RMSE Score [1] |
Seasonal Cycle Score [1] |
Spatial Distribution Score [1] |
Interannual Variability Score [1] |
Overall Score [1] |
|||
|---|---|---|---|---|---|---|---|---|---|---|---|---|---|---|---|---|---|
| Benchmark | [-] | 0.547 | |||||||||||||||
| Calib | [-] | 0.478 | 0.498 | 0.409 | 0.543 | 0.619 | -0.0440 | 0.445 | 0.353 | 0.832 | 0.543 | 0.977 | 0.863 | 0.804 | 0.760 | ||
| Control | [-] | 0.468 | 0.487 | 0.401 | 0.543 | 0.619 | -0.0552 | 0.447 | 0.385 | 0.832 | 0.539 | 0.975 | 0.880 | 0.753 | 0.753 |
Download Data |
Period Mean (original grids) [mm d-1] |
Model Period Mean (intersection) [mm d-1] |
Model Period Mean (complement) [mm d-1] |
Benchmark Period Mean (intersection) [mm d-1] |
Benchmark Period Mean (complement) [mm d-1] |
Bias [mm d-1] |
RMSE [mm d-1] |
Phase Shift [months] |
Bias Score [1] |
RMSE Score [1] |
Seasonal Cycle Score [1] |
Spatial Distribution Score [1] |
Interannual Variability Score [1] |
Overall Score [1] |
|||
|---|---|---|---|---|---|---|---|---|---|---|---|---|---|---|---|---|---|
| Benchmark | [-] | 2.97 | |||||||||||||||
| Calib | [-] | 3.83 | 3.77 | 3.85 | 2.99 | 2.72 | 0.781 | 1.11 | 2.41 | 0.342 | 0.323 | 0.634 | 0.425 | 0.693 | 0.457 | ||
| Control | [-] | 3.40 | 3.34 | 3.40 | 2.99 | 2.72 | 0.347 | 0.977 | 2.42 | 0.358 | 0.332 | 0.632 | 0.422 | 0.672 | 0.458 |
Download Data |
Period Mean (original grids) [mm d-1] |
Model Period Mean (intersection) [mm d-1] |
Model Period Mean (complement) [mm d-1] |
Benchmark Period Mean (intersection) [mm d-1] |
Benchmark Period Mean (complement) [mm d-1] |
Bias [mm d-1] |
RMSE [mm d-1] |
Phase Shift [months] |
Bias Score [1] |
RMSE Score [1] |
Seasonal Cycle Score [1] |
Spatial Distribution Score [1] |
Interannual Variability Score [1] |
Overall Score [1] |
|||
|---|---|---|---|---|---|---|---|---|---|---|---|---|---|---|---|---|---|
| Benchmark | [-] | 1.02 | |||||||||||||||
| Calib | [-] | 0.869 | 0.875 | 0.837 | 1.02 | 1.07 | -0.147 | 0.496 | 0.351 | 0.827 | 0.626 | 0.977 | 0.940 | 0.792 | 0.798 | ||
| Control | [-] | 0.859 | 0.855 | 0.907 | 1.02 | 1.07 | -0.167 | 0.491 | 0.411 | 0.813 | 0.631 | 0.973 | 0.984 | 0.748 | 0.797 |
Download Data |
Period Mean (original grids) [mm d-1] |
Model Period Mean (intersection) [mm d-1] |
Model Period Mean (complement) [mm d-1] |
Benchmark Period Mean (intersection) [mm d-1] |
Benchmark Period Mean (complement) [mm d-1] |
Bias [mm d-1] |
RMSE [mm d-1] |
Phase Shift [months] |
Bias Score [1] |
RMSE Score [1] |
Seasonal Cycle Score [1] |
Spatial Distribution Score [1] |
Interannual Variability Score [1] |
Overall Score [1] |
|||
|---|---|---|---|---|---|---|---|---|---|---|---|---|---|---|---|---|---|
| Benchmark | [-] | 0.965 | |||||||||||||||
| Calib | [-] | 0.977 | 0.945 | 1.68 | 0.950 | 1.69 | -0.00501 | 0.464 | 0.657 | 0.715 | 0.583 | 0.950 | 0.952 | 0.702 | 0.747 | ||
| Control | [-] | 0.874 | 0.843 | 1.62 | 0.950 | 1.69 | -0.107 | 0.448 | 0.662 | 0.696 | 0.600 | 0.952 | 0.951 | 0.690 | 0.748 |
Download Data |
Period Mean (original grids) [mm d-1] |
Model Period Mean (intersection) [mm d-1] |
Model Period Mean (complement) [mm d-1] |
Benchmark Period Mean (intersection) [mm d-1] |
Benchmark Period Mean (complement) [mm d-1] |
Bias [mm d-1] |
RMSE [mm d-1] |
Phase Shift [months] |
Bias Score [1] |
RMSE Score [1] |
Seasonal Cycle Score [1] |
Spatial Distribution Score [1] |
Interannual Variability Score [1] |
Overall Score [1] |
|||
|---|---|---|---|---|---|---|---|---|---|---|---|---|---|---|---|---|---|
| Benchmark | [-] | 1.61 | |||||||||||||||
| Calib | [-] | 2.42 | 2.32 | 3.13 | 1.61 | 1.85 | 0.717 | 1.00 | 1.73 | 0.379 | 0.373 | 0.690 | 0.961 | 0.693 | 0.578 | ||
| Control | [-] | 2.06 | 1.98 | 2.76 | 1.61 | 1.85 | 0.377 | 0.799 | 1.64 | 0.494 | 0.403 | 0.709 | 0.967 | 0.694 | 0.612 |
Download Data |
Period Mean (original grids) [mm d-1] |
Model Period Mean (intersection) [mm d-1] |
Model Period Mean (complement) [mm d-1] |
Benchmark Period Mean (intersection) [mm d-1] |
Benchmark Period Mean (complement) [mm d-1] |
Bias [mm d-1] |
RMSE [mm d-1] |
Phase Shift [months] |
Bias Score [1] |
RMSE Score [1] |
Seasonal Cycle Score [1] |
Spatial Distribution Score [1] |
Interannual Variability Score [1] |
Overall Score [1] |
|||
|---|---|---|---|---|---|---|---|---|---|---|---|---|---|---|---|---|---|
| Benchmark | [-] | 0.568 | |||||||||||||||
| Calib | [-] | 0.494 | 0.527 | 0.321 | 0.569 | 0.420 | -0.0420 | 0.475 | 0.614 | 0.858 | 0.530 | 0.962 | 0.986 | 0.767 | 0.772 | ||
| Control | [-] | 0.483 | 0.520 | 0.305 | 0.569 | 0.420 | -0.0487 | 0.467 | 0.553 | 0.865 | 0.530 | 0.966 | 0.987 | 0.733 | 0.769 |
Download Data |
Period Mean (original grids) [mm d-1] |
Model Period Mean (intersection) [mm d-1] |
Model Period Mean (complement) [mm d-1] |
Benchmark Period Mean (intersection) [mm d-1] |
Benchmark Period Mean (complement) [mm d-1] |
Bias [mm d-1] |
RMSE [mm d-1] |
Phase Shift [months] |
Bias Score [1] |
RMSE Score [1] |
Seasonal Cycle Score [1] |
Spatial Distribution Score [1] |
Interannual Variability Score [1] |
Overall Score [1] |
|||
|---|---|---|---|---|---|---|---|---|---|---|---|---|---|---|---|---|---|
| Benchmark | [-] | 1.18 | |||||||||||||||
| Calib | [-] | 1.30 | 1.19 | 1.71 | 1.17 | 1.83 | 0.0221 | 0.472 | 0.828 | 0.705 | 0.579 | 0.912 | 0.973 | 0.744 | 0.749 | ||
| Control | [-] | 1.07 | 0.967 | 1.49 | 1.17 | 1.83 | -0.204 | 0.515 | 0.918 | 0.637 | 0.565 | 0.900 | 0.974 | 0.733 | 0.729 |
Download Data |
Period Mean (original grids) [mm d-1] |
Model Period Mean (intersection) [mm d-1] |
Model Period Mean (complement) [mm d-1] |
Benchmark Period Mean (intersection) [mm d-1] |
Benchmark Period Mean (complement) [mm d-1] |
Bias [mm d-1] |
RMSE [mm d-1] |
Phase Shift [months] |
Bias Score [1] |
RMSE Score [1] |
Seasonal Cycle Score [1] |
Spatial Distribution Score [1] |
Interannual Variability Score [1] |
Overall Score [1] |
|||
|---|---|---|---|---|---|---|---|---|---|---|---|---|---|---|---|---|---|
| Benchmark | [-] | 1.09 | |||||||||||||||
| Calib | [-] | 1.19 | 1.19 | 1.18 | 1.10 | 0.930 | 0.0953 | 0.465 | 0.497 | 0.799 | 0.651 | 0.967 | 0.985 | 0.742 | 0.799 | ||
| Control | [-] | 1.13 | 1.14 | 1.13 | 1.10 | 0.930 | 0.0381 | 0.451 | 0.457 | 0.818 | 0.653 | 0.970 | 0.956 | 0.741 | 0.798 |
Download Data |
Period Mean (original grids) [mm d-1] |
Model Period Mean (intersection) [mm d-1] |
Model Period Mean (complement) [mm d-1] |
Benchmark Period Mean (intersection) [mm d-1] |
Benchmark Period Mean (complement) [mm d-1] |
Bias [mm d-1] |
RMSE [mm d-1] |
Phase Shift [months] |
Bias Score [1] |
RMSE Score [1] |
Seasonal Cycle Score [1] |
Spatial Distribution Score [1] |
Interannual Variability Score [1] |
Overall Score [1] |
|||
|---|---|---|---|---|---|---|---|---|---|---|---|---|---|---|---|---|---|
| Benchmark | [-] | 1.17 | |||||||||||||||
| Calib | [-] | 1.43 | 1.28 | 1.97 | 1.17 | 1.46 | 0.116 | 0.552 | 1.09 | 0.587 | 0.481 | 0.810 | 0.953 | 0.704 | 0.669 | ||
| Control | [-] | 1.25 | 1.10 | 1.78 | 1.17 | 1.46 | -0.0646 | 0.516 | 1.07 | 0.585 | 0.493 | 0.822 | 0.971 | 0.690 | 0.675 |
Download Data |
Period Mean (original grids) [mm d-1] |
Model Period Mean (intersection) [mm d-1] |
Model Period Mean (complement) [mm d-1] |
Benchmark Period Mean (intersection) [mm d-1] |
Benchmark Period Mean (complement) [mm d-1] |
Bias [mm d-1] |
RMSE [mm d-1] |
Phase Shift [months] |
Bias Score [1] |
RMSE Score [1] |
Seasonal Cycle Score [1] |
Spatial Distribution Score [1] |
Interannual Variability Score [1] |
Overall Score [1] |
|||
|---|---|---|---|---|---|---|---|---|---|---|---|---|---|---|---|---|---|
| Benchmark | [-] | 0.263 | |||||||||||||||
| Calib | [-] | 0.303 | 0.286 | 0.418 | 0.254 | 1.00 | 0.0327 | 0.274 | 1.56 | 0.549 | 0.436 | 0.802 | 0.894 | 0.660 | 0.630 | ||
| Control | [-] | 0.244 | 0.230 | 0.345 | 0.254 | 1.00 | -0.0240 | 0.254 | 1.57 | 0.568 | 0.446 | 0.802 | 0.876 | 0.637 | 0.629 |
Download Data |
Period Mean (original grids) [mm d-1] |
Model Period Mean (intersection) [mm d-1] |
Model Period Mean (complement) [mm d-1] |
Benchmark Period Mean (intersection) [mm d-1] |
Benchmark Period Mean (complement) [mm d-1] |
Bias [mm d-1] |
RMSE [mm d-1] |
Phase Shift [months] |
Bias Score [1] |
RMSE Score [1] |
Seasonal Cycle Score [1] |
Spatial Distribution Score [1] |
Interannual Variability Score [1] |
Overall Score [1] |
|||
|---|---|---|---|---|---|---|---|---|---|---|---|---|---|---|---|---|---|
| Benchmark | [-] | 0.547 | |||||||||||||||
| Calib | [-] | 0.465 | 0.486 | 0.393 | 0.549 | 0.335 | -0.0628 | 0.446 | 0.336 | 0.776 | 0.562 | 0.977 | 0.961 | 0.704 | 0.757 | ||
| Control | [-] | 0.433 | 0.452 | 0.382 | 0.549 | 0.335 | -0.0964 | 0.424 | 0.358 | 0.763 | 0.577 | 0.975 | 0.957 | 0.704 | 0.759 |
Download Data |
Period Mean (original grids) [mm d-1] |
Model Period Mean (intersection) [mm d-1] |
Model Period Mean (complement) [mm d-1] |
Benchmark Period Mean (intersection) [mm d-1] |
Benchmark Period Mean (complement) [mm d-1] |
Bias [mm d-1] |
RMSE [mm d-1] |
Phase Shift [months] |
Bias Score [1] |
RMSE Score [1] |
Seasonal Cycle Score [1] |
Spatial Distribution Score [1] |
Interannual Variability Score [1] |
Overall Score [1] |
|||
|---|---|---|---|---|---|---|---|---|---|---|---|---|---|---|---|---|---|
| Benchmark | [-] | 1.82 | |||||||||||||||
| Calib | [-] | 2.50 | 2.33 | 2.82 | 1.81 | 2.01 | 0.516 | 1.03 | 1.34 | 0.495 | 0.437 | 0.810 | 0.907 | 0.666 | 0.625 | ||
| Control | [-] | 2.08 | 1.93 | 2.36 | 1.81 | 2.01 | 0.119 | 0.933 | 1.30 | 0.501 | 0.440 | 0.826 | 0.931 | 0.673 | 0.635 |
Download Data |
Period Mean (original grids) [mm d-1] |
Model Period Mean (intersection) [mm d-1] |
Model Period Mean (complement) [mm d-1] |
Benchmark Period Mean (intersection) [mm d-1] |
Benchmark Period Mean (complement) [mm d-1] |
Bias [mm d-1] |
RMSE [mm d-1] |
Phase Shift [months] |
Bias Score [1] |
RMSE Score [1] |
Seasonal Cycle Score [1] |
Spatial Distribution Score [1] |
Interannual Variability Score [1] |
Overall Score [1] |
|||
|---|---|---|---|---|---|---|---|---|---|---|---|---|---|---|---|---|---|
| Benchmark | [-] | 1.97 | |||||||||||||||
| Calib | [-] | 1.97 | 1.88 | 2.23 | 1.97 | -0.0893 | 0.614 | 0.406 | 0.769 | 0.634 | 0.965 | 0.961 | 0.718 | 0.780 | |||
| Control | [-] | 1.84 | 1.75 | 2.10 | 1.97 | -0.226 | 0.627 | 0.490 | 0.725 | 0.642 | 0.958 | 0.975 | 0.723 | 0.778 |
Download Data |
Period Mean (original grids) [mm d-1] |
Model Period Mean (intersection) [mm d-1] |
Model Period Mean (complement) [mm d-1] |
Benchmark Period Mean (intersection) [mm d-1] |
Benchmark Period Mean (complement) [mm d-1] |
Bias [mm d-1] |
RMSE [mm d-1] |
Phase Shift [months] |
Bias Score [1] |
RMSE Score [1] |
Seasonal Cycle Score [1] |
Spatial Distribution Score [1] |
Interannual Variability Score [1] |
Overall Score [1] |
|||
|---|---|---|---|---|---|---|---|---|---|---|---|---|---|---|---|---|---|
| Benchmark | [-] | 1.22 | |||||||||||||||
| Calib | [-] | 1.00 | 1.01 | 1.00 | 1.22 | 1.51 | -0.211 | 0.594 | 0.565 | 0.700 | 0.629 | 0.960 | 0.714 | 0.731 | 0.727 | ||
| Control | [-] | 0.987 | 0.994 | 1.13 | 1.22 | 1.51 | -0.224 | 0.547 | 0.570 | 0.716 | 0.643 | 0.959 | 0.756 | 0.708 | 0.737 |
Download Data |
Period Mean (original grids) [mm d-1] |
Model Period Mean (intersection) [mm d-1] |
Model Period Mean (complement) [mm d-1] |
Benchmark Period Mean (intersection) [mm d-1] |
Benchmark Period Mean (complement) [mm d-1] |
Bias [mm d-1] |
RMSE [mm d-1] |
Phase Shift [months] |
Bias Score [1] |
RMSE Score [1] |
Seasonal Cycle Score [1] |
Spatial Distribution Score [1] |
Interannual Variability Score [1] |
Overall Score [1] |
|||
|---|---|---|---|---|---|---|---|---|---|---|---|---|---|---|---|---|---|
| Benchmark | [-] | 1.01 | |||||||||||||||
| Calib | [-] | 0.939 | 0.923 | 1.10 | 1.01 | -0.0868 | 0.563 | 0.794 | 0.663 | 0.500 | 0.938 | 0.864 | 0.664 | 0.688 | |||
| Control | [-] | 0.790 | 0.788 | 1.10 | 1.01 | -0.222 | 0.543 | 0.695 | 0.620 | 0.530 | 0.945 | 0.835 | 0.697 | 0.693 |
Download Data |
Period Mean (original grids) [mm d-1] |
Model Period Mean (intersection) [mm d-1] |
Model Period Mean (complement) [mm d-1] |
Benchmark Period Mean (intersection) [mm d-1] |
Benchmark Period Mean (complement) [mm d-1] |
Bias [mm d-1] |
RMSE [mm d-1] |
Phase Shift [months] |
Bias Score [1] |
RMSE Score [1] |
Seasonal Cycle Score [1] |
Spatial Distribution Score [1] |
Interannual Variability Score [1] |
Overall Score [1] |
|||
|---|---|---|---|---|---|---|---|---|---|---|---|---|---|---|---|---|---|
| Benchmark | [-] | 3.27 | |||||||||||||||
| Calib | [-] | 3.48 | 3.36 | 3.34 | 3.27 | 2.34 | 0.0946 | 0.767 | 2.59 | 0.497 | 0.321 | 0.552 | 0.938 | 0.730 | 0.560 | ||
| Control | [-] | 2.99 | 2.89 | 2.88 | 3.27 | 2.34 | -0.379 | 0.834 | 2.47 | 0.331 | 0.359 | 0.582 | 0.924 | 0.695 | 0.542 |
Download Data |
Period Mean (original grids) [mm d-1] |
Model Period Mean (intersection) [mm d-1] |
Model Period Mean (complement) [mm d-1] |
Benchmark Period Mean (intersection) [mm d-1] |
Benchmark Period Mean (complement) [mm d-1] |
Bias [mm d-1] |
RMSE [mm d-1] |
Phase Shift [months] |
Bias Score [1] |
RMSE Score [1] |
Seasonal Cycle Score [1] |
Spatial Distribution Score [1] |
Interannual Variability Score [1] |
Overall Score [1] |
|||
|---|---|---|---|---|---|---|---|---|---|---|---|---|---|---|---|---|---|
| Benchmark | [-] | 2.28 | |||||||||||||||
| Calib | [-] | 2.42 | 2.39 | 2.55 | 2.28 | 1.55 | 0.104 | 0.647 | 0.882 | 0.712 | 0.551 | 0.893 | 0.935 | 0.702 | 0.724 | ||
| Control | [-] | 2.04 | 1.99 | 2.19 | 2.28 | 1.55 | -0.290 | 0.686 | 0.914 | 0.662 | 0.558 | 0.894 | 0.932 | 0.684 | 0.714 |
Download Data |
Period Mean (original grids) [mm d-1] |
Model Period Mean (intersection) [mm d-1] |
Model Period Mean (complement) [mm d-1] |
Benchmark Period Mean (intersection) [mm d-1] |
Benchmark Period Mean (complement) [mm d-1] |
Bias [mm d-1] |
RMSE [mm d-1] |
Phase Shift [months] |
Bias Score [1] |
RMSE Score [1] |
Seasonal Cycle Score [1] |
Spatial Distribution Score [1] |
Interannual Variability Score [1] |
Overall Score [1] |
|||
|---|---|---|---|---|---|---|---|---|---|---|---|---|---|---|---|---|---|
| Benchmark | [-] | 0.937 | |||||||||||||||
| Calib | [-] | 1.02 | 0.903 | 0.918 | 0.937 | 0.986 | -0.0334 | 0.684 | 1.51 | 0.488 | 0.467 | 0.817 | 0.910 | 0.598 | 0.624 | ||
| Control | [-] | 0.847 | 0.757 | 0.763 | 0.937 | 0.986 | -0.180 | 0.648 | 1.38 | 0.492 | 0.476 | 0.826 | 0.911 | 0.589 | 0.628 |
Temporally integrated period mean