Mean State
Download Data |
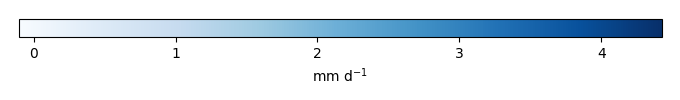
Period Mean (original grids) [mm d-1] |
Model Period Mean (intersection) [mm d-1] |
Model Period Mean (complement) [mm d-1] |
Benchmark Period Mean (intersection) [mm d-1] |
Benchmark Period Mean (complement) [mm d-1] |
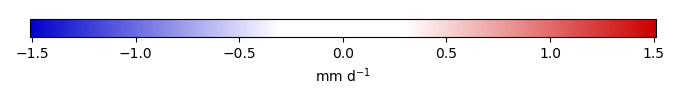
Bias [mm d-1] |
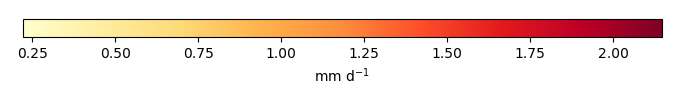
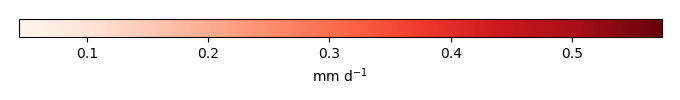
RMSE [mm d-1] |
Phase Shift [months] |
Bias Score [1] |
RMSE Score [1] |
Seasonal Cycle Score [1] |
Spatial Distribution Score [1] |
Interannual Variability Score [1] |
Overall Score [1] |
|||
|---|---|---|---|---|---|---|---|---|---|---|---|---|---|---|---|---|---|
| Benchmark | [-] | 2.49 | |||||||||||||||
| Calib | [-] | 2.61 | 2.73 | 2.07 | 2.49 | 0.249 | 0.887 | 2.61 | 0.536 | 0.306 | 0.604 | 0.969 | 0.620 | 0.557 | |||
| Control | [-] | 2.14 | 2.21 | 1.74 | 2.49 | -0.271 | 0.907 | 2.59 | 0.395 | 0.321 | 0.598 | 0.925 | 0.618 | 0.530 |
Download Data |
Period Mean (original grids) [mm d-1] |
Model Period Mean (intersection) [mm d-1] |
Model Period Mean (complement) [mm d-1] |
Benchmark Period Mean (intersection) [mm d-1] |
Benchmark Period Mean (complement) [mm d-1] |
Bias [mm d-1] |
RMSE [mm d-1] |
Phase Shift [months] |
Bias Score [1] |
RMSE Score [1] |
Seasonal Cycle Score [1] |
Spatial Distribution Score [1] |
Interannual Variability Score [1] |
Overall Score [1] |
|||
|---|---|---|---|---|---|---|---|---|---|---|---|---|---|---|---|---|---|
| Benchmark | [-] | 1.00 | |||||||||||||||
| Calib | [-] | 1.90 | 1.91 | 1.34 | 1.00 | 0.910 | 1.34 | 1.15 | 0.528 | 0.466 | 0.748 | 0.896 | 0.676 | 0.630 | |||
| Control | [-] | 1.47 | 1.50 | 1.14 | 1.00 | 0.498 | 1.09 | 1.04 | 0.532 | 0.477 | 0.768 | 0.837 | 0.681 | 0.629 |
Download Data |
Period Mean (original grids) [mm d-1] |
Model Period Mean (intersection) [mm d-1] |
Model Period Mean (complement) [mm d-1] |
Benchmark Period Mean (intersection) [mm d-1] |
Benchmark Period Mean (complement) [mm d-1] |
Bias [mm d-1] |
RMSE [mm d-1] |
Phase Shift [months] |
Bias Score [1] |
RMSE Score [1] |
Seasonal Cycle Score [1] |
Spatial Distribution Score [1] |
Interannual Variability Score [1] |
Overall Score [1] |
|||
|---|---|---|---|---|---|---|---|---|---|---|---|---|---|---|---|---|---|
| Benchmark | [-] | 1.80 | |||||||||||||||
| Calib | [-] | 2.03 | 2.04 | 1.81 | 1.80 | 2.79 | 0.244 | 0.826 | 1.62 | 0.635 | 0.496 | 0.761 | 0.963 | 0.690 | 0.674 | ||
| Control | [-] | 1.61 | 1.61 | 1.50 | 1.80 | 2.79 | -0.187 | 0.778 | 1.54 | 0.596 | 0.518 | 0.743 | 0.899 | 0.708 | 0.664 |
Download Data |
Period Mean (original grids) [mm d-1] |
Model Period Mean (intersection) [mm d-1] |
Model Period Mean (complement) [mm d-1] |
Benchmark Period Mean (intersection) [mm d-1] |
Benchmark Period Mean (complement) [mm d-1] |
Bias [mm d-1] |
RMSE [mm d-1] |
Phase Shift [months] |
Bias Score [1] |
RMSE Score [1] |
Seasonal Cycle Score [1] |
Spatial Distribution Score [1] |
Interannual Variability Score [1] |
Overall Score [1] |
|||
|---|---|---|---|---|---|---|---|---|---|---|---|---|---|---|---|---|---|
| Benchmark | [-] | 0.842 | |||||||||||||||
| Calib | [-] | 0.478 | 0.509 | 0.397 | 0.838 | 1.01 | -0.329 | 0.504 | 0.218 | 0.663 | 0.649 | 0.988 | 0.890 | 0.791 | 0.772 | ||
| Control | [-] | 0.468 | 0.497 | 0.391 | 0.838 | 1.01 | -0.341 | 0.508 | 0.323 | 0.651 | 0.645 | 0.981 | 0.909 | 0.785 | 0.769 |
Download Data |
Period Mean (original grids) [mm d-1] |
Model Period Mean (intersection) [mm d-1] |
Model Period Mean (complement) [mm d-1] |
Benchmark Period Mean (intersection) [mm d-1] |
Benchmark Period Mean (complement) [mm d-1] |
Bias [mm d-1] |
RMSE [mm d-1] |
Phase Shift [months] |
Bias Score [1] |
RMSE Score [1] |
Seasonal Cycle Score [1] |
Spatial Distribution Score [1] |
Interannual Variability Score [1] |
Overall Score [1] |
|||
|---|---|---|---|---|---|---|---|---|---|---|---|---|---|---|---|---|---|
| Benchmark | [-] | 3.75 | |||||||||||||||
| Calib | [-] | 3.83 | 3.73 | 3.87 | 3.76 | 3.69 | -0.0315 | 0.592 | 2.40 | 0.527 | 0.317 | 0.607 | 0.992 | 0.677 | 0.573 | ||
| Control | [-] | 3.40 | 3.30 | 3.43 | 3.76 | 3.69 | -0.461 | 0.745 | 2.66 | 0.358 | 0.314 | 0.558 | 0.990 | 0.654 | 0.531 |
Download Data |
Period Mean (original grids) [mm d-1] |
Model Period Mean (intersection) [mm d-1] |
Model Period Mean (complement) [mm d-1] |
Benchmark Period Mean (intersection) [mm d-1] |
Benchmark Period Mean (complement) [mm d-1] |
Bias [mm d-1] |
RMSE [mm d-1] |
Phase Shift [months] |
Bias Score [1] |
RMSE Score [1] |
Seasonal Cycle Score [1] |
Spatial Distribution Score [1] |
Interannual Variability Score [1] |
Overall Score [1] |
|||
|---|---|---|---|---|---|---|---|---|---|---|---|---|---|---|---|---|---|
| Benchmark | [-] | 1.12 | |||||||||||||||
| Calib | [-] | 0.869 | 0.875 | 0.838 | 1.11 | 1.39 | -0.239 | 0.489 | 0.546 | 0.785 | 0.665 | 0.963 | 0.984 | 0.751 | 0.802 | ||
| Control | [-] | 0.859 | 0.855 | 0.896 | 1.11 | 1.39 | -0.260 | 0.526 | 0.673 | 0.774 | 0.644 | 0.954 | 0.934 | 0.676 | 0.771 |
Download Data |
Period Mean (original grids) [mm d-1] |
Model Period Mean (intersection) [mm d-1] |
Model Period Mean (complement) [mm d-1] |
Benchmark Period Mean (intersection) [mm d-1] |
Benchmark Period Mean (complement) [mm d-1] |
Bias [mm d-1] |
RMSE [mm d-1] |
Phase Shift [months] |
Bias Score [1] |
RMSE Score [1] |
Seasonal Cycle Score [1] |
Spatial Distribution Score [1] |
Interannual Variability Score [1] |
Overall Score [1] |
|||
|---|---|---|---|---|---|---|---|---|---|---|---|---|---|---|---|---|---|
| Benchmark | [-] | 1.18 | |||||||||||||||
| Calib | [-] | 0.977 | 1.04 | 0.717 | 1.17 | 2.05 | -0.135 | 0.694 | 1.41 | 0.607 | 0.479 | 0.883 | 0.895 | 0.737 | 0.680 | ||
| Control | [-] | 0.874 | 0.925 | 0.657 | 1.17 | 2.05 | -0.247 | 0.656 | 1.35 | 0.594 | 0.503 | 0.890 | 0.904 | 0.736 | 0.689 |
Download Data |
Period Mean (original grids) [mm d-1] |
Model Period Mean (intersection) [mm d-1] |
Model Period Mean (complement) [mm d-1] |
Benchmark Period Mean (intersection) [mm d-1] |
Benchmark Period Mean (complement) [mm d-1] |
Bias [mm d-1] |
RMSE [mm d-1] |
Phase Shift [months] |
Bias Score [1] |
RMSE Score [1] |
Seasonal Cycle Score [1] |
Spatial Distribution Score [1] |
Interannual Variability Score [1] |
Overall Score [1] |
|||
|---|---|---|---|---|---|---|---|---|---|---|---|---|---|---|---|---|---|
| Benchmark | [-] | 2.09 | |||||||||||||||
| Calib | [-] | 2.42 | 2.38 | 2.53 | 2.08 | 3.51 | 0.300 | 1.01 | 1.99 | 0.465 | 0.390 | 0.645 | 0.915 | 0.706 | 0.585 | ||
| Control | [-] | 2.06 | 2.03 | 2.22 | 2.08 | 3.51 | -0.0539 | 0.946 | 1.98 | 0.465 | 0.405 | 0.646 | 0.888 | 0.720 | 0.588 |
Download Data |
Period Mean (original grids) [mm d-1] |
Model Period Mean (intersection) [mm d-1] |
Model Period Mean (complement) [mm d-1] |
Benchmark Period Mean (intersection) [mm d-1] |
Benchmark Period Mean (complement) [mm d-1] |
Bias [mm d-1] |
RMSE [mm d-1] |
Phase Shift [months] |
Bias Score [1] |
RMSE Score [1] |
Seasonal Cycle Score [1] |
Spatial Distribution Score [1] |
Interannual Variability Score [1] |
Overall Score [1] |
|||
|---|---|---|---|---|---|---|---|---|---|---|---|---|---|---|---|---|---|
| Benchmark | [-] | 0.785 | |||||||||||||||
| Calib | [-] | 0.494 | 0.557 | 0.299 | 0.785 | 0.916 | -0.227 | 0.521 | 0.451 | 0.753 | 0.577 | 0.971 | 0.951 | 0.707 | 0.756 | ||
| Control | [-] | 0.483 | 0.552 | 0.280 | 0.785 | 0.916 | -0.232 | 0.513 | 0.531 | 0.751 | 0.577 | 0.965 | 0.930 | 0.683 | 0.747 |
Download Data |
Period Mean (original grids) [mm d-1] |
Model Period Mean (intersection) [mm d-1] |
Model Period Mean (complement) [mm d-1] |
Benchmark Period Mean (intersection) [mm d-1] |
Benchmark Period Mean (complement) [mm d-1] |
Bias [mm d-1] |
RMSE [mm d-1] |
Phase Shift [months] |
Bias Score [1] |
RMSE Score [1] |
Seasonal Cycle Score [1] |
Spatial Distribution Score [1] |
Interannual Variability Score [1] |
Overall Score [1] |
|||
|---|---|---|---|---|---|---|---|---|---|---|---|---|---|---|---|---|---|
| Benchmark | [-] | 0.770 | |||||||||||||||
| Calib | [-] | 1.30 | 1.17 | 1.67 | 0.747 | 2.67 | 0.422 | 0.672 | 1.45 | 0.493 | 0.482 | 0.865 | 0.938 | 0.692 | 0.659 | ||
| Control | [-] | 1.07 | 0.943 | 1.45 | 0.747 | 2.67 | 0.196 | 0.531 | 1.39 | 0.571 | 0.499 | 0.874 | 0.905 | 0.699 | 0.675 |
Download Data |
Period Mean (original grids) [mm d-1] |
Model Period Mean (intersection) [mm d-1] |
Model Period Mean (complement) [mm d-1] |
Benchmark Period Mean (intersection) [mm d-1] |
Benchmark Period Mean (complement) [mm d-1] |
Bias [mm d-1] |
RMSE [mm d-1] |
Phase Shift [months] |
Bias Score [1] |
RMSE Score [1] |
Seasonal Cycle Score [1] |
Spatial Distribution Score [1] |
Interannual Variability Score [1] |
Overall Score [1] |
|||
|---|---|---|---|---|---|---|---|---|---|---|---|---|---|---|---|---|---|
| Benchmark | [-] | 1.31 | |||||||||||||||
| Calib | [-] | 1.19 | 1.20 | 1.16 | 1.32 | 1.06 | -0.118 | 0.480 | 0.404 | 0.777 | 0.634 | 0.972 | 0.979 | 0.787 | 0.797 | ||
| Control | [-] | 1.13 | 1.14 | 1.11 | 1.32 | 1.06 | -0.176 | 0.472 | 0.347 | 0.762 | 0.642 | 0.974 | 0.981 | 0.780 | 0.797 |
Download Data |
Period Mean (original grids) [mm d-1] |
Model Period Mean (intersection) [mm d-1] |
Model Period Mean (complement) [mm d-1] |
Benchmark Period Mean (intersection) [mm d-1] |
Benchmark Period Mean (complement) [mm d-1] |
Bias [mm d-1] |
RMSE [mm d-1] |
Phase Shift [months] |
Bias Score [1] |
RMSE Score [1] |
Seasonal Cycle Score [1] |
Spatial Distribution Score [1] |
Interannual Variability Score [1] |
Overall Score [1] |
|||
|---|---|---|---|---|---|---|---|---|---|---|---|---|---|---|---|---|---|
| Benchmark | [-] | 1.55 | |||||||||||||||
| Calib | [-] | 1.43 | 1.62 | 1.19 | 1.54 | 2.21 | 0.0800 | 0.749 | 1.34 | 0.576 | 0.448 | 0.785 | 0.971 | 0.707 | 0.656 | ||
| Control | [-] | 1.25 | 1.39 | 1.07 | 1.54 | 2.21 | -0.149 | 0.716 | 1.31 | 0.518 | 0.462 | 0.784 | 0.953 | 0.705 | 0.647 |
Download Data |
Period Mean (original grids) [mm d-1] |
Model Period Mean (intersection) [mm d-1] |
Model Period Mean (complement) [mm d-1] |
Benchmark Period Mean (intersection) [mm d-1] |
Benchmark Period Mean (complement) [mm d-1] |
Bias [mm d-1] |
RMSE [mm d-1] |
Phase Shift [months] |
Bias Score [1] |
RMSE Score [1] |
Seasonal Cycle Score [1] |
Spatial Distribution Score [1] |
Interannual Variability Score [1] |
Overall Score [1] |
|||
|---|---|---|---|---|---|---|---|---|---|---|---|---|---|---|---|---|---|
| Benchmark | [-] | 0.585 | |||||||||||||||
| Calib | [-] | 0.303 | 0.715 | 0.196 | 0.574 | 0.884 | 0.141 | 0.583 | 2.14 | 0.538 | 0.298 | 0.755 | 0.947 | 0.759 | 0.599 | ||
| Control | [-] | 0.244 | 0.606 | 0.150 | 0.574 | 0.884 | 0.0320 | 0.533 | 2.07 | 0.582 | 0.310 | 0.767 | 0.936 | 0.723 | 0.605 |
Download Data |
Period Mean (original grids) [mm d-1] |
Model Period Mean (intersection) [mm d-1] |
Model Period Mean (complement) [mm d-1] |
Benchmark Period Mean (intersection) [mm d-1] |
Benchmark Period Mean (complement) [mm d-1] |
Bias [mm d-1] |
RMSE [mm d-1] |
Phase Shift [months] |
Bias Score [1] |
RMSE Score [1] |
Seasonal Cycle Score [1] |
Spatial Distribution Score [1] |
Interannual Variability Score [1] |
Overall Score [1] |
|||
|---|---|---|---|---|---|---|---|---|---|---|---|---|---|---|---|---|---|
| Benchmark | [-] | 0.870 | |||||||||||||||
| Calib | [-] | 0.465 | 0.577 | 0.321 | 0.870 | 0.779 | -0.294 | 0.515 | 0.514 | 0.665 | 0.614 | 0.966 | 0.981 | 0.667 | 0.751 | ||
| Control | [-] | 0.433 | 0.539 | 0.301 | 0.870 | 0.779 | -0.332 | 0.500 | 0.374 | 0.637 | 0.630 | 0.976 | 0.983 | 0.709 | 0.761 |
Download Data |
Period Mean (original grids) [mm d-1] |
Model Period Mean (intersection) [mm d-1] |
Model Period Mean (complement) [mm d-1] |
Benchmark Period Mean (intersection) [mm d-1] |
Benchmark Period Mean (complement) [mm d-1] |
Bias [mm d-1] |
RMSE [mm d-1] |
Phase Shift [months] |
Bias Score [1] |
RMSE Score [1] |
Seasonal Cycle Score [1] |
Spatial Distribution Score [1] |
Interannual Variability Score [1] |
Overall Score [1] |
|||
|---|---|---|---|---|---|---|---|---|---|---|---|---|---|---|---|---|---|
| Benchmark | [-] | 2.11 | |||||||||||||||
| Calib | [-] | 2.50 | 2.31 | 2.68 | 2.09 | 3.06 | 0.218 | 0.854 | 1.80 | 0.509 | 0.382 | 0.672 | 0.949 | 0.682 | 0.596 | ||
| Control | [-] | 2.08 | 1.91 | 2.25 | 2.09 | 3.06 | -0.183 | 0.841 | 1.77 | 0.439 | 0.385 | 0.683 | 0.919 | 0.665 | 0.579 |
Download Data |
Period Mean (original grids) [mm d-1] |
Model Period Mean (intersection) [mm d-1] |
Model Period Mean (complement) [mm d-1] |
Benchmark Period Mean (intersection) [mm d-1] |
Benchmark Period Mean (complement) [mm d-1] |
Bias [mm d-1] |
RMSE [mm d-1] |
Phase Shift [months] |
Bias Score [1] |
RMSE Score [1] |
Seasonal Cycle Score [1] |
Spatial Distribution Score [1] |
Interannual Variability Score [1] |
Overall Score [1] |
|||
|---|---|---|---|---|---|---|---|---|---|---|---|---|---|---|---|---|---|
| Benchmark | [-] | 1.88 | |||||||||||||||
| Calib | [-] | 1.97 | 1.87 | 2.15 | 1.88 | -0.00732 | 0.563 | 0.357 | 0.813 | 0.657 | 0.966 | 0.992 | 0.770 | 0.809 | |||
| Control | [-] | 1.84 | 1.74 | 2.02 | 1.88 | -0.145 | 0.540 | 0.395 | 0.801 | 0.673 | 0.964 | 0.995 | 0.764 | 0.812 |
Download Data |
Period Mean (original grids) [mm d-1] |
Model Period Mean (intersection) [mm d-1] |
Model Period Mean (complement) [mm d-1] |
Benchmark Period Mean (intersection) [mm d-1] |
Benchmark Period Mean (complement) [mm d-1] |
Bias [mm d-1] |
RMSE [mm d-1] |
Phase Shift [months] |
Bias Score [1] |
RMSE Score [1] |
Seasonal Cycle Score [1] |
Spatial Distribution Score [1] |
Interannual Variability Score [1] |
Overall Score [1] |
|||
|---|---|---|---|---|---|---|---|---|---|---|---|---|---|---|---|---|---|
| Benchmark | [-] | 1.13 | |||||||||||||||
| Calib | [-] | 1.00 | 1.01 | 1.01 | 1.12 | 1.31 | -0.119 | 0.494 | 0.0532 | 0.812 | 0.615 | 0.997 | 0.990 | 0.700 | 0.788 | ||
| Control | [-] | 0.987 | 0.988 | 1.11 | 1.12 | 1.31 | -0.137 | 0.459 | 0.250 | 0.825 | 0.624 | 0.985 | 0.989 | 0.693 | 0.790 |
Download Data |
Period Mean (original grids) [mm d-1] |
Model Period Mean (intersection) [mm d-1] |
Model Period Mean (complement) [mm d-1] |
Benchmark Period Mean (intersection) [mm d-1] |
Benchmark Period Mean (complement) [mm d-1] |
Bias [mm d-1] |
RMSE [mm d-1] |
Phase Shift [months] |
Bias Score [1] |
RMSE Score [1] |
Seasonal Cycle Score [1] |
Spatial Distribution Score [1] |
Interannual Variability Score [1] |
Overall Score [1] |
|||
|---|---|---|---|---|---|---|---|---|---|---|---|---|---|---|---|---|---|
| Benchmark | [-] | 0.778 | |||||||||||||||
| Calib | [-] | 0.939 | 0.922 | 1.04 | 0.778 | 0.144 | 0.753 | 1.82 | 0.523 | 0.238 | 0.798 | 0.944 | 0.789 | 0.588 | |||
| Control | [-] | 0.790 | 0.783 | 1.04 | 0.778 | 0.00500 | 0.650 | 1.71 | 0.552 | 0.259 | 0.814 | 0.932 | 0.726 | 0.590 |
Download Data |
Period Mean (original grids) [mm d-1] |
Model Period Mean (intersection) [mm d-1] |
Model Period Mean (complement) [mm d-1] |
Benchmark Period Mean (intersection) [mm d-1] |
Benchmark Period Mean (complement) [mm d-1] |
Bias [mm d-1] |
RMSE [mm d-1] |
Phase Shift [months] |
Bias Score [1] |
RMSE Score [1] |
Seasonal Cycle Score [1] |
Spatial Distribution Score [1] |
Interannual Variability Score [1] |
Overall Score [1] |
|||
|---|---|---|---|---|---|---|---|---|---|---|---|---|---|---|---|---|---|
| Benchmark | [-] | 3.55 | |||||||||||||||
| Calib | [-] | 3.48 | 3.37 | 3.29 | 3.55 | 4.17 | -0.181 | 0.785 | 2.19 | 0.460 | 0.319 | 0.693 | 0.980 | 0.720 | 0.582 | ||
| Control | [-] | 2.99 | 2.90 | 2.81 | 3.55 | 4.17 | -0.653 | 0.984 | 2.19 | 0.246 | 0.338 | 0.688 | 0.970 | 0.730 | 0.552 |
Download Data |
Period Mean (original grids) [mm d-1] |
Model Period Mean (intersection) [mm d-1] |
Model Period Mean (complement) [mm d-1] |
Benchmark Period Mean (intersection) [mm d-1] |
Benchmark Period Mean (complement) [mm d-1] |
Bias [mm d-1] |
RMSE [mm d-1] |
Phase Shift [months] |
Bias Score [1] |
RMSE Score [1] |
Seasonal Cycle Score [1] |
Spatial Distribution Score [1] |
Interannual Variability Score [1] |
Overall Score [1] |
|||
|---|---|---|---|---|---|---|---|---|---|---|---|---|---|---|---|---|---|
| Benchmark | [-] | 1.85 | |||||||||||||||
| Calib | [-] | 2.42 | 2.39 | 2.53 | 1.85 | 2.14 | 0.537 | 1.20 | 1.51 | 0.485 | 0.442 | 0.800 | 0.820 | 0.665 | 0.609 | ||
| Control | [-] | 2.04 | 1.99 | 2.18 | 1.85 | 2.14 | 0.141 | 1.04 | 1.22 | 0.519 | 0.465 | 0.850 | 0.819 | 0.692 | 0.635 |
Download Data |
Period Mean (original grids) [mm d-1] |
Model Period Mean (intersection) [mm d-1] |
Model Period Mean (complement) [mm d-1] |
Benchmark Period Mean (intersection) [mm d-1] |
Benchmark Period Mean (complement) [mm d-1] |
Bias [mm d-1] |
RMSE [mm d-1] |
Phase Shift [months] |
Bias Score [1] |
RMSE Score [1] |
Seasonal Cycle Score [1] |
Spatial Distribution Score [1] |
Interannual Variability Score [1] |
Overall Score [1] |
|||
|---|---|---|---|---|---|---|---|---|---|---|---|---|---|---|---|---|---|
| Benchmark | [-] | 1.18 | |||||||||||||||
| Calib | [-] | 1.02 | 1.02 | 0.666 | 1.18 | 1.12 | -0.161 | 0.844 | 2.13 | 0.389 | 0.422 | 0.763 | 0.891 | 0.641 | 0.588 | ||
| Control | [-] | 0.847 | 0.852 | 0.558 | 1.18 | 1.12 | -0.327 | 0.820 | 2.08 | 0.365 | 0.430 | 0.764 | 0.813 | 0.630 | 0.572 |
Temporally integrated period mean