Mean State
Download Data |
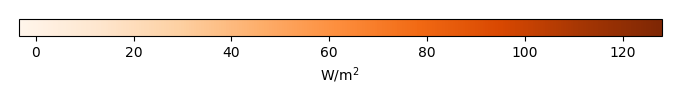
Period Mean (original grids) [W/m2] |
Model Period Mean (intersection) [W/m2] |
Model Period Mean (complement) [W/m2] |
Benchmark Period Mean (intersection) [W/m2] |
Benchmark Period Mean (complement) [W/m2] |
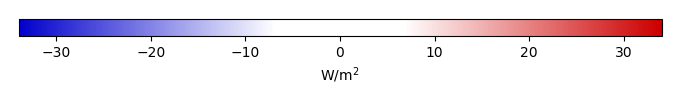
Bias [W/m2] |
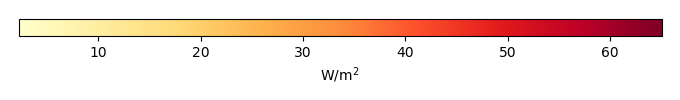
RMSE [W/m2] |
Phase Shift [months] |
Bias Score [1] |
RMSE Score [1] |
Seasonal Cycle Score [1] |
Spatial Distribution Score [1] |
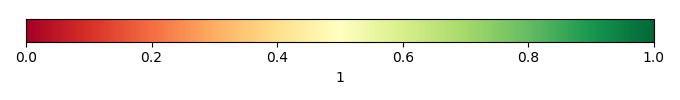
Overall Score [1] |
|||
|---|---|---|---|---|---|---|---|---|---|---|---|---|---|---|---|---|
| Benchmark | [-] | 70.8 | ||||||||||||||
| Calib | [-] | 75.5 | 78.2 | 65.2 | 70.8 | 7.35 | 17.9 | 1.91 | 0.282 | 0.185 | 0.778 | 0.986 | 0.483 | |||
| Control | [-] | 61.8 | 63.4 | 54.4 | 70.8 | -7.45 | 18.4 | 1.87 | 0.247 | 0.196 | 0.784 | 0.956 | 0.476 |
Download Data |
Period Mean (original grids) [W/m2] |
Model Period Mean (intersection) [W/m2] |
Model Period Mean (complement) [W/m2] |
Benchmark Period Mean (intersection) [W/m2] |
Benchmark Period Mean (complement) [W/m2] |
Bias [W/m2] |
RMSE [W/m2] |
Phase Shift [months] |
Bias Score [1] |
RMSE Score [1] |
Seasonal Cycle Score [1] |
Spatial Distribution Score [1] |
Overall Score [1] |
|||
|---|---|---|---|---|---|---|---|---|---|---|---|---|---|---|---|---|
| Benchmark | [-] | 47.8 | ||||||||||||||
| Calib | [-] | 54.8 | 54.3 | 59.8 | 47.8 | 6.44 | 21.7 | 0.992 | 0.688 | 0.520 | 0.835 | 0.984 | 0.709 | |||
| Control | [-] | 42.5 | 42.6 | 55.2 | 47.8 | -5.27 | 20.9 | 1.03 | 0.649 | 0.526 | 0.814 | 0.948 | 0.693 |
Download Data |
Period Mean (original grids) [W/m2] |
Model Period Mean (intersection) [W/m2] |
Model Period Mean (complement) [W/m2] |
Benchmark Period Mean (intersection) [W/m2] |
Benchmark Period Mean (complement) [W/m2] |
Bias [W/m2] |
RMSE [W/m2] |
Phase Shift [months] |
Bias Score [1] |
RMSE Score [1] |
Seasonal Cycle Score [1] |
Spatial Distribution Score [1] |
Overall Score [1] |
|||
|---|---|---|---|---|---|---|---|---|---|---|---|---|---|---|---|---|
| Benchmark | [-] | 52.0 | ||||||||||||||
| Calib | [-] | 58.7 | 58.8 | 52.8 | 52.0 | 53.4 | 6.72 | 19.4 | 1.42 | 0.628 | 0.529 | 0.796 | 0.968 | 0.690 | ||
| Control | [-] | 46.6 | 46.4 | 43.9 | 52.0 | 53.4 | -5.66 | 20.1 | 1.50 | 0.577 | 0.506 | 0.773 | 0.975 | 0.667 |
Download Data |
Period Mean (original grids) [W/m2] |
Model Period Mean (intersection) [W/m2] |
Model Period Mean (complement) [W/m2] |
Benchmark Period Mean (intersection) [W/m2] |
Benchmark Period Mean (complement) [W/m2] |
Bias [W/m2] |
RMSE [W/m2] |
Phase Shift [months] |
Bias Score [1] |
RMSE Score [1] |
Seasonal Cycle Score [1] |
Spatial Distribution Score [1] |
Overall Score [1] |
|||
|---|---|---|---|---|---|---|---|---|---|---|---|---|---|---|---|---|
| Benchmark | [-] | 15.1 | ||||||||||||||
| Calib | [-] | 13.8 | 14.5 | 11.7 | 14.5 | 16.4 | -0.117 | 10.8 | 0.0901 | 0.891 | 0.664 | 1.03 | 0.487 | 0.747 | ||
| Control | [-] | 13.5 | 14.1 | 11.5 | 14.5 | 16.4 | -0.481 | 11.1 | 0.190 | 0.887 | 0.654 | 1.02 | 0.504 | 0.744 |
Download Data |
Period Mean (original grids) [W/m2] |
Model Period Mean (intersection) [W/m2] |
Model Period Mean (complement) [W/m2] |
Benchmark Period Mean (intersection) [W/m2] |
Benchmark Period Mean (complement) [W/m2] |
Bias [W/m2] |
RMSE [W/m2] |
Phase Shift [months] |
Bias Score [1] |
RMSE Score [1] |
Seasonal Cycle Score [1] |
Spatial Distribution Score [1] |
Overall Score [1] |
|||
|---|---|---|---|---|---|---|---|---|---|---|---|---|---|---|---|---|
| Benchmark | [-] | 78.0 | ||||||||||||||
| Calib | [-] | 111. | 108. | 111. | 79.6 | 55.3 | 28.7 | 32.9 | 2.36 | 0.202 | 0.162 | 0.628 | 0.343 | 0.299 | ||
| Control | [-] | 98.2 | 95.8 | 98.6 | 79.6 | 55.3 | 16.2 | 26.8 | 2.39 | 0.241 | 0.186 | 0.627 | 0.339 | 0.315 |
Download Data |
Period Mean (original grids) [W/m2] |
Model Period Mean (intersection) [W/m2] |
Model Period Mean (complement) [W/m2] |
Benchmark Period Mean (intersection) [W/m2] |
Benchmark Period Mean (complement) [W/m2] |
Bias [W/m2] |
RMSE [W/m2] |
Phase Shift [months] |
Bias Score [1] |
RMSE Score [1] |
Seasonal Cycle Score [1] |
Spatial Distribution Score [1] |
Overall Score [1] |
|||
|---|---|---|---|---|---|---|---|---|---|---|---|---|---|---|---|---|
| Benchmark | [-] | 26.3 | ||||||||||||||
| Calib | [-] | 25.1 | 25.3 | 25.0 | 26.4 | 20.2 | -1.12 | 10.9 | 0.525 | 0.907 | 0.697 | 0.965 | 0.977 | 0.849 | ||
| Control | [-] | 24.8 | 24.7 | 27.2 | 26.4 | 20.2 | -1.73 | 12.1 | 0.640 | 0.878 | 0.676 | 0.957 | 0.990 | 0.835 |
Download Data |
Period Mean (original grids) [W/m2] |
Model Period Mean (intersection) [W/m2] |
Model Period Mean (complement) [W/m2] |
Benchmark Period Mean (intersection) [W/m2] |
Benchmark Period Mean (complement) [W/m2] |
Bias [W/m2] |
RMSE [W/m2] |
Phase Shift [months] |
Bias Score [1] |
RMSE Score [1] |
Seasonal Cycle Score [1] |
Spatial Distribution Score [1] |
Overall Score [1] |
|||
|---|---|---|---|---|---|---|---|---|---|---|---|---|---|---|---|---|
| Benchmark | [-] | 28.0 | ||||||||||||||
| Calib | [-] | 28.2 | 27.4 | 35.8 | 27.9 | 33.8 | -0.492 | 12.3 | 0.593 | 0.736 | 0.667 | 0.963 | 0.916 | 0.790 | ||
| Control | [-] | 25.3 | 24.4 | 34.2 | 27.9 | 33.8 | -3.51 | 12.4 | 0.582 | 0.684 | 0.679 | 0.964 | 0.914 | 0.784 |
Download Data |
Period Mean (original grids) [W/m2] |
Model Period Mean (intersection) [W/m2] |
Model Period Mean (complement) [W/m2] |
Benchmark Period Mean (intersection) [W/m2] |
Benchmark Period Mean (complement) [W/m2] |
Bias [W/m2] |
RMSE [W/m2] |
Phase Shift [months] |
Bias Score [1] |
RMSE Score [1] |
Seasonal Cycle Score [1] |
Spatial Distribution Score [1] |
Overall Score [1] |
|||
|---|---|---|---|---|---|---|---|---|---|---|---|---|---|---|---|---|
| Benchmark | [-] | 56.7 | ||||||||||||||
| Calib | [-] | 69.8 | 66.5 | 87.8 | 56.7 | 50.5 | 9.84 | 25.4 | 1.52 | 0.556 | 0.409 | 0.784 | 0.970 | 0.626 | ||
| Control | [-] | 59.6 | 56.7 | 77.4 | 56.7 | 50.5 | 0.0401 | 23.9 | 1.51 | 0.536 | 0.430 | 0.788 | 0.966 | 0.630 |
Download Data |
Period Mean (original grids) [W/m2] |
Model Period Mean (intersection) [W/m2] |
Model Period Mean (complement) [W/m2] |
Benchmark Period Mean (intersection) [W/m2] |
Benchmark Period Mean (complement) [W/m2] |
Bias [W/m2] |
RMSE [W/m2] |
Phase Shift [months] |
Bias Score [1] |
RMSE Score [1] |
Seasonal Cycle Score [1] |
Spatial Distribution Score [1] |
Overall Score [1] |
|||
|---|---|---|---|---|---|---|---|---|---|---|---|---|---|---|---|---|
| Benchmark | [-] | 15.8 | ||||||||||||||
| Calib | [-] | 14.2 | 15.4 | 8.75 | 15.8 | 8.38 | -0.456 | 12.7 | 0.208 | 0.892 | 0.603 | 0.998 | 0.749 | 0.769 | ||
| Control | [-] | 13.9 | 15.2 | 8.27 | 15.8 | 8.38 | -0.660 | 12.6 | 0.274 | 0.898 | 0.602 | 0.993 | 0.780 | 0.775 |
Download Data |
Period Mean (original grids) [W/m2] |
Model Period Mean (intersection) [W/m2] |
Model Period Mean (complement) [W/m2] |
Benchmark Period Mean (intersection) [W/m2] |
Benchmark Period Mean (complement) [W/m2] |
Bias [W/m2] |
RMSE [W/m2] |
Phase Shift [months] |
Bias Score [1] |
RMSE Score [1] |
Seasonal Cycle Score [1] |
Spatial Distribution Score [1] |
Overall Score [1] |
|||
|---|---|---|---|---|---|---|---|---|---|---|---|---|---|---|---|---|
| Benchmark | [-] | 27.6 | ||||||||||||||
| Calib | [-] | 37.6 | 34.2 | 46.9 | 27.5 | 36.6 | 6.71 | 14.8 | 0.736 | 0.651 | 0.522 | 0.925 | 0.928 | 0.709 | ||
| Control | [-] | 30.9 | 27.6 | 40.6 | 27.5 | 36.6 | 0.154 | 14.1 | 0.927 | 0.668 | 0.513 | 0.904 | 0.953 | 0.710 |
Download Data |
Period Mean (original grids) [W/m2] |
Model Period Mean (intersection) [W/m2] |
Model Period Mean (complement) [W/m2] |
Benchmark Period Mean (intersection) [W/m2] |
Benchmark Period Mean (complement) [W/m2] |
Bias [W/m2] |
RMSE [W/m2] |
Phase Shift [months] |
Bias Score [1] |
RMSE Score [1] |
Seasonal Cycle Score [1] |
Spatial Distribution Score [1] |
Overall Score [1] |
|||
|---|---|---|---|---|---|---|---|---|---|---|---|---|---|---|---|---|
| Benchmark | [-] | 31.6 | ||||||||||||||
| Calib | [-] | 34.4 | 34.5 | 34.1 | 31.7 | 27.7 | 2.83 | 12.8 | 0.389 | 0.825 | 0.683 | 0.975 | 0.791 | 0.792 | ||
| Control | [-] | 32.7 | 32.9 | 32.2 | 31.7 | 27.7 | 1.23 | 13.7 | 0.386 | 0.778 | 0.677 | 0.974 | 0.651 | 0.751 |
Download Data |
Period Mean (original grids) [W/m2] |
Model Period Mean (intersection) [W/m2] |
Model Period Mean (complement) [W/m2] |
Benchmark Period Mean (intersection) [W/m2] |
Benchmark Period Mean (complement) [W/m2] |
Bias [W/m2] |
RMSE [W/m2] |
Phase Shift [months] |
Bias Score [1] |
RMSE Score [1] |
Seasonal Cycle Score [1] |
Spatial Distribution Score [1] |
Overall Score [1] |
|||
|---|---|---|---|---|---|---|---|---|---|---|---|---|---|---|---|---|
| Benchmark | [-] | 39.2 | ||||||||||||||
| Calib | [-] | 41.4 | 43.7 | 37.4 | 39.3 | 29.3 | 4.43 | 15.9 | 0.931 | 0.592 | 0.463 | 0.852 | 0.968 | 0.667 | ||
| Control | [-] | 36.1 | 37.5 | 33.7 | 39.3 | 29.3 | -1.75 | 15.6 | 0.972 | 0.556 | 0.470 | 0.841 | 0.963 | 0.660 |
Download Data |
Period Mean (original grids) [W/m2] |
Model Period Mean (intersection) [W/m2] |
Model Period Mean (complement) [W/m2] |
Benchmark Period Mean (intersection) [W/m2] |
Benchmark Period Mean (complement) [W/m2] |
Bias [W/m2] |
RMSE [W/m2] |
Phase Shift [months] |
Bias Score [1] |
RMSE Score [1] |
Seasonal Cycle Score [1] |
Spatial Distribution Score [1] |
Overall Score [1] |
|||
|---|---|---|---|---|---|---|---|---|---|---|---|---|---|---|---|---|
| Benchmark | [-] | 8.27 | ||||||||||||||
| Calib | [-] | 8.74 | 13.2 | 4.41 | 8.02 | 19.3 | 5.20 | 9.92 | 1.43 | 0.553 | 0.427 | 0.899 | 0.920 | 0.645 | ||
| Control | [-] | 7.05 | 10.9 | 3.34 | 8.02 | 19.3 | 2.84 | 8.29 | 1.43 | 0.571 | 0.449 | 0.898 | 0.912 | 0.656 |
Download Data |
Period Mean (original grids) [W/m2] |
Model Period Mean (intersection) [W/m2] |
Model Period Mean (complement) [W/m2] |
Benchmark Period Mean (intersection) [W/m2] |
Benchmark Period Mean (complement) [W/m2] |
Bias [W/m2] |
RMSE [W/m2] |
Phase Shift [months] |
Bias Score [1] |
RMSE Score [1] |
Seasonal Cycle Score [1] |
Spatial Distribution Score [1] |
Overall Score [1] |
|||
|---|---|---|---|---|---|---|---|---|---|---|---|---|---|---|---|---|
| Benchmark | [-] | 13.9 | ||||||||||||||
| Calib | [-] | 13.4 | 14.4 | 10.1 | 13.9 | 8.40 | 0.493 | 12.1 | 0.342 | 0.824 | 0.597 | 0.986 | 0.794 | 0.760 | ||
| Control | [-] | 12.4 | 13.3 | 9.82 | 13.9 | 8.40 | -0.547 | 10.9 | 0.208 | 0.830 | 0.625 | 0.998 | 0.780 | 0.772 |
Download Data |
Period Mean (original grids) [W/m2] |
Model Period Mean (intersection) [W/m2] |
Model Period Mean (complement) [W/m2] |
Benchmark Period Mean (intersection) [W/m2] |
Benchmark Period Mean (complement) [W/m2] |
Bias [W/m2] |
RMSE [W/m2] |
Phase Shift [months] |
Bias Score [1] |
RMSE Score [1] |
Seasonal Cycle Score [1] |
Spatial Distribution Score [1] |
Overall Score [1] |
|||
|---|---|---|---|---|---|---|---|---|---|---|---|---|---|---|---|---|
| Benchmark | [-] | 50.2 | ||||||||||||||
| Calib | [-] | 72.1 | 66.3 | 79.5 | 50.3 | 44.5 | 16.0 | 27.0 | 1.36 | 0.376 | 0.366 | 0.786 | 0.949 | 0.568 | ||
| Control | [-] | 60.1 | 54.7 | 67.0 | 50.3 | 44.5 | 4.39 | 23.7 | 1.40 | 0.407 | 0.358 | 0.784 | 0.957 | 0.573 |
Download Data |
Period Mean (original grids) [W/m2] |
Model Period Mean (intersection) [W/m2] |
Model Period Mean (complement) [W/m2] |
Benchmark Period Mean (intersection) [W/m2] |
Benchmark Period Mean (complement) [W/m2] |
Bias [W/m2] |
RMSE [W/m2] |
Phase Shift [months] |
Bias Score [1] |
RMSE Score [1] |
Seasonal Cycle Score [1] |
Spatial Distribution Score [1] |
Overall Score [1] |
|||
|---|---|---|---|---|---|---|---|---|---|---|---|---|---|---|---|---|
| Benchmark | [-] | 49.4 | ||||||||||||||
| Calib | [-] | 57.1 | 54.0 | 65.6 | 49.4 | 4.59 | 14.2 | 0.210 | 0.834 | 0.729 | 0.983 | 0.926 | 0.840 | |||
| Control | [-] | 53.3 | 50.0 | 61.9 | 49.4 | 0.580 | 13.9 | 0.292 | 0.830 | 0.727 | 0.977 | 0.947 | 0.841 |
Download Data |
Period Mean (original grids) [W/m2] |
Model Period Mean (intersection) [W/m2] |
Model Period Mean (complement) [W/m2] |
Benchmark Period Mean (intersection) [W/m2] |
Benchmark Period Mean (complement) [W/m2] |
Bias [W/m2] |
RMSE [W/m2] |
Phase Shift [months] |
Bias Score [1] |
RMSE Score [1] |
Seasonal Cycle Score [1] |
Spatial Distribution Score [1] |
Overall Score [1] |
|||
|---|---|---|---|---|---|---|---|---|---|---|---|---|---|---|---|---|
| Benchmark | [-] | 24.9 | ||||||||||||||
| Calib | [-] | 29.0 | 29.1 | 29.3 | 24.9 | 15.8 | 4.23 | 12.7 | 0.0806 | 0.812 | 0.643 | 0.995 | 0.974 | 0.813 | ||
| Control | [-] | 28.5 | 28.7 | 32.6 | 24.9 | 15.8 | 3.80 | 12.6 | 0.254 | 0.804 | 0.648 | 0.984 | 0.977 | 0.813 |
Download Data |
Period Mean (original grids) [W/m2] |
Model Period Mean (intersection) [W/m2] |
Model Period Mean (complement) [W/m2] |
Benchmark Period Mean (intersection) [W/m2] |
Benchmark Period Mean (complement) [W/m2] |
Bias [W/m2] |
RMSE [W/m2] |
Phase Shift [months] |
Bias Score [1] |
RMSE Score [1] |
Seasonal Cycle Score [1] |
Spatial Distribution Score [1] |
Overall Score [1] |
|||
|---|---|---|---|---|---|---|---|---|---|---|---|---|---|---|---|---|
| Benchmark | [-] | 26.2 | ||||||||||||||
| Calib | [-] | 27.1 | 26.6 | 31.7 | 26.2 | 0.492 | 12.5 | 0.614 | 0.686 | 0.570 | 0.946 | 0.970 | 0.748 | |||
| Control | [-] | 22.8 | 22.7 | 31.7 | 26.2 | -3.47 | 12.1 | 0.661 | 0.684 | 0.580 | 0.934 | 0.959 | 0.747 |
Download Data |
Period Mean (original grids) [W/m2] |
Model Period Mean (intersection) [W/m2] |
Model Period Mean (complement) [W/m2] |
Benchmark Period Mean (intersection) [W/m2] |
Benchmark Period Mean (complement) [W/m2] |
Bias [W/m2] |
RMSE [W/m2] |
Phase Shift [months] |
Bias Score [1] |
RMSE Score [1] |
Seasonal Cycle Score [1] |
Spatial Distribution Score [1] |
Overall Score [1] |
|||
|---|---|---|---|---|---|---|---|---|---|---|---|---|---|---|---|---|
| Benchmark | [-] | 90.0 | ||||||||||||||
| Calib | [-] | 100. | 97.2 | 97.6 | 90.1 | 47.9 | 7.05 | 17.8 | 1.82 | 0.367 | 0.193 | 0.749 | 0.991 | 0.499 | ||
| Control | [-] | 86.4 | 83.5 | 84.2 | 90.1 | 47.9 | -6.63 | 17.2 | 1.96 | 0.302 | 0.231 | 0.718 | 0.991 | 0.494 |
Download Data |
Period Mean (original grids) [W/m2] |
Model Period Mean (intersection) [W/m2] |
Model Period Mean (complement) [W/m2] |
Benchmark Period Mean (intersection) [W/m2] |
Benchmark Period Mean (complement) [W/m2] |
Bias [W/m2] |
RMSE [W/m2] |
Phase Shift [months] |
Bias Score [1] |
RMSE Score [1] |
Seasonal Cycle Score [1] |
Spatial Distribution Score [1] |
Overall Score [1] |
|||
|---|---|---|---|---|---|---|---|---|---|---|---|---|---|---|---|---|
| Benchmark | [-] | 69.7 | ||||||||||||||
| Calib | [-] | 69.9 | 69.1 | 71.0 | 69.7 | 6.95 | -0.617 | 18.4 | 0.994 | 0.665 | 0.521 | 0.888 | 0.987 | 0.717 | ||
| Control | [-] | 59.0 | 57.6 | 61.1 | 69.7 | 6.95 | -12.1 | 22.0 | 1.01 | 0.553 | 0.514 | 0.875 | 0.981 | 0.688 |
Download Data |
Period Mean (original grids) [W/m2] |
Model Period Mean (intersection) [W/m2] |
Model Period Mean (complement) [W/m2] |
Benchmark Period Mean (intersection) [W/m2] |
Benchmark Period Mean (complement) [W/m2] |
Bias [W/m2] |
RMSE [W/m2] |
Phase Shift [months] |
Bias Score [1] |
RMSE Score [1] |
Seasonal Cycle Score [1] |
Spatial Distribution Score [1] |
Overall Score [1] |
|||
|---|---|---|---|---|---|---|---|---|---|---|---|---|---|---|---|---|
| Benchmark | [-] | 22.8 | ||||||||||||||
| Calib | [-] | 29.4 | 26.8 | 23.4 | 22.9 | 11.1 | 3.89 | 17.1 | 1.38 | 0.400 | 0.431 | 0.850 | 0.894 | 0.601 | ||
| Control | [-] | 24.5 | 22.4 | 19.6 | 22.9 | 11.1 | -0.488 | 15.2 | 1.19 | 0.415 | 0.458 | 0.858 | 0.914 | 0.621 |
Temporally integrated period mean