Mean State
Download Data |
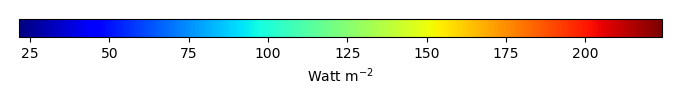
Period Mean (original grids) [Watt m-2] |
Period Mean (original grids) northamericaalaskanortherncanada [Watt m-2] |
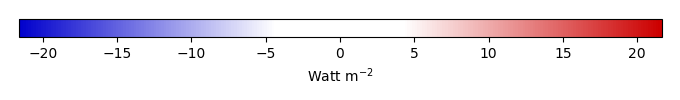
Bias [Watt m-2] |
Bias northamericaalaskanortherncanada [Watt m-2] |
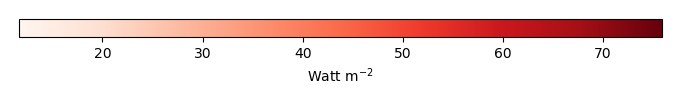
RMSE [Watt m-2] |
RMSE northamericaalaskanortherncanada [Watt m-2] |
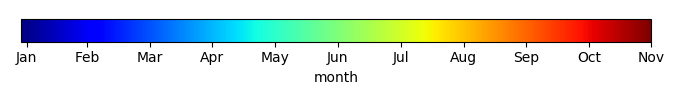
Phase Shift [months] |
Phase Shift northamericaalaskanortherncanada [months] |
Bias Score [1] |
Bias Score northamericaalaskanortherncanada [1] |
RMSE Score [1] |
RMSE Score northamericaalaskanortherncanada [1] |
Seasonal Cycle Score [1] |
Seasonal Cycle Score northamericaalaskanortherncanada [1] |
Interannual Variability Score [1] |
Interannual Variability Score northamericaalaskanortherncanada [1] |
Overall Score [1] |
|||
|---|---|---|---|---|---|---|---|---|---|---|---|---|---|---|---|---|---|---|---|---|
| Benchmark | [-] | 230. | ||||||||||||||||||
| Calib | [-] | 185. | -20.0 | 69.2 | 1.02 | 0.190 | 0.398 | 0.933 | 0.241 | 0.432 | ||||||||||
| Control | [-] | 184. | -20.4 | 69.2 | 1.02 | 0.189 | 0.398 | 0.933 | 0.241 | 0.432 |
Download Data |
Period Mean (original grids) [Watt m-2] |
Period Mean (original grids) northamericaalaskanortherncanada [Watt m-2] |
Bias [Watt m-2] |
Bias northamericaalaskanortherncanada [Watt m-2] |
RMSE [Watt m-2] |
RMSE northamericaalaskanortherncanada [Watt m-2] |
Phase Shift [months] |
Phase Shift northamericaalaskanortherncanada [months] |
Bias Score [1] |
Bias Score northamericaalaskanortherncanada [1] |
RMSE Score [1] |
RMSE Score northamericaalaskanortherncanada [1] |
Seasonal Cycle Score [1] |
Seasonal Cycle Score northamericaalaskanortherncanada [1] |
Interannual Variability Score [1] |
Interannual Variability Score northamericaalaskanortherncanada [1] |
Overall Score [1] |
|||
|---|---|---|---|---|---|---|---|---|---|---|---|---|---|---|---|---|---|---|---|---|
| Benchmark | [-] | 79.7 | ||||||||||||||||||
| Calib | [-] | 117. | 33.7 | 38.2 | 1.02 | 0.143 | 0.736 | 0.933 | 0.204 | 0.550 | ||||||||||
| Control | [-] | 117. | 33.8 | 38.2 | 1.02 | 0.142 | 0.736 | 0.933 | 0.204 | 0.550 |
Download Data |
Period Mean (original grids) [Watt m-2] |
Period Mean (original grids) northamericaalaskanortherncanada [Watt m-2] |
Bias [Watt m-2] |
Bias northamericaalaskanortherncanada [Watt m-2] |
RMSE [Watt m-2] |
RMSE northamericaalaskanortherncanada [Watt m-2] |
Phase Shift [months] |
Phase Shift northamericaalaskanortherncanada [months] |
Bias Score [1] |
Bias Score northamericaalaskanortherncanada [1] |
RMSE Score [1] |
RMSE Score northamericaalaskanortherncanada [1] |
Seasonal Cycle Score [1] |
Seasonal Cycle Score northamericaalaskanortherncanada [1] |
Interannual Variability Score [1] |
Interannual Variability Score northamericaalaskanortherncanada [1] |
Overall Score [1] |
|||
|---|---|---|---|---|---|---|---|---|---|---|---|---|---|---|---|---|---|---|---|---|
| Benchmark | [-] | 142. | nan | |||||||||||||||||
| Calib | [-] | 133. | 50.2 | 2.88 | nan | 25.0 | nan | 0.704 | nan | 0.254 | 0.00 | 0.758 | nan | 0.953 | nan | 0.350 | 0.00 | 0.615 | ||
| Control | [-] | 133. | 50.1 | 2.79 | nan | 25.1 | nan | 0.704 | nan | 0.252 | 0.00 | 0.760 | nan | 0.953 | nan | 0.351 | 0.00 | 0.615 |
Download Data |
Period Mean (original grids) [Watt m-2] |
Period Mean (original grids) northamericaalaskanortherncanada [Watt m-2] |
Bias [Watt m-2] |
Bias northamericaalaskanortherncanada [Watt m-2] |
RMSE [Watt m-2] |
RMSE northamericaalaskanortherncanada [Watt m-2] |
Phase Shift [months] |
Phase Shift northamericaalaskanortherncanada [months] |
Bias Score [1] |
Bias Score northamericaalaskanortherncanada [1] |
RMSE Score [1] |
RMSE Score northamericaalaskanortherncanada [1] |
Seasonal Cycle Score [1] |
Seasonal Cycle Score northamericaalaskanortherncanada [1] |
Interannual Variability Score [1] |
Interannual Variability Score northamericaalaskanortherncanada [1] |
Overall Score [1] |
|||
|---|---|---|---|---|---|---|---|---|---|---|---|---|---|---|---|---|---|---|---|---|
| Benchmark | [-] | 179. | ||||||||||||||||||
| Calib | [-] | 162. | -21.5 | 23.9 | 0.00 | 0.199 | 0.774 | 1.00 | 0.491 | 0.648 | ||||||||||
| Control | [-] | 162. | -21.8 | 24.2 | 0.00 | 0.197 | 0.772 | 1.00 | 0.488 | 0.646 |
Download Data |
Period Mean (original grids) [Watt m-2] |
Period Mean (original grids) northamericaalaskanortherncanada [Watt m-2] |
Bias [Watt m-2] |
Bias northamericaalaskanortherncanada [Watt m-2] |
RMSE [Watt m-2] |
RMSE northamericaalaskanortherncanada [Watt m-2] |
Phase Shift [months] |
Phase Shift northamericaalaskanortherncanada [months] |
Bias Score [1] |
Bias Score northamericaalaskanortherncanada [1] |
RMSE Score [1] |
RMSE Score northamericaalaskanortherncanada [1] |
Seasonal Cycle Score [1] |
Seasonal Cycle Score northamericaalaskanortherncanada [1] |
Interannual Variability Score [1] |
Interannual Variability Score northamericaalaskanortherncanada [1] |
Overall Score [1] |
|||
|---|---|---|---|---|---|---|---|---|---|---|---|---|---|---|---|---|---|---|---|---|
| Benchmark | [-] | 135. | ||||||||||||||||||
| Calib | [-] | 145. | 5.33 | 18.8 | 0.610 | 0.590 | 0.797 | 0.960 | 0.669 | 0.762 | ||||||||||
| Control | [-] | 145. | 5.74 | 18.9 | 0.610 | 0.586 | 0.800 | 0.960 | 0.672 | 0.763 |
Download Data |
Period Mean (original grids) [Watt m-2] |
Period Mean (original grids) northamericaalaskanortherncanada [Watt m-2] |
Bias [Watt m-2] |
Bias northamericaalaskanortherncanada [Watt m-2] |
RMSE [Watt m-2] |
RMSE northamericaalaskanortherncanada [Watt m-2] |
Phase Shift [months] |
Phase Shift northamericaalaskanortherncanada [months] |
Bias Score [1] |
Bias Score northamericaalaskanortherncanada [1] |
RMSE Score [1] |
RMSE Score northamericaalaskanortherncanada [1] |
Seasonal Cycle Score [1] |
Seasonal Cycle Score northamericaalaskanortherncanada [1] |
Interannual Variability Score [1] |
Interannual Variability Score northamericaalaskanortherncanada [1] |
Overall Score [1] |
|||
|---|---|---|---|---|---|---|---|---|---|---|---|---|---|---|---|---|---|---|---|---|
| Benchmark | [-] | 151. | ||||||||||||||||||
| Calib | [-] | 147. | -3.77 | 15.3 | 0.762 | 0.946 | 0.807 | 0.949 | 0.940 | 0.890 | ||||||||||
| Control | [-] | 146. | -4.47 | 15.4 | 0.762 | 0.936 | 0.808 | 0.949 | 0.949 | 0.890 |
Temporally integrated period mean