Mean State
Download Data |
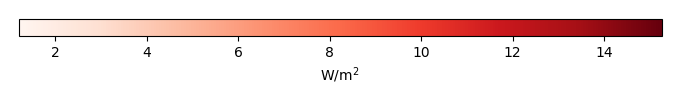
Period Mean (original grids) [W/m2] |
Model Period Mean (intersection) [W/m2] |
Model Period Mean (complement) [W/m2] |
Benchmark Period Mean (intersection) [W/m2] |
Benchmark Period Mean (complement) [W/m2] |
Bias [W/m2] |
RMSE [W/m2] |
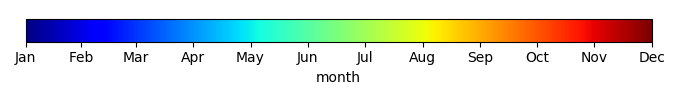
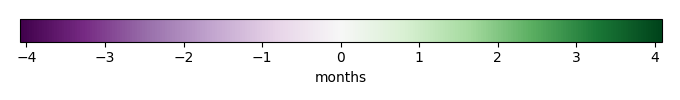
Phase Shift [months] |
Bias Score [1] |
RMSE Score [1] |
Seasonal Cycle Score [1] |
Spatial Distribution Score [1] |
Interannual Variability Score [1] |
Overall Score [1] |
|||
|---|---|---|---|---|---|---|---|---|---|---|---|---|---|---|---|---|---|
| Benchmark | [-] | 455. | |||||||||||||||
| Calib | [-] | 459. | 460. | 455. | 465. | 4.31 | 14.0 | 1.90 | 0.429 | 0.378 | 0.722 | 0.990 | 0.701 | 0.600 | |||
| Control | [-] | 462. | 462. | 455. | 465. | 6.58 | 14.6 | 1.86 | 0.393 | 0.384 | 0.730 | 0.991 | 0.700 | 0.597 |
Download Data |
Period Mean (original grids) [W/m2] |
Model Period Mean (intersection) [W/m2] |
Model Period Mean (complement) [W/m2] |
Benchmark Period Mean (intersection) [W/m2] |
Benchmark Period Mean (complement) [W/m2] |
Bias [W/m2] |
RMSE [W/m2] |
Phase Shift [months] |
Bias Score [1] |
RMSE Score [1] |
Seasonal Cycle Score [1] |
Spatial Distribution Score [1] |
Interannual Variability Score [1] |
Overall Score [1] |
|||
|---|---|---|---|---|---|---|---|---|---|---|---|---|---|---|---|---|---|
| Benchmark | [-] | 469. | |||||||||||||||
| Calib | [-] | 476. | 477. | 469. | 445. | 7.64 | 19.9 | 0.818 | 0.572 | 0.506 | 0.916 | 0.919 | 0.699 | 0.686 | |||
| Control | [-] | 479. | 479. | 469. | 445. | 10.5 | 20.9 | 0.802 | 0.533 | 0.516 | 0.915 | 0.917 | 0.706 | 0.684 |
Download Data |
Period Mean (original grids) [W/m2] |
Model Period Mean (intersection) [W/m2] |
Model Period Mean (complement) [W/m2] |
Benchmark Period Mean (intersection) [W/m2] |
Benchmark Period Mean (complement) [W/m2] |
Bias [W/m2] |
RMSE [W/m2] |
Phase Shift [months] |
Bias Score [1] |
RMSE Score [1] |
Seasonal Cycle Score [1] |
Spatial Distribution Score [1] |
Interannual Variability Score [1] |
Overall Score [1] |
|||
|---|---|---|---|---|---|---|---|---|---|---|---|---|---|---|---|---|---|
| Benchmark | [-] | 442. | |||||||||||||||
| Calib | [-] | 447. | 446. | 442. | 458. | 4.53 | 17.4 | 1.40 | 0.590 | 0.464 | 0.819 | 0.981 | 0.712 | 0.672 | |||
| Control | [-] | 449. | 449. | 442. | 458. | 6.92 | 17.9 | 1.25 | 0.552 | 0.472 | 0.842 | 0.987 | 0.732 | 0.676 |
Download Data |
Period Mean (original grids) [W/m2] |
Model Period Mean (intersection) [W/m2] |
Model Period Mean (complement) [W/m2] |
Benchmark Period Mean (intersection) [W/m2] |
Benchmark Period Mean (complement) [W/m2] |
Bias [W/m2] |
RMSE [W/m2] |
Phase Shift [months] |
Bias Score [1] |
RMSE Score [1] |
Seasonal Cycle Score [1] |
Spatial Distribution Score [1] |
Interannual Variability Score [1] |
Overall Score [1] |
|||
|---|---|---|---|---|---|---|---|---|---|---|---|---|---|---|---|---|---|
| Benchmark | [-] | 278. | |||||||||||||||
| Calib | [-] | 278. | 281. | 277. | 299. | 2.98 | 18.0 | 0.190 | 0.866 | 0.795 | 0.984 | 0.999 | 0.726 | 0.861 | |||
| Control | [-] | 278. | 280. | 277. | 299. | 2.87 | 18.0 | 0.190 | 0.866 | 0.794 | 0.984 | 0.999 | 0.731 | 0.862 |
Download Data |
Period Mean (original grids) [W/m2] |
Model Period Mean (intersection) [W/m2] |
Model Period Mean (complement) [W/m2] |
Benchmark Period Mean (intersection) [W/m2] |
Benchmark Period Mean (complement) [W/m2] |
Bias [W/m2] |
RMSE [W/m2] |
Phase Shift [months] |
Bias Score [1] |
RMSE Score [1] |
Seasonal Cycle Score [1] |
Spatial Distribution Score [1] |
Interannual Variability Score [1] |
Overall Score [1] |
|||
|---|---|---|---|---|---|---|---|---|---|---|---|---|---|---|---|---|---|
| Benchmark | [-] | 459. | |||||||||||||||
| Calib | [-] | 458. | 459. | 458. | 464. | 0.411 | 14.3 | 2.02 | 0.217 | 0.409 | 0.683 | 0.762 | 0.697 | 0.529 | |||
| Control | [-] | 459. | 460. | 458. | 464. | 1.63 | 14.4 | 2.02 | 0.210 | 0.409 | 0.683 | 0.764 | 0.702 | 0.530 |
Download Data |
Period Mean (original grids) [W/m2] |
Model Period Mean (intersection) [W/m2] |
Model Period Mean (complement) [W/m2] |
Benchmark Period Mean (intersection) [W/m2] |
Benchmark Period Mean (complement) [W/m2] |
Bias [W/m2] |
RMSE [W/m2] |
Phase Shift [months] |
Bias Score [1] |
RMSE Score [1] |
Seasonal Cycle Score [1] |
Spatial Distribution Score [1] |
Interannual Variability Score [1] |
Overall Score [1] |
|||
|---|---|---|---|---|---|---|---|---|---|---|---|---|---|---|---|---|---|
| Benchmark | [-] | 313. | |||||||||||||||
| Calib | [-] | 314. | 316. | 313. | 334. | 3.78 | 12.4 | 0.140 | 0.907 | 0.877 | 0.991 | 1.00 | 0.867 | 0.920 | |||
| Control | [-] | 313. | 316. | 313. | 334. | 3.36 | 12.1 | 0.163 | 0.908 | 0.878 | 0.989 | 0.999 | 0.871 | 0.921 |
Download Data |
Period Mean (original grids) [W/m2] |
Model Period Mean (intersection) [W/m2] |
Model Period Mean (complement) [W/m2] |
Benchmark Period Mean (intersection) [W/m2] |
Benchmark Period Mean (complement) [W/m2] |
Bias [W/m2] |
RMSE [W/m2] |
Phase Shift [months] |
Bias Score [1] |
RMSE Score [1] |
Seasonal Cycle Score [1] |
Spatial Distribution Score [1] |
Interannual Variability Score [1] |
Overall Score [1] |
|||
|---|---|---|---|---|---|---|---|---|---|---|---|---|---|---|---|---|---|
| Benchmark | [-] | 366. | |||||||||||||||
| Calib | [-] | 367. | 368. | 365. | 391. | 2.79 | 17.4 | 0.227 | 0.807 | 0.817 | 0.983 | 0.997 | 0.779 | 0.867 | |||
| Control | [-] | 368. | 368. | 365. | 391. | 3.22 | 17.4 | 0.227 | 0.806 | 0.819 | 0.983 | 0.997 | 0.785 | 0.868 |
Download Data |
Period Mean (original grids) [W/m2] |
Model Period Mean (intersection) [W/m2] |
Model Period Mean (complement) [W/m2] |
Benchmark Period Mean (intersection) [W/m2] |
Benchmark Period Mean (complement) [W/m2] |
Bias [W/m2] |
RMSE [W/m2] |
Phase Shift [months] |
Bias Score [1] |
RMSE Score [1] |
Seasonal Cycle Score [1] |
Spatial Distribution Score [1] |
Interannual Variability Score [1] |
Overall Score [1] |
|||
|---|---|---|---|---|---|---|---|---|---|---|---|---|---|---|---|---|---|
| Benchmark | [-] | 449. | |||||||||||||||
| Calib | [-] | 456. | 453. | 448. | 467. | 4.72 | 20.5 | 0.821 | 0.555 | 0.537 | 0.916 | 0.966 | 0.643 | 0.692 | |||
| Control | [-] | 458. | 455. | 448. | 467. | 6.74 | 21.1 | 0.812 | 0.546 | 0.536 | 0.918 | 0.972 | 0.643 | 0.692 |
Download Data |
Period Mean (original grids) [W/m2] |
Model Period Mean (intersection) [W/m2] |
Model Period Mean (complement) [W/m2] |
Benchmark Period Mean (intersection) [W/m2] |
Benchmark Period Mean (complement) [W/m2] |
Bias [W/m2] |
RMSE [W/m2] |
Phase Shift [months] |
Bias Score [1] |
RMSE Score [1] |
Seasonal Cycle Score [1] |
Spatial Distribution Score [1] |
Interannual Variability Score [1] |
Overall Score [1] |
|||
|---|---|---|---|---|---|---|---|---|---|---|---|---|---|---|---|---|---|
| Benchmark | [-] | 279. | |||||||||||||||
| Calib | [-] | 283. | 284. | 279. | 301. | 5.68 | 15.2 | 0.222 | 0.887 | 0.819 | 0.981 | 0.999 | 0.742 | 0.875 | |||
| Control | [-] | 282. | 284. | 279. | 301. | 5.55 | 15.1 | 0.221 | 0.888 | 0.820 | 0.981 | 1.00 | 0.744 | 0.875 |
Download Data |
Period Mean (original grids) [W/m2] |
Model Period Mean (intersection) [W/m2] |
Model Period Mean (complement) [W/m2] |
Benchmark Period Mean (intersection) [W/m2] |
Benchmark Period Mean (complement) [W/m2] |
Bias [W/m2] |
RMSE [W/m2] |
Phase Shift [months] |
Bias Score [1] |
RMSE Score [1] |
Seasonal Cycle Score [1] |
Spatial Distribution Score [1] |
Interannual Variability Score [1] |
Overall Score [1] |
|||
|---|---|---|---|---|---|---|---|---|---|---|---|---|---|---|---|---|---|
| Benchmark | [-] | 442. | |||||||||||||||
| Calib | [-] | 441. | 443. | 443. | 431. | 0.271 | 15.2 | 0.552 | 0.771 | 0.663 | 0.944 | 0.999 | 0.722 | 0.794 | |||
| Control | [-] | 443. | 444. | 443. | 431. | 1.67 | 15.1 | 0.574 | 0.764 | 0.664 | 0.941 | 1.00 | 0.728 | 0.793 |
Download Data |
Period Mean (original grids) [W/m2] |
Model Period Mean (intersection) [W/m2] |
Model Period Mean (complement) [W/m2] |
Benchmark Period Mean (intersection) [W/m2] |
Benchmark Period Mean (complement) [W/m2] |
Bias [W/m2] |
RMSE [W/m2] |
Phase Shift [months] |
Bias Score [1] |
RMSE Score [1] |
Seasonal Cycle Score [1] |
Spatial Distribution Score [1] |
Interannual Variability Score [1] |
Overall Score [1] |
|||
|---|---|---|---|---|---|---|---|---|---|---|---|---|---|---|---|---|---|
| Benchmark | [-] | 370. | |||||||||||||||
| Calib | [-] | 364. | 367. | 368. | 404. | -0.592 | 14.0 | 0.234 | 0.800 | 0.756 | 0.984 | 0.997 | 0.795 | 0.848 | |||
| Control | [-] | 364. | 368. | 368. | 404. | -0.336 | 13.9 | 0.248 | 0.803 | 0.757 | 0.983 | 0.999 | 0.797 | 0.849 |
Download Data |
Period Mean (original grids) [W/m2] |
Model Period Mean (intersection) [W/m2] |
Model Period Mean (complement) [W/m2] |
Benchmark Period Mean (intersection) [W/m2] |
Benchmark Period Mean (complement) [W/m2] |
Bias [W/m2] |
RMSE [W/m2] |
Phase Shift [months] |
Bias Score [1] |
RMSE Score [1] |
Seasonal Cycle Score [1] |
Spatial Distribution Score [1] |
Interannual Variability Score [1] |
Overall Score [1] |
|||
|---|---|---|---|---|---|---|---|---|---|---|---|---|---|---|---|---|---|
| Benchmark | [-] | 398. | |||||||||||||||
| Calib | [-] | 386. | 386. | 382. | 409. | 3.38 | 16.8 | 0.685 | 0.669 | 0.640 | 0.919 | 0.999 | 0.749 | 0.769 | |||
| Control | [-] | 387. | 387. | 382. | 409. | 4.18 | 16.9 | 0.683 | 0.661 | 0.641 | 0.919 | 0.999 | 0.752 | 0.769 |
Download Data |
Period Mean (original grids) [W/m2] |
Model Period Mean (intersection) [W/m2] |
Model Period Mean (complement) [W/m2] |
Benchmark Period Mean (intersection) [W/m2] |
Benchmark Period Mean (complement) [W/m2] |
Bias [W/m2] |
RMSE [W/m2] |
Phase Shift [months] |
Bias Score [1] |
RMSE Score [1] |
Seasonal Cycle Score [1] |
Spatial Distribution Score [1] |
Interannual Variability Score [1] |
Overall Score [1] |
|||
|---|---|---|---|---|---|---|---|---|---|---|---|---|---|---|---|---|---|
| Benchmark | [-] | 450. | |||||||||||||||
| Calib | [-] | 449. | 451. | 451. | 425. | -0.129 | 17.5 | 0.415 | 0.800 | 0.742 | 0.964 | 0.998 | 0.719 | 0.827 | |||
| Control | [-] | 450. | 451. | 451. | 425. | 0.130 | 17.5 | 0.423 | 0.799 | 0.742 | 0.963 | 0.997 | 0.720 | 0.827 |
Download Data |
Period Mean (original grids) [W/m2] |
Model Period Mean (intersection) [W/m2] |
Model Period Mean (complement) [W/m2] |
Benchmark Period Mean (intersection) [W/m2] |
Benchmark Period Mean (complement) [W/m2] |
Bias [W/m2] |
RMSE [W/m2] |
Phase Shift [months] |
Bias Score [1] |
RMSE Score [1] |
Seasonal Cycle Score [1] |
Spatial Distribution Score [1] |
Interannual Variability Score [1] |
Overall Score [1] |
|||
|---|---|---|---|---|---|---|---|---|---|---|---|---|---|---|---|---|---|
| Benchmark | [-] | 281. | |||||||||||||||
| Calib | [-] | 288. | 290. | 281. | 289. | 9.09 | 19.1 | 0.300 | 0.844 | 0.792 | 0.976 | 0.998 | 0.783 | 0.864 | |||
| Control | [-] | 288. | 290. | 281. | 289. | 9.09 | 18.9 | 0.313 | 0.845 | 0.793 | 0.975 | 0.997 | 0.786 | 0.865 |
Download Data |
Period Mean (original grids) [W/m2] |
Model Period Mean (intersection) [W/m2] |
Model Period Mean (complement) [W/m2] |
Benchmark Period Mean (intersection) [W/m2] |
Benchmark Period Mean (complement) [W/m2] |
Bias [W/m2] |
RMSE [W/m2] |
Phase Shift [months] |
Bias Score [1] |
RMSE Score [1] |
Seasonal Cycle Score [1] |
Spatial Distribution Score [1] |
Interannual Variability Score [1] |
Overall Score [1] |
|||
|---|---|---|---|---|---|---|---|---|---|---|---|---|---|---|---|---|---|
| Benchmark | [-] | 444. | |||||||||||||||
| Calib | [-] | 452. | 452. | 442. | 460. | 9.35 | 19.4 | 1.22 | 0.481 | 0.562 | 0.834 | 0.819 | 0.724 | 0.664 | |||
| Control | [-] | 454. | 454. | 442. | 460. | 11.2 | 20.4 | 1.26 | 0.458 | 0.558 | 0.828 | 0.819 | 0.731 | 0.659 |
Download Data |
Period Mean (original grids) [W/m2] |
Model Period Mean (intersection) [W/m2] |
Model Period Mean (complement) [W/m2] |
Benchmark Period Mean (intersection) [W/m2] |
Benchmark Period Mean (complement) [W/m2] |
Bias [W/m2] |
RMSE [W/m2] |
Phase Shift [months] |
Bias Score [1] |
RMSE Score [1] |
Seasonal Cycle Score [1] |
Spatial Distribution Score [1] |
Interannual Variability Score [1] |
Overall Score [1] |
|||
|---|---|---|---|---|---|---|---|---|---|---|---|---|---|---|---|---|---|
| Benchmark | [-] | 385. | |||||||||||||||
| Calib | [-] | 393. | 392. | 385. | 7.43 | 13.6 | 0.200 | 0.814 | 0.845 | 0.987 | 0.995 | 0.867 | 0.892 | ||||
| Control | [-] | 394. | 393. | 385. | 8.17 | 14.0 | 0.203 | 0.806 | 0.847 | 0.986 | 0.996 | 0.873 | 0.892 |
Download Data |
Period Mean (original grids) [W/m2] |
Model Period Mean (intersection) [W/m2] |
Model Period Mean (complement) [W/m2] |
Benchmark Period Mean (intersection) [W/m2] |
Benchmark Period Mean (complement) [W/m2] |
Bias [W/m2] |
RMSE [W/m2] |
Phase Shift [months] |
Bias Score [1] |
RMSE Score [1] |
Seasonal Cycle Score [1] |
Spatial Distribution Score [1] |
Interannual Variability Score [1] |
Overall Score [1] |
|||
|---|---|---|---|---|---|---|---|---|---|---|---|---|---|---|---|---|---|
| Benchmark | [-] | 323. | |||||||||||||||
| Calib | [-] | 330. | 330. | 323. | 358. | 7.14 | 15.6 | 0.0784 | 0.840 | 0.829 | 0.994 | 0.983 | 0.824 | 0.883 | |||
| Control | [-] | 329. | 330. | 323. | 358. | 6.68 | 15.3 | 0.0784 | 0.844 | 0.829 | 0.994 | 0.985 | 0.829 | 0.885 |
Download Data |
Period Mean (original grids) [W/m2] |
Model Period Mean (intersection) [W/m2] |
Model Period Mean (complement) [W/m2] |
Benchmark Period Mean (intersection) [W/m2] |
Benchmark Period Mean (complement) [W/m2] |
Bias [W/m2] |
RMSE [W/m2] |
Phase Shift [months] |
Bias Score [1] |
RMSE Score [1] |
Seasonal Cycle Score [1] |
Spatial Distribution Score [1] |
Interannual Variability Score [1] |
Overall Score [1] |
|||
|---|---|---|---|---|---|---|---|---|---|---|---|---|---|---|---|---|---|
| Benchmark | [-] | 378. | |||||||||||||||
| Calib | [-] | 384. | 382. | 378. | 3.61 | 17.1 | 0.161 | 0.786 | 0.803 | 0.989 | 0.998 | 0.814 | 0.865 | ||||
| Control | [-] | 384. | 382. | 378. | 4.08 | 17.3 | 0.161 | 0.785 | 0.803 | 0.989 | 0.997 | 0.822 | 0.866 |
Download Data |
Period Mean (original grids) [W/m2] |
Model Period Mean (intersection) [W/m2] |
Model Period Mean (complement) [W/m2] |
Benchmark Period Mean (intersection) [W/m2] |
Benchmark Period Mean (complement) [W/m2] |
Bias [W/m2] |
RMSE [W/m2] |
Phase Shift [months] |
Bias Score [1] |
RMSE Score [1] |
Seasonal Cycle Score [1] |
Spatial Distribution Score [1] |
Interannual Variability Score [1] |
Overall Score [1] |
|||
|---|---|---|---|---|---|---|---|---|---|---|---|---|---|---|---|---|---|
| Benchmark | [-] | 450. | |||||||||||||||
| Calib | [-] | 459. | 457. | 450. | 460. | 6.69 | 14.6 | 1.50 | 0.350 | 0.408 | 0.792 | 0.999 | 0.680 | 0.606 | |||
| Control | [-] | 460. | 458. | 450. | 460. | 8.07 | 15.3 | 1.53 | 0.320 | 0.414 | 0.783 | 0.999 | 0.686 | 0.602 |
Download Data |
Period Mean (original grids) [W/m2] |
Model Period Mean (intersection) [W/m2] |
Model Period Mean (complement) [W/m2] |
Benchmark Period Mean (intersection) [W/m2] |
Benchmark Period Mean (complement) [W/m2] |
Bias [W/m2] |
RMSE [W/m2] |
Phase Shift [months] |
Bias Score [1] |
RMSE Score [1] |
Seasonal Cycle Score [1] |
Spatial Distribution Score [1] |
Interannual Variability Score [1] |
Overall Score [1] |
|||
|---|---|---|---|---|---|---|---|---|---|---|---|---|---|---|---|---|---|
| Benchmark | [-] | 445. | |||||||||||||||
| Calib | [-] | 446. | 445. | 445. | 417. | 0.327 | 13.0 | 0.963 | 0.693 | 0.588 | 0.854 | 0.991 | 0.705 | 0.737 | |||
| Control | [-] | 448. | 447. | 445. | 417. | 2.39 | 13.1 | 0.946 | 0.676 | 0.593 | 0.854 | 0.995 | 0.720 | 0.738 |
Download Data |
Period Mean (original grids) [W/m2] |
Model Period Mean (intersection) [W/m2] |
Model Period Mean (complement) [W/m2] |
Benchmark Period Mean (intersection) [W/m2] |
Benchmark Period Mean (complement) [W/m2] |
Bias [W/m2] |
RMSE [W/m2] |
Phase Shift [months] |
Bias Score [1] |
RMSE Score [1] |
Seasonal Cycle Score [1] |
Spatial Distribution Score [1] |
Interannual Variability Score [1] |
Overall Score [1] |
|||
|---|---|---|---|---|---|---|---|---|---|---|---|---|---|---|---|---|---|
| Benchmark | [-] | 384. | |||||||||||||||
| Calib | [-] | 392. | 390. | 385. | 373. | 5.57 | 26.5 | 1.09 | 0.444 | 0.552 | 0.864 | 0.992 | 0.679 | 0.680 | |||
| Control | [-] | 393. | 391. | 385. | 373. | 6.31 | 26.8 | 1.09 | 0.437 | 0.551 | 0.864 | 0.994 | 0.683 | 0.680 |
Temporally integrated period mean