Mean State
Download Data |
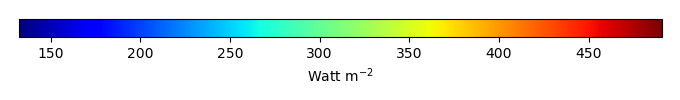
Period Mean (original grids) [Watt m-2] |
Model Period Mean (intersection) [Watt m-2] |
Model Period Mean (complement) [Watt m-2] |
Benchmark Period Mean (intersection) [Watt m-2] |
Benchmark Period Mean (complement) [Watt m-2] |
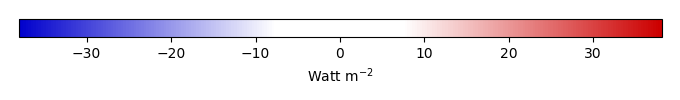
Bias [Watt m-2] |
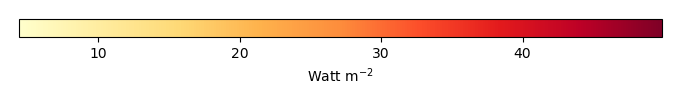
RMSE [Watt m-2] |
Phase Shift [months] |
Bias Score [1] |
RMSE Score [1] |
Seasonal Cycle Score [1] |
Spatial Distribution Score [1] |
Interannual Variability Score [1] |
Overall Score [1] |
|||
|---|---|---|---|---|---|---|---|---|---|---|---|---|---|---|---|---|---|
| Benchmark | [-] | 454. | |||||||||||||||
| Calib | [-] | 459. | 460. | 454. | 462. | 5.73 | 16.0 | 1.56 | 0.331 | 0.396 | 0.790 | 0.931 | 0.654 | 0.583 | |||
| Control | [-] | 462. | 462. | 454. | 462. | 8.01 | 16.9 | 1.49 | 0.295 | 0.402 | 0.803 | 0.932 | 0.654 | 0.581 |
Download Data |
Period Mean (original grids) [Watt m-2] |
Model Period Mean (intersection) [Watt m-2] |
Model Period Mean (complement) [Watt m-2] |
Benchmark Period Mean (intersection) [Watt m-2] |
Benchmark Period Mean (complement) [Watt m-2] |
Bias [Watt m-2] |
RMSE [Watt m-2] |
Phase Shift [months] |
Bias Score [1] |
RMSE Score [1] |
Seasonal Cycle Score [1] |
Spatial Distribution Score [1] |
Interannual Variability Score [1] |
Overall Score [1] |
|||
|---|---|---|---|---|---|---|---|---|---|---|---|---|---|---|---|---|---|
| Benchmark | [-] | 473. | |||||||||||||||
| Calib | [-] | 476. | 477. | 473. | 444. | 3.84 | 20.8 | 0.779 | 0.618 | 0.478 | 0.931 | 0.944 | 0.598 | 0.674 | |||
| Control | [-] | 479. | 479. | 473. | 444. | 6.65 | 21.6 | 0.758 | 0.582 | 0.487 | 0.932 | 0.943 | 0.604 | 0.672 |
Download Data |
Period Mean (original grids) [Watt m-2] |
Model Period Mean (intersection) [Watt m-2] |
Model Period Mean (complement) [Watt m-2] |
Benchmark Period Mean (intersection) [Watt m-2] |
Benchmark Period Mean (complement) [Watt m-2] |
Bias [Watt m-2] |
RMSE [Watt m-2] |
Phase Shift [months] |
Bias Score [1] |
RMSE Score [1] |
Seasonal Cycle Score [1] |
Spatial Distribution Score [1] |
Interannual Variability Score [1] |
Overall Score [1] |
|||
|---|---|---|---|---|---|---|---|---|---|---|---|---|---|---|---|---|---|
| Benchmark | [-] | 445. | |||||||||||||||
| Calib | [-] | 447. | 446. | 445. | 454. | 1.69 | 17.2 | 1.17 | 0.628 | 0.496 | 0.847 | 1.00 | 0.573 | 0.673 | |||
| Control | [-] | 449. | 449. | 445. | 454. | 4.09 | 17.6 | 1.09 | 0.592 | 0.505 | 0.859 | 0.999 | 0.578 | 0.673 |
Download Data |
Period Mean (original grids) [Watt m-2] |
Model Period Mean (intersection) [Watt m-2] |
Model Period Mean (complement) [Watt m-2] |
Benchmark Period Mean (intersection) [Watt m-2] |
Benchmark Period Mean (complement) [Watt m-2] |
Bias [Watt m-2] |
RMSE [Watt m-2] |
Phase Shift [months] |
Bias Score [1] |
RMSE Score [1] |
Seasonal Cycle Score [1] |
Spatial Distribution Score [1] |
Interannual Variability Score [1] |
Overall Score [1] |
|||
|---|---|---|---|---|---|---|---|---|---|---|---|---|---|---|---|---|---|
| Benchmark | [-] | 277. | |||||||||||||||
| Calib | [-] | 278. | 281. | 276. | 293. | 4.42 | 18.0 | 0.102 | 0.870 | 0.790 | 0.993 | 0.982 | 0.740 | 0.861 | |||
| Control | [-] | 278. | 280. | 276. | 293. | 4.30 | 18.0 | 0.102 | 0.870 | 0.789 | 0.993 | 0.983 | 0.745 | 0.861 |
Download Data |
Period Mean (original grids) [Watt m-2] |
Model Period Mean (intersection) [Watt m-2] |
Model Period Mean (complement) [Watt m-2] |
Benchmark Period Mean (intersection) [Watt m-2] |
Benchmark Period Mean (complement) [Watt m-2] |
Bias [Watt m-2] |
RMSE [Watt m-2] |
Phase Shift [months] |
Bias Score [1] |
RMSE Score [1] |
Seasonal Cycle Score [1] |
Spatial Distribution Score [1] |
Interannual Variability Score [1] |
Overall Score [1] |
|||
|---|---|---|---|---|---|---|---|---|---|---|---|---|---|---|---|---|---|
| Benchmark | [-] | 457. | |||||||||||||||
| Calib | [-] | 458. | 459. | 456. | 464. | 2.94 | 10.0 | 1.91 | 0.312 | 0.425 | 0.704 | 0.992 | 0.673 | 0.589 | |||
| Control | [-] | 459. | 460. | 456. | 464. | 4.16 | 10.3 | 1.90 | 0.310 | 0.427 | 0.705 | 0.992 | 0.677 | 0.590 |
Download Data |
Period Mean (original grids) [Watt m-2] |
Model Period Mean (intersection) [Watt m-2] |
Model Period Mean (complement) [Watt m-2] |
Benchmark Period Mean (intersection) [Watt m-2] |
Benchmark Period Mean (complement) [Watt m-2] |
Bias [Watt m-2] |
RMSE [Watt m-2] |
Phase Shift [months] |
Bias Score [1] |
RMSE Score [1] |
Seasonal Cycle Score [1] |
Spatial Distribution Score [1] |
Interannual Variability Score [1] |
Overall Score [1] |
|||
|---|---|---|---|---|---|---|---|---|---|---|---|---|---|---|---|---|---|
| Benchmark | [-] | 307. | |||||||||||||||
| Calib | [-] | 314. | 316. | 306. | 330. | 10.2 | 15.7 | 0.104 | 0.856 | 0.860 | 0.993 | 0.988 | 0.880 | 0.906 | |||
| Control | [-] | 313. | 316. | 306. | 330. | 9.73 | 15.4 | 0.113 | 0.860 | 0.861 | 0.993 | 0.983 | 0.881 | 0.906 |
Download Data |
Period Mean (original grids) [Watt m-2] |
Model Period Mean (intersection) [Watt m-2] |
Model Period Mean (complement) [Watt m-2] |
Benchmark Period Mean (intersection) [Watt m-2] |
Benchmark Period Mean (complement) [Watt m-2] |
Bias [Watt m-2] |
RMSE [Watt m-2] |
Phase Shift [months] |
Bias Score [1] |
RMSE Score [1] |
Seasonal Cycle Score [1] |
Spatial Distribution Score [1] |
Interannual Variability Score [1] |
Overall Score [1] |
|||
|---|---|---|---|---|---|---|---|---|---|---|---|---|---|---|---|---|---|
| Benchmark | [-] | 364. | |||||||||||||||
| Calib | [-] | 367. | 368. | 363. | 391. | 4.48 | 17.8 | 0.179 | 0.826 | 0.813 | 0.985 | 0.994 | 0.724 | 0.859 | |||
| Control | [-] | 368. | 368. | 363. | 391. | 4.91 | 17.7 | 0.179 | 0.822 | 0.816 | 0.985 | 0.994 | 0.730 | 0.860 |
Download Data |
Period Mean (original grids) [Watt m-2] |
Model Period Mean (intersection) [Watt m-2] |
Model Period Mean (complement) [Watt m-2] |
Benchmark Period Mean (intersection) [Watt m-2] |
Benchmark Period Mean (complement) [Watt m-2] |
Bias [Watt m-2] |
RMSE [Watt m-2] |
Phase Shift [months] |
Bias Score [1] |
RMSE Score [1] |
Seasonal Cycle Score [1] |
Spatial Distribution Score [1] |
Interannual Variability Score [1] |
Overall Score [1] |
|||
|---|---|---|---|---|---|---|---|---|---|---|---|---|---|---|---|---|---|
| Benchmark | [-] | 451. | |||||||||||||||
| Calib | [-] | 456. | 453. | 451. | 462. | 2.44 | 18.9 | 0.616 | 0.546 | 0.554 | 0.939 | 1.00 | 0.639 | 0.705 | |||
| Control | [-] | 458. | 455. | 451. | 462. | 4.47 | 19.7 | 0.601 | 0.523 | 0.551 | 0.941 | 0.999 | 0.639 | 0.701 |
Download Data |
Period Mean (original grids) [Watt m-2] |
Model Period Mean (intersection) [Watt m-2] |
Model Period Mean (complement) [Watt m-2] |
Benchmark Period Mean (intersection) [Watt m-2] |
Benchmark Period Mean (complement) [Watt m-2] |
Bias [Watt m-2] |
RMSE [Watt m-2] |
Phase Shift [months] |
Bias Score [1] |
RMSE Score [1] |
Seasonal Cycle Score [1] |
Spatial Distribution Score [1] |
Interannual Variability Score [1] |
Overall Score [1] |
|||
|---|---|---|---|---|---|---|---|---|---|---|---|---|---|---|---|---|---|
| Benchmark | [-] | 274. | |||||||||||||||
| Calib | [-] | 283. | 284. | 274. | 294. | 10.2 | 16.2 | 0.137 | 0.847 | 0.827 | 0.990 | 0.986 | 0.820 | 0.883 | |||
| Control | [-] | 282. | 284. | 274. | 294. | 10.1 | 16.1 | 0.130 | 0.848 | 0.826 | 0.990 | 0.987 | 0.823 | 0.884 |
Download Data |
Period Mean (original grids) [Watt m-2] |
Model Period Mean (intersection) [Watt m-2] |
Model Period Mean (complement) [Watt m-2] |
Benchmark Period Mean (intersection) [Watt m-2] |
Benchmark Period Mean (complement) [Watt m-2] |
Bias [Watt m-2] |
RMSE [Watt m-2] |
Phase Shift [months] |
Bias Score [1] |
RMSE Score [1] |
Seasonal Cycle Score [1] |
Spatial Distribution Score [1] |
Interannual Variability Score [1] |
Overall Score [1] |
|||
|---|---|---|---|---|---|---|---|---|---|---|---|---|---|---|---|---|---|
| Benchmark | [-] | 447. | |||||||||||||||
| Calib | [-] | 441. | 443. | 447. | 432. | -4.12 | 16.2 | 0.459 | 0.734 | 0.689 | 0.962 | 0.979 | 0.679 | 0.789 | |||
| Control | [-] | 443. | 444. | 447. | 432. | -2.72 | 16.0 | 0.495 | 0.733 | 0.689 | 0.957 | 0.982 | 0.682 | 0.789 |
Download Data |
Period Mean (original grids) [Watt m-2] |
Model Period Mean (intersection) [Watt m-2] |
Model Period Mean (complement) [Watt m-2] |
Benchmark Period Mean (intersection) [Watt m-2] |
Benchmark Period Mean (complement) [Watt m-2] |
Bias [Watt m-2] |
RMSE [Watt m-2] |
Phase Shift [months] |
Bias Score [1] |
RMSE Score [1] |
Seasonal Cycle Score [1] |
Spatial Distribution Score [1] |
Interannual Variability Score [1] |
Overall Score [1] |
|||
|---|---|---|---|---|---|---|---|---|---|---|---|---|---|---|---|---|---|
| Benchmark | [-] | 366. | |||||||||||||||
| Calib | [-] | 364. | 367. | 364. | 402. | 3.27 | 12.6 | 0.166 | 0.825 | 0.795 | 0.989 | 0.996 | 0.799 | 0.867 | |||
| Control | [-] | 364. | 368. | 364. | 402. | 3.52 | 12.6 | 0.176 | 0.824 | 0.795 | 0.988 | 0.998 | 0.802 | 0.867 |
Download Data |
Period Mean (original grids) [Watt m-2] |
Model Period Mean (intersection) [Watt m-2] |
Model Period Mean (complement) [Watt m-2] |
Benchmark Period Mean (intersection) [Watt m-2] |
Benchmark Period Mean (complement) [Watt m-2] |
Bias [Watt m-2] |
RMSE [Watt m-2] |
Phase Shift [months] |
Bias Score [1] |
RMSE Score [1] |
Seasonal Cycle Score [1] |
Spatial Distribution Score [1] |
Interannual Variability Score [1] |
Overall Score [1] |
|||
|---|---|---|---|---|---|---|---|---|---|---|---|---|---|---|---|---|---|
| Benchmark | [-] | 397. | |||||||||||||||
| Calib | [-] | 386. | 386. | 382. | 407. | 3.42 | 17.4 | 0.608 | 0.643 | 0.648 | 0.931 | 0.998 | 0.717 | 0.764 | |||
| Control | [-] | 387. | 387. | 382. | 407. | 4.21 | 17.6 | 0.606 | 0.634 | 0.649 | 0.931 | 0.998 | 0.718 | 0.763 |
Download Data |
Period Mean (original grids) [Watt m-2] |
Model Period Mean (intersection) [Watt m-2] |
Model Period Mean (complement) [Watt m-2] |
Benchmark Period Mean (intersection) [Watt m-2] |
Benchmark Period Mean (complement) [Watt m-2] |
Bias [Watt m-2] |
RMSE [Watt m-2] |
Phase Shift [months] |
Bias Score [1] |
RMSE Score [1] |
Seasonal Cycle Score [1] |
Spatial Distribution Score [1] |
Interannual Variability Score [1] |
Overall Score [1] |
|||
|---|---|---|---|---|---|---|---|---|---|---|---|---|---|---|---|---|---|
| Benchmark | [-] | 468. | |||||||||||||||
| Calib | [-] | 449. | 451. | 469. | 425. | -17.8 | 27.9 | 0.508 | 0.661 | 0.709 | 0.955 | 0.959 | 0.585 | 0.763 | |||
| Control | [-] | 450. | 451. | 469. | 425. | -17.6 | 27.8 | 0.518 | 0.663 | 0.709 | 0.953 | 0.957 | 0.586 | 0.763 |
Download Data |
Period Mean (original grids) [Watt m-2] |
Model Period Mean (intersection) [Watt m-2] |
Model Period Mean (complement) [Watt m-2] |
Benchmark Period Mean (intersection) [Watt m-2] |
Benchmark Period Mean (complement) [Watt m-2] |
Bias [Watt m-2] |
RMSE [Watt m-2] |
Phase Shift [months] |
Bias Score [1] |
RMSE Score [1] |
Seasonal Cycle Score [1] |
Spatial Distribution Score [1] |
Interannual Variability Score [1] |
Overall Score [1] |
|||
|---|---|---|---|---|---|---|---|---|---|---|---|---|---|---|---|---|---|
| Benchmark | [-] | 279. | |||||||||||||||
| Calib | [-] | 288. | 290. | 279. | 289. | 11.5 | 17.4 | 0.165 | 0.811 | 0.817 | 0.989 | 0.997 | 0.779 | 0.868 | |||
| Control | [-] | 288. | 290. | 279. | 289. | 11.5 | 17.3 | 0.173 | 0.812 | 0.817 | 0.988 | 0.997 | 0.782 | 0.869 |
Download Data |
Period Mean (original grids) [Watt m-2] |
Model Period Mean (intersection) [Watt m-2] |
Model Period Mean (complement) [Watt m-2] |
Benchmark Period Mean (intersection) [Watt m-2] |
Benchmark Period Mean (complement) [Watt m-2] |
Bias [Watt m-2] |
RMSE [Watt m-2] |
Phase Shift [months] |
Bias Score [1] |
RMSE Score [1] |
Seasonal Cycle Score [1] |
Spatial Distribution Score [1] |
Interannual Variability Score [1] |
Overall Score [1] |
|||
|---|---|---|---|---|---|---|---|---|---|---|---|---|---|---|---|---|---|
| Benchmark | [-] | 446. | |||||||||||||||
| Calib | [-] | 452. | 452. | 445. | 456. | 7.18 | 15.0 | 0.935 | 0.512 | 0.586 | 0.883 | 1.00 | 0.702 | 0.711 | |||
| Control | [-] | 454. | 454. | 445. | 456. | 9.08 | 16.1 | 0.981 | 0.483 | 0.577 | 0.875 | 1.00 | 0.702 | 0.702 |
Download Data |
Period Mean (original grids) [Watt m-2] |
Model Period Mean (intersection) [Watt m-2] |
Model Period Mean (complement) [Watt m-2] |
Benchmark Period Mean (intersection) [Watt m-2] |
Benchmark Period Mean (complement) [Watt m-2] |
Bias [Watt m-2] |
RMSE [Watt m-2] |
Phase Shift [months] |
Bias Score [1] |
RMSE Score [1] |
Seasonal Cycle Score [1] |
Spatial Distribution Score [1] |
Interannual Variability Score [1] |
Overall Score [1] |
|||
|---|---|---|---|---|---|---|---|---|---|---|---|---|---|---|---|---|---|
| Benchmark | [-] | 385. | |||||||||||||||
| Calib | [-] | 393. | 392. | 385. | 7.18 | 12.3 | 0.216 | 0.820 | 0.847 | 0.986 | 1.00 | 0.845 | 0.891 | ||||
| Control | [-] | 394. | 393. | 385. | 7.92 | 12.6 | 0.208 | 0.811 | 0.850 | 0.986 | 1.00 | 0.851 | 0.891 |
Download Data |
Period Mean (original grids) [Watt m-2] |
Model Period Mean (intersection) [Watt m-2] |
Model Period Mean (complement) [Watt m-2] |
Benchmark Period Mean (intersection) [Watt m-2] |
Benchmark Period Mean (complement) [Watt m-2] |
Bias [Watt m-2] |
RMSE [Watt m-2] |
Phase Shift [months] |
Bias Score [1] |
RMSE Score [1] |
Seasonal Cycle Score [1] |
Spatial Distribution Score [1] |
Interannual Variability Score [1] |
Overall Score [1] |
|||
|---|---|---|---|---|---|---|---|---|---|---|---|---|---|---|---|---|---|
| Benchmark | [-] | 320. | |||||||||||||||
| Calib | [-] | 330. | 330. | 319. | 354. | 10.8 | 16.3 | 0.101 | 0.813 | 0.827 | 0.993 | 0.995 | 0.821 | 0.879 | |||
| Control | [-] | 329. | 330. | 319. | 354. | 10.3 | 16.0 | 0.101 | 0.817 | 0.828 | 0.993 | 0.996 | 0.827 | 0.881 |
Download Data |
Period Mean (original grids) [Watt m-2] |
Model Period Mean (intersection) [Watt m-2] |
Model Period Mean (complement) [Watt m-2] |
Benchmark Period Mean (intersection) [Watt m-2] |
Benchmark Period Mean (complement) [Watt m-2] |
Bias [Watt m-2] |
RMSE [Watt m-2] |
Phase Shift [months] |
Bias Score [1] |
RMSE Score [1] |
Seasonal Cycle Score [1] |
Spatial Distribution Score [1] |
Interannual Variability Score [1] |
Overall Score [1] |
|||
|---|---|---|---|---|---|---|---|---|---|---|---|---|---|---|---|---|---|
| Benchmark | [-] | 380. | |||||||||||||||
| Calib | [-] | 384. | 382. | 380. | 2.26 | 19.2 | 0.145 | 0.813 | 0.784 | 0.990 | 0.984 | 0.731 | 0.848 | ||||
| Control | [-] | 384. | 382. | 380. | 2.73 | 19.2 | 0.145 | 0.811 | 0.787 | 0.990 | 0.987 | 0.741 | 0.851 |
Download Data |
Period Mean (original grids) [Watt m-2] |
Model Period Mean (intersection) [Watt m-2] |
Model Period Mean (complement) [Watt m-2] |
Benchmark Period Mean (intersection) [Watt m-2] |
Benchmark Period Mean (complement) [Watt m-2] |
Bias [Watt m-2] |
RMSE [Watt m-2] |
Phase Shift [months] |
Bias Score [1] |
RMSE Score [1] |
Seasonal Cycle Score [1] |
Spatial Distribution Score [1] |
Interannual Variability Score [1] |
Overall Score [1] |
|||
|---|---|---|---|---|---|---|---|---|---|---|---|---|---|---|---|---|---|
| Benchmark | [-] | 446. | |||||||||||||||
| Calib | [-] | 459. | 457. | 446. | 456. | 11.2 | 14.7 | 1.21 | 0.215 | 0.432 | 0.835 | 0.938 | 0.718 | 0.595 | |||
| Control | [-] | 460. | 458. | 446. | 456. | 12.6 | 15.7 | 1.22 | 0.189 | 0.440 | 0.830 | 0.933 | 0.723 | 0.592 |
Download Data |
Period Mean (original grids) [Watt m-2] |
Model Period Mean (intersection) [Watt m-2] |
Model Period Mean (complement) [Watt m-2] |
Benchmark Period Mean (intersection) [Watt m-2] |
Benchmark Period Mean (complement) [Watt m-2] |
Bias [Watt m-2] |
RMSE [Watt m-2] |
Phase Shift [months] |
Bias Score [1] |
RMSE Score [1] |
Seasonal Cycle Score [1] |
Spatial Distribution Score [1] |
Interannual Variability Score [1] |
Overall Score [1] |
|||
|---|---|---|---|---|---|---|---|---|---|---|---|---|---|---|---|---|---|
| Benchmark | [-] | 441. | |||||||||||||||
| Calib | [-] | 446. | 445. | 441. | 412. | 3.70 | 12.2 | 0.838 | 0.695 | 0.610 | 0.881 | 0.999 | 0.691 | 0.748 | |||
| Control | [-] | 448. | 447. | 441. | 412. | 5.76 | 13.0 | 0.777 | 0.648 | 0.614 | 0.888 | 0.998 | 0.707 | 0.745 |
Download Data |
Period Mean (original grids) [Watt m-2] |
Model Period Mean (intersection) [Watt m-2] |
Model Period Mean (complement) [Watt m-2] |
Benchmark Period Mean (intersection) [Watt m-2] |
Benchmark Period Mean (complement) [Watt m-2] |
Bias [Watt m-2] |
RMSE [Watt m-2] |
Phase Shift [months] |
Bias Score [1] |
RMSE Score [1] |
Seasonal Cycle Score [1] |
Spatial Distribution Score [1] |
Interannual Variability Score [1] |
Overall Score [1] |
|||
|---|---|---|---|---|---|---|---|---|---|---|---|---|---|---|---|---|---|
| Benchmark | [-] | 387. | |||||||||||||||
| Calib | [-] | 392. | 390. | 387. | 370. | 2.80 | 23.8 | 0.780 | 0.478 | 0.580 | 0.905 | 0.998 | 0.663 | 0.701 | |||
| Control | [-] | 393. | 391. | 387. | 370. | 3.54 | 24.1 | 0.780 | 0.472 | 0.580 | 0.905 | 0.999 | 0.665 | 0.700 |
Temporally integrated period mean