Mean State
Download Data |
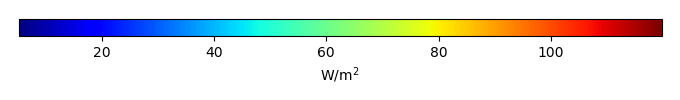
Period Mean (original grids) [W/m2] |
Model Period Mean (intersection) [W/m2] |
Model Period Mean (complement) [W/m2] |
Benchmark Period Mean (intersection) [W/m2] |
Benchmark Period Mean (complement) [W/m2] |
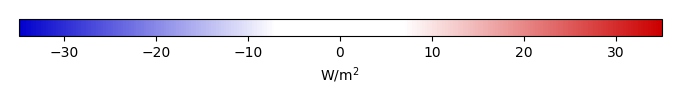
Bias [W/m2] |
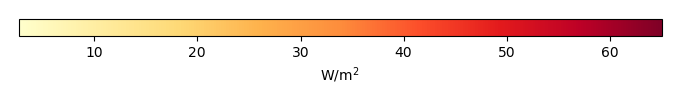
RMSE [W/m2] |
Phase Shift [months] |
Bias Score [1] |
RMSE Score [1] |
Seasonal Cycle Score [1] |
Spatial Distribution Score [1] |
Interannual Variability Score [1] |
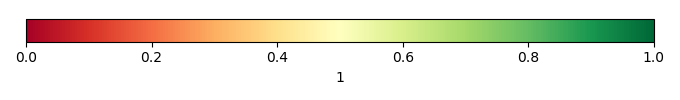
Overall Score [1] |
|||
|---|---|---|---|---|---|---|---|---|---|---|---|---|---|---|---|---|---|
| Benchmark | [-] | 31.2 | |||||||||||||||
| Calib | [-] | 35.8 | 34.9 | 31.3 | 10.9 | 3.62 | 9.00 | 2.23 | 0.337 | 0.314 | 0.659 | 0.953 | 0.663 | 0.540 | |||
| Control | [-] | 36.2 | 35.2 | 31.3 | 10.9 | 3.99 | 8.98 | 2.13 | 0.344 | 0.316 | 0.677 | 0.959 | 0.664 | 0.546 |
Download Data |
Period Mean (original grids) [W/m2] |
Model Period Mean (intersection) [W/m2] |
Model Period Mean (complement) [W/m2] |
Benchmark Period Mean (intersection) [W/m2] |
Benchmark Period Mean (complement) [W/m2] |
Bias [W/m2] |
RMSE [W/m2] |
Phase Shift [months] |
Bias Score [1] |
RMSE Score [1] |
Seasonal Cycle Score [1] |
Spatial Distribution Score [1] |
Interannual Variability Score [1] |
Overall Score [1] |
|||
|---|---|---|---|---|---|---|---|---|---|---|---|---|---|---|---|---|---|
| Benchmark | [-] | 44.1 | |||||||||||||||
| Calib | [-] | 45.4 | 46.5 | 44.2 | 13.6 | 2.29 | 10.9 | 1.13 | 0.403 | 0.369 | 0.859 | 0.985 | 0.664 | 0.608 | |||
| Control | [-] | 45.9 | 46.9 | 44.2 | 13.6 | 2.68 | 11.0 | 1.13 | 0.395 | 0.372 | 0.859 | 0.984 | 0.656 | 0.607 |
Download Data |
Period Mean (original grids) [W/m2] |
Model Period Mean (intersection) [W/m2] |
Model Period Mean (complement) [W/m2] |
Benchmark Period Mean (intersection) [W/m2] |
Benchmark Period Mean (complement) [W/m2] |
Bias [W/m2] |
RMSE [W/m2] |
Phase Shift [months] |
Bias Score [1] |
RMSE Score [1] |
Seasonal Cycle Score [1] |
Spatial Distribution Score [1] |
Interannual Variability Score [1] |
Overall Score [1] |
|||
|---|---|---|---|---|---|---|---|---|---|---|---|---|---|---|---|---|---|
| Benchmark | [-] | 33.2 | |||||||||||||||
| Calib | [-] | 35.0 | 35.4 | 33.4 | 17.8 | 1.98 | 8.89 | 1.57 | 0.510 | 0.416 | 0.779 | 0.822 | 0.670 | 0.602 | |||
| Control | [-] | 35.5 | 35.9 | 33.4 | 17.8 | 2.46 | 8.96 | 1.63 | 0.505 | 0.411 | 0.771 | 0.824 | 0.667 | 0.598 |
Download Data |
Period Mean (original grids) [W/m2] |
Model Period Mean (intersection) [W/m2] |
Model Period Mean (complement) [W/m2] |
Benchmark Period Mean (intersection) [W/m2] |
Benchmark Period Mean (complement) [W/m2] |
Bias [W/m2] |
RMSE [W/m2] |
Phase Shift [months] |
Bias Score [1] |
RMSE Score [1] |
Seasonal Cycle Score [1] |
Spatial Distribution Score [1] |
Interannual Variability Score [1] |
Overall Score [1] |
|||
|---|---|---|---|---|---|---|---|---|---|---|---|---|---|---|---|---|---|
| Benchmark | [-] | 41.7 | |||||||||||||||
| Calib | [-] | 36.2 | 36.3 | 42.1 | 35.3 | -5.84 | 21.4 | 0.351 | 0.828 | 0.665 | 0.976 | 0.664 | 0.627 | 0.737 | |||
| Control | [-] | 36.0 | 36.1 | 42.1 | 35.3 | -6.05 | 21.8 | 0.343 | 0.826 | 0.660 | 0.977 | 0.657 | 0.633 | 0.735 |
Download Data |
Period Mean (original grids) [W/m2] |
Model Period Mean (intersection) [W/m2] |
Model Period Mean (complement) [W/m2] |
Benchmark Period Mean (intersection) [W/m2] |
Benchmark Period Mean (complement) [W/m2] |
Bias [W/m2] |
RMSE [W/m2] |
Phase Shift [months] |
Bias Score [1] |
RMSE Score [1] |
Seasonal Cycle Score [1] |
Spatial Distribution Score [1] |
Interannual Variability Score [1] |
Overall Score [1] |
|||
|---|---|---|---|---|---|---|---|---|---|---|---|---|---|---|---|---|---|
| Benchmark | [-] | 17.4 | |||||||||||||||
| Calib | [-] | 28.1 | 28.3 | 17.9 | 13.1 | 10.4 | 11.5 | 1.45 | 0.199 | 0.342 | 0.782 | 0.459 | 0.686 | 0.468 | |||
| Control | [-] | 28.2 | 28.3 | 17.9 | 13.1 | 10.4 | 11.5 | 1.45 | 0.199 | 0.342 | 0.782 | 0.463 | 0.686 | 0.469 |
Download Data |
Period Mean (original grids) [W/m2] |
Model Period Mean (intersection) [W/m2] |
Model Period Mean (complement) [W/m2] |
Benchmark Period Mean (intersection) [W/m2] |
Benchmark Period Mean (complement) [W/m2] |
Bias [W/m2] |
RMSE [W/m2] |
Phase Shift [months] |
Bias Score [1] |
RMSE Score [1] |
Seasonal Cycle Score [1] |
Spatial Distribution Score [1] |
Interannual Variability Score [1] |
Overall Score [1] |
|||
|---|---|---|---|---|---|---|---|---|---|---|---|---|---|---|---|---|---|
| Benchmark | [-] | 27.7 | |||||||||||||||
| Calib | [-] | 23.8 | 24.2 | 27.8 | 22.3 | -3.63 | 11.8 | 0.337 | 0.811 | 0.617 | 0.974 | 0.859 | 0.631 | 0.752 | |||
| Control | [-] | 23.4 | 23.8 | 27.8 | 22.3 | -4.03 | 12.3 | 0.364 | 0.801 | 0.605 | 0.972 | 0.859 | 0.631 | 0.746 |
Download Data |
Period Mean (original grids) [W/m2] |
Model Period Mean (intersection) [W/m2] |
Model Period Mean (complement) [W/m2] |
Benchmark Period Mean (intersection) [W/m2] |
Benchmark Period Mean (complement) [W/m2] |
Bias [W/m2] |
RMSE [W/m2] |
Phase Shift [months] |
Bias Score [1] |
RMSE Score [1] |
Seasonal Cycle Score [1] |
Spatial Distribution Score [1] |
Interannual Variability Score [1] |
Overall Score [1] |
|||
|---|---|---|---|---|---|---|---|---|---|---|---|---|---|---|---|---|---|
| Benchmark | [-] | 35.0 | |||||||||||||||
| Calib | [-] | 33.6 | 33.5 | 35.7 | 12.2 | -2.26 | 11.7 | 1.08 | 0.661 | 0.521 | 0.852 | 0.861 | 0.663 | 0.680 | |||
| Control | [-] | 34.0 | 33.9 | 35.7 | 12.2 | -1.81 | 11.7 | 1.09 | 0.667 | 0.519 | 0.851 | 0.890 | 0.657 | 0.684 |
Download Data |
Period Mean (original grids) [W/m2] |
Model Period Mean (intersection) [W/m2] |
Model Period Mean (complement) [W/m2] |
Benchmark Period Mean (intersection) [W/m2] |
Benchmark Period Mean (complement) [W/m2] |
Bias [W/m2] |
RMSE [W/m2] |
Phase Shift [months] |
Bias Score [1] |
RMSE Score [1] |
Seasonal Cycle Score [1] |
Spatial Distribution Score [1] |
Interannual Variability Score [1] |
Overall Score [1] |
|||
|---|---|---|---|---|---|---|---|---|---|---|---|---|---|---|---|---|---|
| Benchmark | [-] | 29.5 | |||||||||||||||
| Calib | [-] | 31.3 | 31.4 | 29.7 | 13.0 | 1.68 | 10.2 | 0.914 | 0.485 | 0.423 | 0.892 | 0.650 | 0.616 | 0.582 | |||
| Control | [-] | 31.4 | 31.5 | 29.7 | 13.0 | 1.80 | 10.2 | 0.925 | 0.486 | 0.423 | 0.890 | 0.664 | 0.612 | 0.583 |
Download Data |
Period Mean (original grids) [W/m2] |
Model Period Mean (intersection) [W/m2] |
Model Period Mean (complement) [W/m2] |
Benchmark Period Mean (intersection) [W/m2] |
Benchmark Period Mean (complement) [W/m2] |
Bias [W/m2] |
RMSE [W/m2] |
Phase Shift [months] |
Bias Score [1] |
RMSE Score [1] |
Seasonal Cycle Score [1] |
Spatial Distribution Score [1] |
Interannual Variability Score [1] |
Overall Score [1] |
|||
|---|---|---|---|---|---|---|---|---|---|---|---|---|---|---|---|---|---|
| Benchmark | [-] | 37.6 | |||||||||||||||
| Calib | [-] | 34.8 | 33.9 | 37.7 | 30.1 | -3.78 | 18.4 | 0.234 | 0.885 | 0.693 | 0.984 | 0.836 | 0.667 | 0.793 | |||
| Control | [-] | 34.5 | 33.7 | 37.7 | 30.1 | -4.03 | 18.8 | 0.232 | 0.882 | 0.688 | 0.984 | 0.837 | 0.671 | 0.792 |
Download Data |
Period Mean (original grids) [W/m2] |
Model Period Mean (intersection) [W/m2] |
Model Period Mean (complement) [W/m2] |
Benchmark Period Mean (intersection) [W/m2] |
Benchmark Period Mean (complement) [W/m2] |
Bias [W/m2] |
RMSE [W/m2] |
Phase Shift [months] |
Bias Score [1] |
RMSE Score [1] |
Seasonal Cycle Score [1] |
Spatial Distribution Score [1] |
Interannual Variability Score [1] |
Overall Score [1] |
|||
|---|---|---|---|---|---|---|---|---|---|---|---|---|---|---|---|---|---|
| Benchmark | [-] | 34.8 | |||||||||||||||
| Calib | [-] | 39.5 | 40.1 | 35.6 | 14.2 | 4.51 | 9.71 | 0.696 | 0.538 | 0.545 | 0.930 | 0.870 | 0.711 | 0.690 | |||
| Control | [-] | 40.1 | 40.7 | 35.6 | 14.2 | 5.15 | 9.85 | 0.668 | 0.529 | 0.548 | 0.937 | 0.875 | 0.698 | 0.689 |
Download Data |
Period Mean (original grids) [W/m2] |
Model Period Mean (intersection) [W/m2] |
Model Period Mean (complement) [W/m2] |
Benchmark Period Mean (intersection) [W/m2] |
Benchmark Period Mean (complement) [W/m2] |
Bias [W/m2] |
RMSE [W/m2] |
Phase Shift [months] |
Bias Score [1] |
RMSE Score [1] |
Seasonal Cycle Score [1] |
Spatial Distribution Score [1] |
Interannual Variability Score [1] |
Overall Score [1] |
|||
|---|---|---|---|---|---|---|---|---|---|---|---|---|---|---|---|---|---|
| Benchmark | [-] | 18.2 | |||||||||||||||
| Calib | [-] | 20.8 | 21.1 | 18.4 | 14.5 | 2.64 | 8.40 | 0.902 | 0.656 | 0.560 | 0.884 | 0.735 | 0.676 | 0.679 | |||
| Control | [-] | 20.8 | 21.0 | 18.4 | 14.5 | 2.59 | 8.38 | 0.784 | 0.656 | 0.562 | 0.906 | 0.747 | 0.676 | 0.685 |
Download Data |
Period Mean (original grids) [W/m2] |
Model Period Mean (intersection) [W/m2] |
Model Period Mean (complement) [W/m2] |
Benchmark Period Mean (intersection) [W/m2] |
Benchmark Period Mean (complement) [W/m2] |
Bias [W/m2] |
RMSE [W/m2] |
Phase Shift [months] |
Bias Score [1] |
RMSE Score [1] |
Seasonal Cycle Score [1] |
Spatial Distribution Score [1] |
Interannual Variability Score [1] |
Overall Score [1] |
|||
|---|---|---|---|---|---|---|---|---|---|---|---|---|---|---|---|---|---|
| Benchmark | [-] | 24.1 | |||||||||||||||
| Calib | [-] | 42.5 | 42.5 | 40.0 | 13.7 | 2.54 | 15.1 | 0.855 | 0.539 | 0.491 | 0.893 | 0.981 | 0.632 | 0.671 | |||
| Control | [-] | 42.7 | 42.7 | 40.0 | 13.7 | 2.70 | 15.2 | 0.846 | 0.539 | 0.490 | 0.894 | 0.981 | 0.629 | 0.671 |
Download Data |
Period Mean (original grids) [W/m2] |
Model Period Mean (intersection) [W/m2] |
Model Period Mean (complement) [W/m2] |
Benchmark Period Mean (intersection) [W/m2] |
Benchmark Period Mean (complement) [W/m2] |
Bias [W/m2] |
RMSE [W/m2] |
Phase Shift [months] |
Bias Score [1] |
RMSE Score [1] |
Seasonal Cycle Score [1] |
Spatial Distribution Score [1] |
Interannual Variability Score [1] |
Overall Score [1] |
|||
|---|---|---|---|---|---|---|---|---|---|---|---|---|---|---|---|---|---|
| Benchmark | [-] | 73.2 | |||||||||||||||
| Calib | [-] | 78.5 | 79.6 | 74.4 | 20.2 | 5.24 | 18.9 | 0.725 | 0.484 | 0.515 | 0.928 | 0.972 | 0.679 | 0.682 | |||
| Control | [-] | 78.9 | 80.0 | 74.4 | 20.2 | 5.63 | 18.8 | 0.725 | 0.484 | 0.520 | 0.928 | 0.971 | 0.666 | 0.682 |
Download Data |
Period Mean (original grids) [W/m2] |
Model Period Mean (intersection) [W/m2] |
Model Period Mean (complement) [W/m2] |
Benchmark Period Mean (intersection) [W/m2] |
Benchmark Period Mean (complement) [W/m2] |
Bias [W/m2] |
RMSE [W/m2] |
Phase Shift [months] |
Bias Score [1] |
RMSE Score [1] |
Seasonal Cycle Score [1] |
Spatial Distribution Score [1] |
Interannual Variability Score [1] |
Overall Score [1] |
|||
|---|---|---|---|---|---|---|---|---|---|---|---|---|---|---|---|---|---|
| Benchmark | [-] | 47.4 | |||||||||||||||
| Calib | [-] | 38.9 | 38.8 | 47.5 | 38.6 | -8.77 | 24.3 | 0.248 | 0.821 | 0.660 | 0.983 | 0.927 | 0.639 | 0.781 | |||
| Control | [-] | 38.7 | 38.5 | 47.5 | 38.6 | -9.06 | 24.6 | 0.268 | 0.819 | 0.656 | 0.981 | 0.925 | 0.645 | 0.780 |
Download Data |
Period Mean (original grids) [W/m2] |
Model Period Mean (intersection) [W/m2] |
Model Period Mean (complement) [W/m2] |
Benchmark Period Mean (intersection) [W/m2] |
Benchmark Period Mean (complement) [W/m2] |
Bias [W/m2] |
RMSE [W/m2] |
Phase Shift [months] |
Bias Score [1] |
RMSE Score [1] |
Seasonal Cycle Score [1] |
Spatial Distribution Score [1] |
Interannual Variability Score [1] |
Overall Score [1] |
|||
|---|---|---|---|---|---|---|---|---|---|---|---|---|---|---|---|---|---|
| Benchmark | [-] | 26.6 | |||||||||||||||
| Calib | [-] | 32.0 | 32.0 | 27.6 | 14.2 | 4.44 | 12.1 | 1.01 | 0.357 | 0.461 | 0.870 | 0.191 | 0.626 | 0.494 | |||
| Control | [-] | 32.3 | 32.4 | 27.6 | 14.2 | 4.79 | 12.0 | 0.973 | 0.361 | 0.460 | 0.874 | 0.221 | 0.614 | 0.498 |
Download Data |
Period Mean (original grids) [W/m2] |
Model Period Mean (intersection) [W/m2] |
Model Period Mean (complement) [W/m2] |
Benchmark Period Mean (intersection) [W/m2] |
Benchmark Period Mean (complement) [W/m2] |
Bias [W/m2] |
RMSE [W/m2] |
Phase Shift [months] |
Bias Score [1] |
RMSE Score [1] |
Seasonal Cycle Score [1] |
Spatial Distribution Score [1] |
Interannual Variability Score [1] |
Overall Score [1] |
|||
|---|---|---|---|---|---|---|---|---|---|---|---|---|---|---|---|---|---|
| Benchmark | [-] | 26.1 | |||||||||||||||
| Calib | [-] | 25.7 | 26.5 | 26.1 | 0.405 | 8.25 | 1.10 | 0.670 | 0.526 | 0.828 | 0.708 | 0.640 | 0.650 | ||||
| Control | [-] | 25.6 | 26.4 | 26.1 | 0.334 | 8.15 | 1.10 | 0.670 | 0.531 | 0.828 | 0.695 | 0.640 | 0.649 |
Download Data |
Period Mean (original grids) [W/m2] |
Model Period Mean (intersection) [W/m2] |
Model Period Mean (complement) [W/m2] |
Benchmark Period Mean (intersection) [W/m2] |
Benchmark Period Mean (complement) [W/m2] |
Bias [W/m2] |
RMSE [W/m2] |
Phase Shift [months] |
Bias Score [1] |
RMSE Score [1] |
Seasonal Cycle Score [1] |
Spatial Distribution Score [1] |
Interannual Variability Score [1] |
Overall Score [1] |
|||
|---|---|---|---|---|---|---|---|---|---|---|---|---|---|---|---|---|---|
| Benchmark | [-] | 26.5 | |||||||||||||||
| Calib | [-] | 23.9 | 23.8 | 26.7 | 8.13 | -2.89 | 12.4 | 0.490 | 0.738 | 0.578 | 0.950 | 0.771 | 0.620 | 0.706 | |||
| Control | [-] | 23.5 | 23.4 | 26.7 | 8.13 | -3.31 | 12.8 | 0.490 | 0.734 | 0.569 | 0.950 | 0.774 | 0.621 | 0.703 |
Download Data |
Period Mean (original grids) [W/m2] |
Model Period Mean (intersection) [W/m2] |
Model Period Mean (complement) [W/m2] |
Benchmark Period Mean (intersection) [W/m2] |
Benchmark Period Mean (complement) [W/m2] |
Bias [W/m2] |
RMSE [W/m2] |
Phase Shift [months] |
Bias Score [1] |
RMSE Score [1] |
Seasonal Cycle Score [1] |
Spatial Distribution Score [1] |
Interannual Variability Score [1] |
Overall Score [1] |
|||
|---|---|---|---|---|---|---|---|---|---|---|---|---|---|---|---|---|---|
| Benchmark | [-] | 39.3 | |||||||||||||||
| Calib | [-] | 33.1 | 31.9 | 39.3 | -7.41 | 11.7 | 1.22 | 0.582 | 0.583 | 0.812 | 0.825 | 0.696 | 0.680 | ||||
| Control | [-] | 33.7 | 32.4 | 39.3 | -6.86 | 11.5 | 1.16 | 0.600 | 0.579 | 0.818 | 0.856 | 0.681 | 0.686 |
Download Data |
Period Mean (original grids) [W/m2] |
Model Period Mean (intersection) [W/m2] |
Model Period Mean (complement) [W/m2] |
Benchmark Period Mean (intersection) [W/m2] |
Benchmark Period Mean (complement) [W/m2] |
Bias [W/m2] |
RMSE [W/m2] |
Phase Shift [months] |
Bias Score [1] |
RMSE Score [1] |
Seasonal Cycle Score [1] |
Spatial Distribution Score [1] |
Interannual Variability Score [1] |
Overall Score [1] |
|||
|---|---|---|---|---|---|---|---|---|---|---|---|---|---|---|---|---|---|
| Benchmark | [-] | 27.4 | |||||||||||||||
| Calib | [-] | 27.1 | 27.0 | 27.5 | 11.7 | -0.532 | 5.42 | 1.25 | 0.515 | 0.438 | 0.836 | 0.636 | 0.604 | 0.578 | |||
| Control | [-] | 27.2 | 27.0 | 27.5 | 11.7 | -0.508 | 5.42 | 1.25 | 0.515 | 0.438 | 0.836 | 0.646 | 0.605 | 0.579 |
Download Data |
Period Mean (original grids) [W/m2] |
Model Period Mean (intersection) [W/m2] |
Model Period Mean (complement) [W/m2] |
Benchmark Period Mean (intersection) [W/m2] |
Benchmark Period Mean (complement) [W/m2] |
Bias [W/m2] |
RMSE [W/m2] |
Phase Shift [months] |
Bias Score [1] |
RMSE Score [1] |
Seasonal Cycle Score [1] |
Spatial Distribution Score [1] |
Interannual Variability Score [1] |
Overall Score [1] |
|||
|---|---|---|---|---|---|---|---|---|---|---|---|---|---|---|---|---|---|
| Benchmark | [-] | 30.3 | |||||||||||||||
| Calib | [-] | 30.3 | 30.1 | 30.3 | 13.7 | -0.220 | 6.70 | 1.31 | 0.610 | 0.497 | 0.820 | 0.515 | 0.645 | 0.597 | |||
| Control | [-] | 30.6 | 30.4 | 30.3 | 13.7 | 0.0778 | 6.69 | 1.31 | 0.618 | 0.496 | 0.820 | 0.522 | 0.648 | 0.600 |
Download Data |
Period Mean (original grids) [W/m2] |
Model Period Mean (intersection) [W/m2] |
Model Period Mean (complement) [W/m2] |
Benchmark Period Mean (intersection) [W/m2] |
Benchmark Period Mean (complement) [W/m2] |
Bias [W/m2] |
RMSE [W/m2] |
Phase Shift [months] |
Bias Score [1] |
RMSE Score [1] |
Seasonal Cycle Score [1] |
Spatial Distribution Score [1] |
Interannual Variability Score [1] |
Overall Score [1] |
|||
|---|---|---|---|---|---|---|---|---|---|---|---|---|---|---|---|---|---|
| Benchmark | [-] | 30.7 | |||||||||||||||
| Calib | [-] | 30.2 | 30.7 | 31.2 | 10.6 | -0.488 | 12.5 | 1.04 | 0.449 | 0.494 | 0.876 | 0.813 | 0.626 | 0.626 | |||
| Control | [-] | 30.6 | 31.1 | 31.2 | 10.6 | -0.0386 | 12.3 | 0.998 | 0.458 | 0.496 | 0.879 | 0.808 | 0.623 | 0.627 |
Temporally integrated period mean