Mean State

Download Data
Period Mean (original grids) [Pg]
Model Period Mean (intersection) [Pg]
Benchmark Period Mean (intersection) [Pg]
Model Period Mean (complement) [Pg]
Benchmark Period Mean (complement) [Pg]
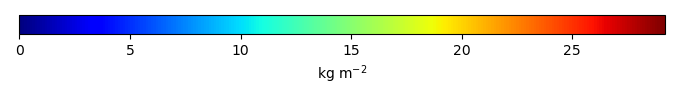
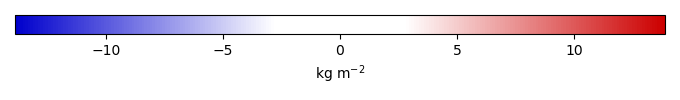
Bias [kg m-2]
Bias Score [1]
Spatial Distribution Score [1]
Overall Score [1]
Benchmark [-] 626.
CRUJRA [-] 617. 616. 624. 0.00328 2.64 0.513 0.688 0.919 0.804
PPE_GSWP3V1 [-] 574. 573. 624. 0.00402 2.64 0.317 0.669 0.898 0.784
R20_GSWP3V1 [-] 500. 499. 624. 0.00348 2.66 -0.266 0.642 0.863 0.752

Temporally integrated period mean

BENCHMARK MEAN
Data not available
Data not available
MODEL MEAN
Data not available
Data not available
BIAS
Data not available
Data not available
BIAS SCORE
Data not available
Data not available

SPATIAL TAYLOR DIAGRAM
Data not available
MODEL COLORS
Data not available

Spatially integrated regional mean

MODEL COLORS
Data not available

All Models

Benchmark
Data not available
Data not available
CRUJRA
Data not available
Data not available
PPE_GSWP3V1
Data not available
Data not available
R20_GSWP3V1
Data not available
Data not available

Data Information

  Title:
ESA CCI above-ground biomass product level

  Version:
3

  Institution:
GAMMA Remote Sensing

  Source:
ALOS-2 PALSAR-2 FB and WB mosaics, Sentinel-1 GRD

  History:
2022-05-17: downloaded source from https://dap.ceda.ac.uk/neodc/esacci/biomass/data/agb/maps/v3.0/netcdf/ESACCI-BIOMASS-L4-AGB-MERGED-100m-2010-fv3.0.nc
2022-05-26: coarsened to 0.5 degree resolution using https://github.com/rubisco-sfa/ILAMB-Data/blob/master/ESACCI/convert.py

  References:
M. Santoro and O. Cartus (2021), ESA Biomass Climate Change Initiative (Biomass_cci): Global datasets of forest above-ground biomass for the years 2010, 2017 and 2018, v3, NERC EDS Centre for Environmental Data Analysis, http://dx.doi.org/10.5285/5f331c418e9f4935b8eb1b836f8a91b8