Mean State
Download Data |
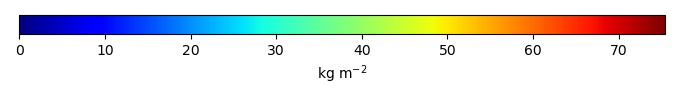
Period Mean (original grids) [Pg] |
Model Period Mean (intersection) [Pg] |
Benchmark Period Mean (intersection) [Pg] |
Model Period Mean (complement) [Pg] |
Benchmark Period Mean (complement) [Pg] |
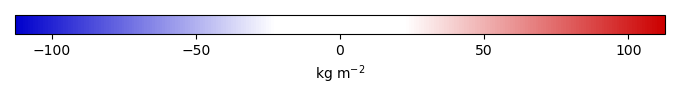
Bias [kg m-2] |
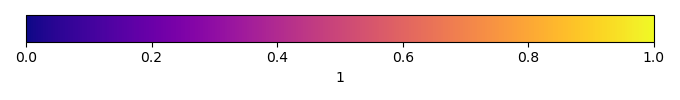
Bias Score [1] |
Spatial Distribution Score [1] |
Overall Score [1] |
|||
|---|---|---|---|---|---|---|---|---|---|---|---|---|
| Benchmark | [-] | 473. | ||||||||||
| PPE_115 | [-] | 1.64e+03 | 586. | 473. | 1.04e+03 | 0.316 | 5.93 | 0.531 | 0.590 | 0.560 | ||
| TRENDY2024 | [-] | 1.51e+03 | 762. | 472. | 751. | 0.940 | 13.6 | 0.505 | 0.282 | 0.393 | ||
| TRENDY2025 | [-] | 1.01e+03 | 331. | 472. | 682. | 0.940 | -6.10 | 0.582 | 0.784 | 0.683 |
Temporally integrated period mean